George Dorgan
My articles My siteAbout meMy videosMy books
Follow on:LinkedINTwitterSeeking Alpha
CFA SocietyEconomicBlogs
|
Swiss Franc Currency IndexThe Swiss Franc index was mostly unchanged against the U.S. Dollar Index in the last week. One word about Marc Chandler’s argumentation below:
Three types of investors are long the dollar:
All three points speak for a stronger dollar. On the other side: In summary, the flows 1-3 must counter the negative U.S. current account and flow 4. |
Trade-weighted index Swiss Franc, February 18(see more posts on Swiss Franc Index, )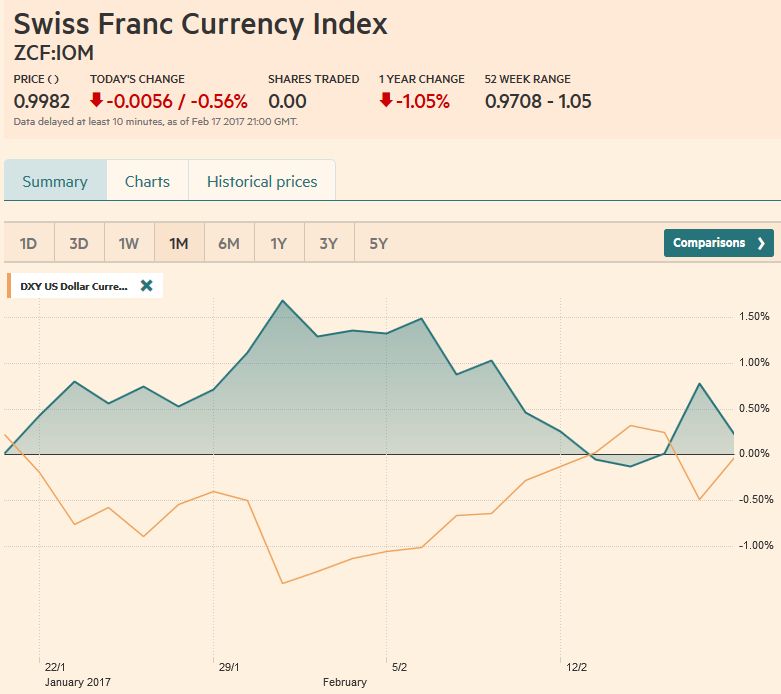 Source: markets.ft.com - Click to enlarge |
EUR/CHFUsing the same arguments to decide between EUR and CHF:
Point 4 is not sufficient to counter the strong Swiss trade and current surplus. On the contrary the SNB must continuously intervene. Hence we see both EUR/USD and EUR/CHF tend towards parity. If the SNB did not intervene, we would rather see EUR/CHF at parity than the EUR/USD. |
Swiss Franc Currency Index (3 years), February 18(see more posts on Swiss Franc Index, )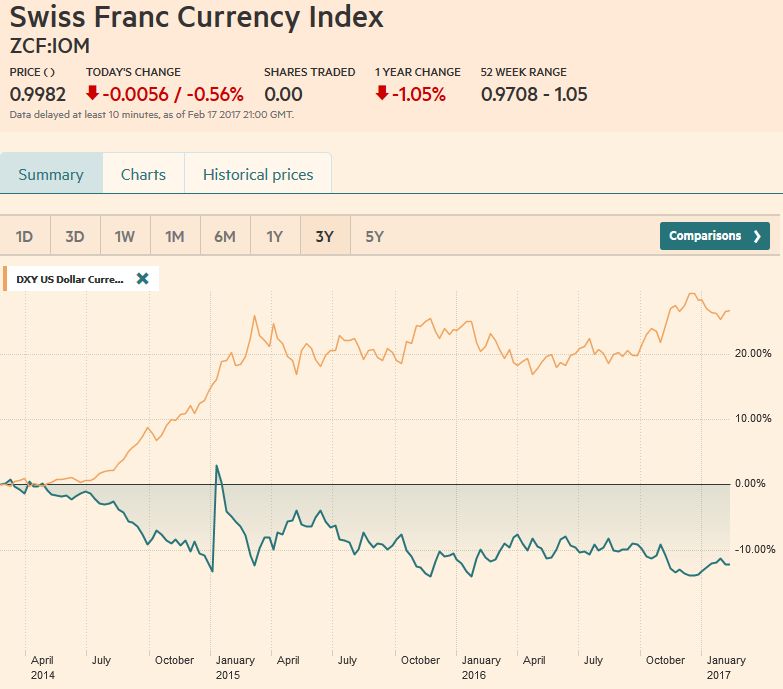 Source: markets.ft.com - Click to enlarge |
|
Marc Chandler My articles My offerMy siteAbout meMy videosMy books Follow on:LinkedINTwitterSeeking AlphaAmazon USD/CHFIt is our understanding of the macroeconomic fundamentals that anchors our view of the underlying dollar trend.
One of our key fundamental considerations is the divergence of interest rates. The US premium over Germany in both the
two- and ten-year tenors widened in recent days to the most this year and approached the extremes seen last December. While we recognize that the BOJ’s bond buying has slowed and that the ECB may taper later this year, we do not see this as preventing a further widening of the US premium. Moreover, the Fed funds futures market has two Fed hikes priced in but has only a little more than a quarter of a third hike discounted. In addition, investors are anxious for more details about the US tax reform. President Trump has hinted that it may be contained in the speech to both sessions of Congress at the end of the month. A cut in corporate taxes and the border adjustment (tax on imports, tax relief for exports) are seen as dollar-positive, and this may also lend the dollar
support. |
US Dollar/Swiss Franc FX Spot Rate, February 18(see more posts on USD/CHF, )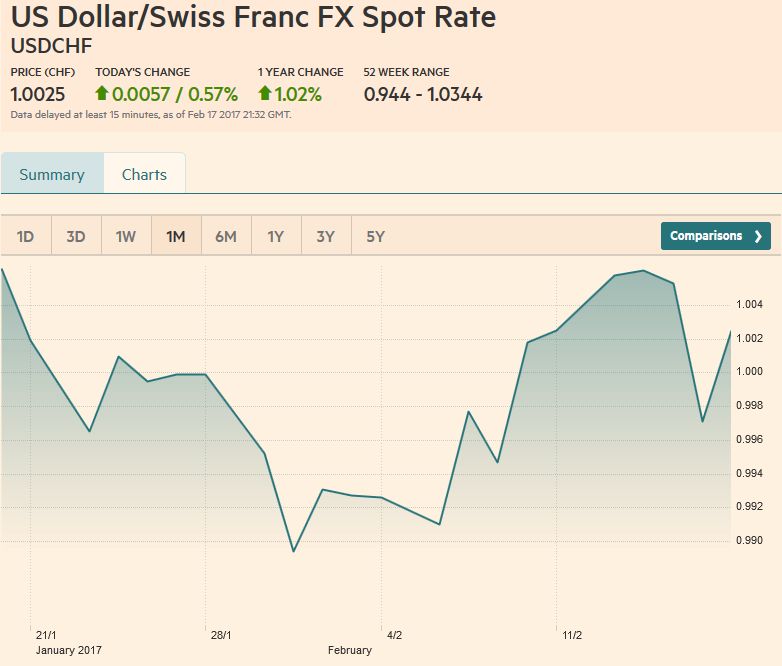 Source: markets.ft.com - Click to enlarge |
US Dollar IndexThe Dollar Index rallied for ten consecutive sessions through February 14. Despite a series of stronger than expected US data, and confirmation from the leadership of the Federal Reserve of rising confidence that full employment is at hand and that price pressures will rise toward the target, the greenback’s momentum faltered.
During the ten-day rally, the Dollar Index retraced a little more than 50% of January’s decline, and the subsequent retreat saw it give back a little more than half of those gains. It stabilized ahead of the weekend. Many participants are perplexed. They see constructive fundamentals, but a disappointed that the greenback did not sustain the upside momentum. They are not sure of the underlying trend, or if the trend is still higher, and many are not convinced the downside correction is over.
The Dollar Index closed little changed last week with the help of the pre-weekend recovery. A break of 100.40 would not look good, but it requires a break of 100.20, which also coincides with the 100-day moving average to undermine our still constructive outlook. On the upside, a move above 101.25 would be an early signal that the dollar’s uptrend resuming.
|
US Dollar Currency Index, February 18(see more posts on US Dollar Index, )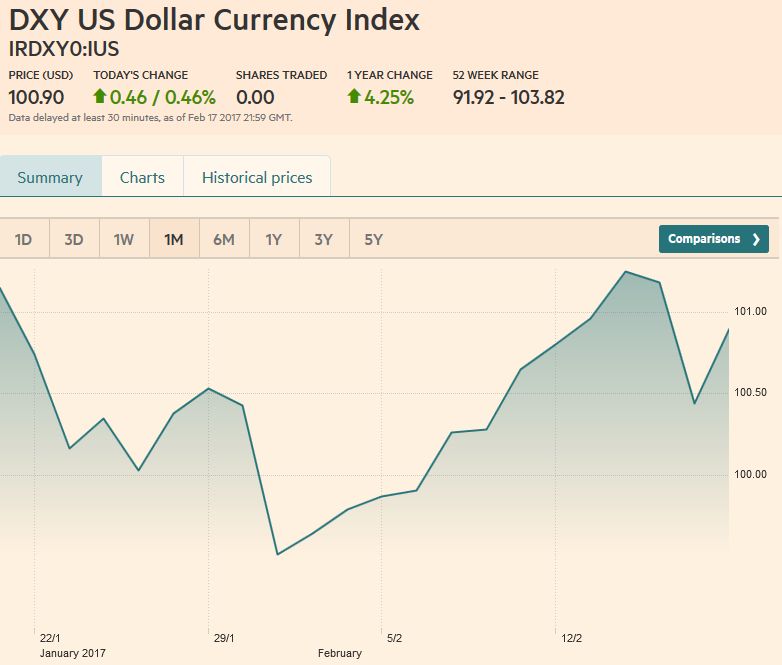 Source: markets.ft.com - Click to enlarge |
EUR/USDThe euro peaked on February 2 near $1.0830 and trended lower through February 15 when it reached almost $1.0520. It reversed higher and reached, nearly $1.0680 the following day. This is five hundredths of a penny beyond the 50% retracement objective of the decline in the first half of February. However, sellers emerged ahead of the weekend and pressed the euro back to nearly $1.06. It may prove sticky around $1.0580, and a break of $1.0520 is needed signal the next leg lower, toward $1.0450 initially and then the low seen in December and January in the $1.0340-$1.0350 area.
The RSI and MACDs are consistent with losses next week, though the Slow Stochastics have leveled off in overextended
territory. |
EUR/USD with Technical Indicators, February 13 - 18(see more posts on Bollinger Bands, EUR/USD, MACDs Moving Average, RSI Relative Strength, Stochastics, )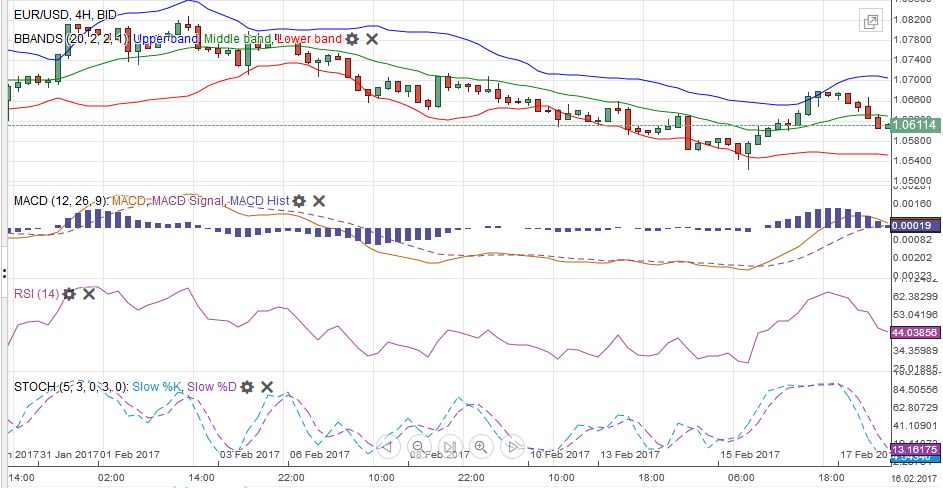 EUR/USD Week Ending February 18 with Technical Indicators - Click to enlarge |
USD/JPYThe US dollar peaked against the Japanese yen in the middle of last week, just shy of JPY115, and the 50% retracement of the decline since reaching JPY118.60 at the start of the year. However, unlike the euro, the yen remained firm ahead of the weekend. Heavier equities prices and the softer US yields are often associated with yen gains. The JPY112.90-JPY113.30 band offers the immediate cap on the buck. The JPY111.60 area is also important to support. It corresponds to a 38.2% of the dollar’s recovery from last summer, and it is where a basem was formed earlier this month. The technical indicators are not generating strong signals and, although the five-day moving average crossed above the 20-day at midweek for the first time since January 6, it has not been impulsive, of the risk of being whipsawed. |
USD/JPY with Technical Indicators, February 13 - 18(see more posts on Bollinger Bands, MACDs Moving Average, RSI Relative Strength, Stochastics, USD/JPY, )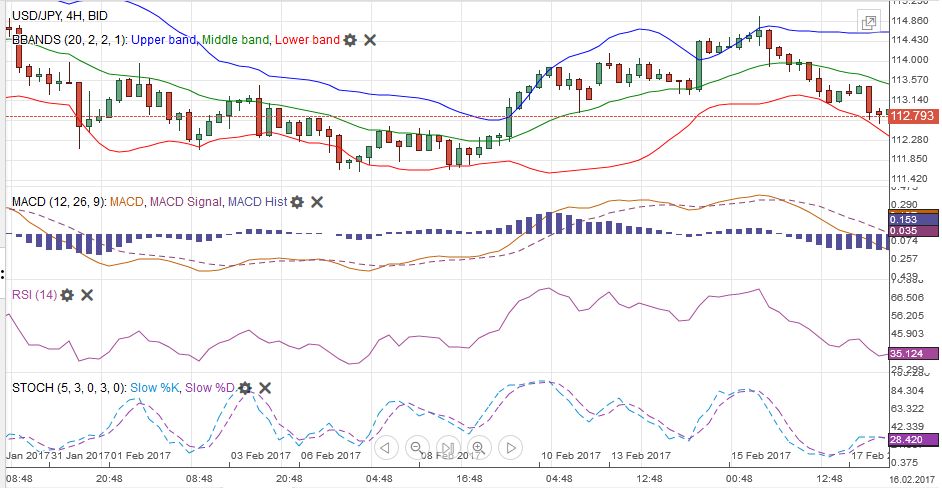 USD/JPY Week Ending February 18 with Technical Indicators - Click to enlarge |
GBP/USDSince January 24, sterling has dipped below $1.24 three times, and two of them took place last week. Each time buying materialized, preventing sterling from closing below $1.24. Sterling appears to be tracing out a triangle pattern. The down sloping top line connects the February 9, 14, and 16 highs. It is found near $1.2510 on Monday, February 20 and $1.2460 by the end of the week. The up trending lower line connects the February 7, 15 and 17 lows. It is near $1.2390 on Monday and rises a little above $1.2400 at the end of the week. The low for February has been $1.2340, which corresponds to a 50% retracement of sterling’s bounce from the year’s lows recorded on January 16 when it slipped briefly through $1.20. A break of the February low would offer $1.2260 as the next target. |
GBP/USD with Technical Indicators, February 13 - 18(see more posts on Bollinger Bands, GBP/USD, MACDs Moving Average, RSI Relative Strength, Stochastics, )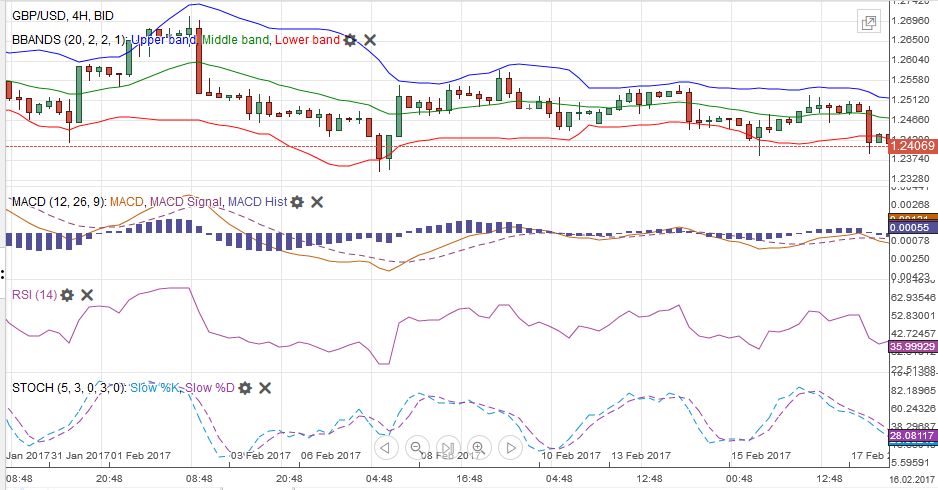 GBP/USD Week Ending February 18 with Technical Indicators - Click to enlarge |
AUD/USDFor most of the month, the Australian dollar has chopped between $0.7600 and $0.7700. It looked to break to the upside last week and even closed above the cap on February 15. Poor employment data on February 16 may have prevented it from closing again above $0.7700, but it did reach nearly $0.7735 first. Still, it remained resilient, helped perhaps by retail interest in a re-opening of a sovereign bond offering. It was sold before the weekend down to almost $0.7655.
The price action over the last two sessions has been poor,
and this is deteriorating the technical condition. The technical indicators did not confirm the new highs, leaving mild bearish divergences in the wake, with the RSI and MACDs turning down. Them Slow Stochastics is flat. A move to the 20-day moving average (~$0.7625), which has not been seen since January 5 would begin the retest on the $0.7600 floor. Given how solid it has been, a break would likely trigger stops. |
AUD/USD with Technical Indicators, February 13 - 18(see more posts on Australian Dollar, Bollinger Bands, MACDs Moving Average, RSI Relative Strength, Stochastics, )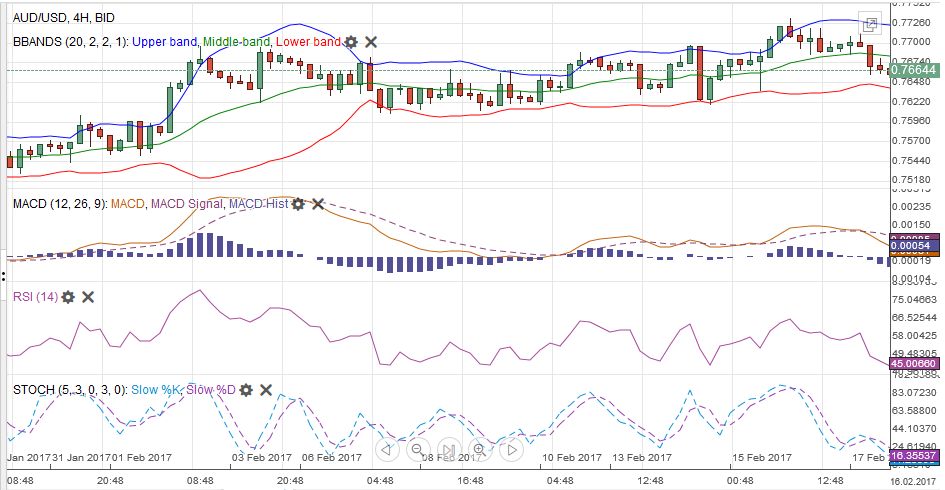 AUD/USD Week Ending February 18 with Technical Indicators - Click to enlarge |
USD/CADThe US dollar rose against its Canadian counterpart for the second week. However, the gain was minor (~0.2%) and over the two weeks has been insufficient to offset the one percent decline in the week ending February 3. Starting January 31, the US dollar has repeatedly tested the CAD1.30 level. There had been some penetration on an intraday basis earlier this month, but never a close below it. A hammer candlestick may have been formed on February 16, and there were follow through US dollar gains ahead of the weekend and new highs for the week were recorded near CAD1.3125. The initial potential may be toward CAD1.3160,
|
USD/CAD with Technical Indicators, February 13 - 18(see more posts on Bollinger Bands, Canadian Dollar, MACDs Moving Average, RSI Relative Strength, Stochastics, ) USD/CAD Week Ending February 18 with Technical Indicators - Click to enlarge |
Crude OilCrude oil prices are uninspiring. The April light sweet futures contract is the front month now. It eased for the second week but has gone nowhere. It was confined to a roughly $53.00 $54.50 range last week. The trend following technical indicators is of little help here. The 5-, 20- and 50-day moving averages have converged (~$53.50-$54.10). Some appear to turn more cautious as OPEC’s output is essentially unchanged over the past year, and US production is slowly increasing, and inventories are near record levels. The longer-term technical indicators seem to favor a move lower.
|
Crude Oil, Mar 2016 - Feb 2017(see more posts on Crude Oil, ) Source: Bloomberg.com - Click to enlarge |
U.S. TreasuriesThe US 10-year yield has carved out a clear trading range in the first six weeks of 2017. A trend line drawn off that low and the January 26 low and February 14 low was violated on February 15. But, it quickly bounced back and closed above the trend line on February 16 and 17. It was found near 124-03 ahead of the weekend and rises about 1/32 a day, finishing next week near 124-09. There are many potential developments that can press US rates, and not all of them are domestic considerations, but we view the rise in the note futures (decline in yield) as corrective or counter-trend. The upper end of the range is seen near 125-22, which held in both January and February, and corresponds to a 38.2% retracement of the sell-off since the November election. A break of this could spur another big figure move toward 126-22, where the 50% retracement is found. |
Yield US Treasuries 10 years, Mar 2016 - Feb 2017(see more posts on U.S. Treasuries, )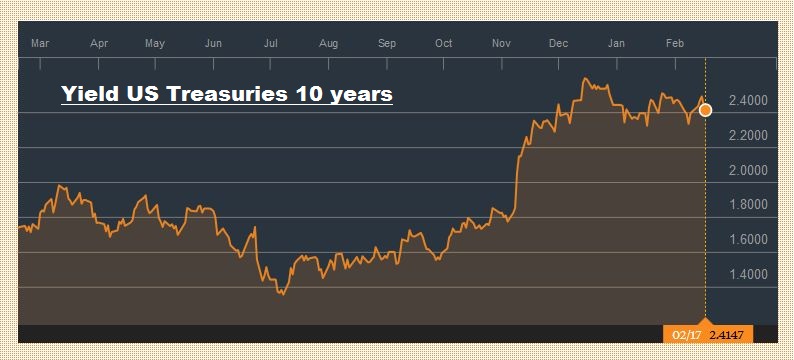 Source: Bloomberg.com - Click to enlarge |
S&P 500 IndexThe seven-day advance in the S&P 500 ended on February 16, but it recovered ahead of the weekend to post a new closing record high. The S&P 500 finished higher for the fourth consecutive week. The 1.5% rise for the week was the best among the G7 markets. Japan’s Topix was the only G7 bourse to fall last week (-015%).
|
S&P 500 Index, February 18(see more posts on S&P 500 Index, )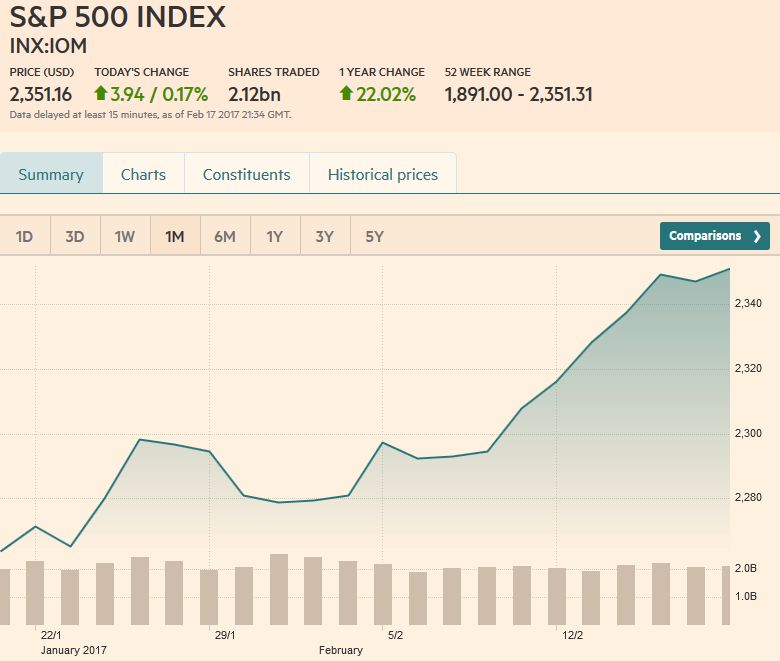 Source: markets.ft.com - Click to enlarge |
Are you the author?
Tags: Australian Dollar,Bollinger Bands,British Pound,Canadian Dollar,Crude Oil,Dollar Index,EUR/CHF,EUR/USD,Euro,Euro Dollar,Japanese yen,MACDs Moving Average,newslettersent,RSI Relative Strength,S&P 500 Index,Stochastics,Swiss Franc Index,U.S. Treasuries,US Dollar Index,usd-jpy,USD/CHF,USD/JPY