George Dorgan
My articles My siteAbout meMy videosMy books
Follow on:LinkedINTwitterSeeking Alpha
CFA SocietyEconomicBlogs
|
Swiss Franc Currency IndexDuring the last month the Swiss Franc index recovered some of the losses since the election of Donald Trump. Its performance is +2%, while the dollar index is 2% down.
|
Trade-weighted index Swiss Franc, January 21(see more posts on Swiss Franc Index, )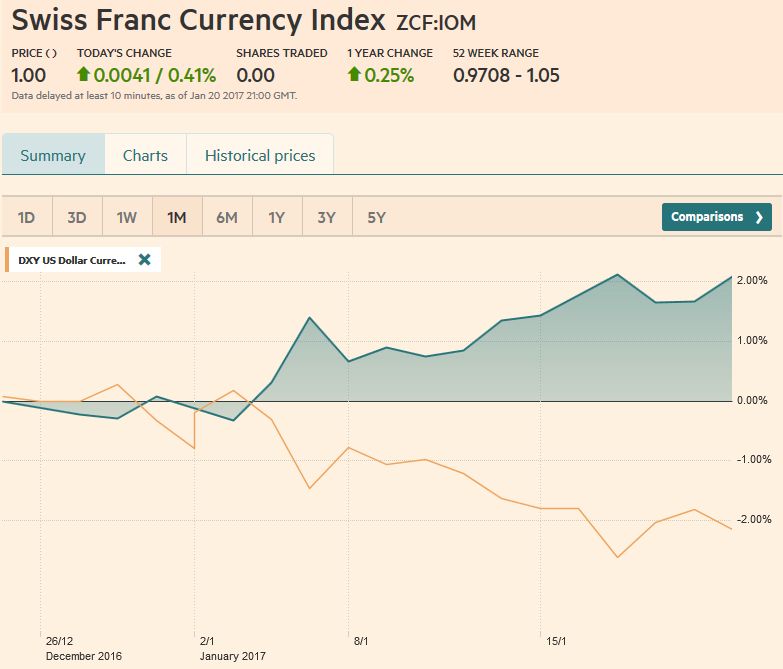 Source: markets.ft.com - Click to enlarge |
Swiss Franc Currency Index (3 years)The Swiss Franc index is the trade-weighted currency performance (see the currency basket)On a three years interval, the Swiss Franc had a weak performance. The dollar index was far stronger. The dollar makes up 33% of the SNB portfolio and 25% of Swiss exports (incl. countries like China or Arab countries that use the dollar for exchanges). Contrary to popular believe, the CHF index gained only 1.73% in 2015. It lost 9.52% in 2014, when the dollar (and yuan) strongly improved. |
Swiss Franc Currency Index (3 years), January 21(see more posts on Swiss Franc Index, ) Source: markets.ft.com - Click to enlarge |
|
Marc Chandler My articles My offerMy siteAbout meMy videosMy books Follow on:LinkedINTwitterSeeking AlphaAmazon USD/CHFThe US dollar turned in a mixed performance over the past week. The technical indicators continue to support our expectation that after correcting since mid-December, following the Fed’s hike, the dollar is basing.
|
US Dollar/Swiss Franc FX Spot Rate, January 21(see more posts on USD/CHF, ) Source: markets.ft.com - Click to enlarge |
US Dollar Index The Dollar Index set the corrective low on January 17 near 100.25.
It recovered 150 points before consolidating ahead of the weekend. The MACDs and Slow Stochastics continue to suggest the downside correction is in its last stage. A move above 102.00 would likely indicate the bull trend has resumed. |
US Dollar Currency Index Dollar Index, January 21(see more posts on Dollar Index, )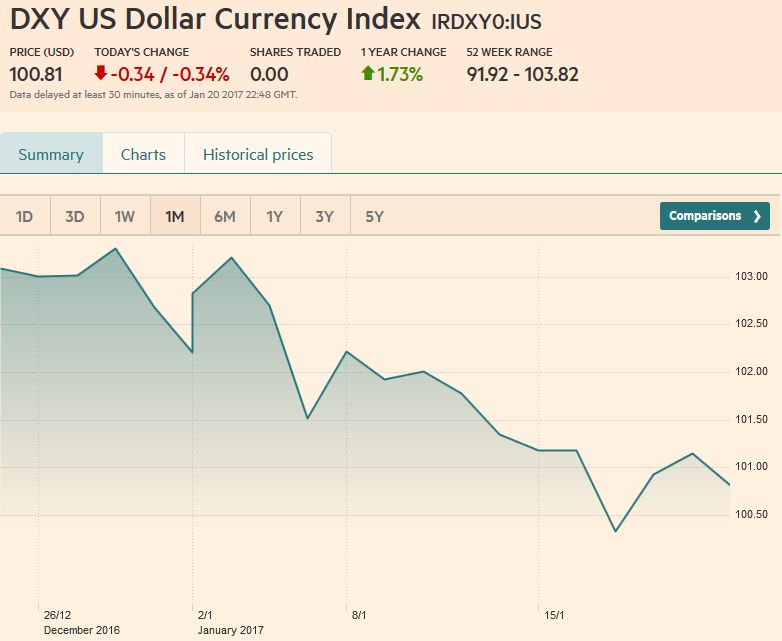 Source: markets.ft.com - Click to enlarge |
EUR/USDFor eight sessions now, the euro has chopped between about $1.0570 and $1.0710. Dips have been bought as much as rallies have been sold. The technicals indicators yet to turn, but they likely will in the week ahead. A break of $1.0575 would be a preliminary sign that the upside correction is over. The euro has not closed below its 20-day moving average since January 3. It will start the new week near $1.0550. On the upside, a move above $1.0725 could spur another cent advance. |
EUR/USD Week Ending January 21 with Technical Indicators(see more posts on Bollinger Bands, EUR/USD, MACDs Moving Average, RSI Relative Strength, Stochastics, )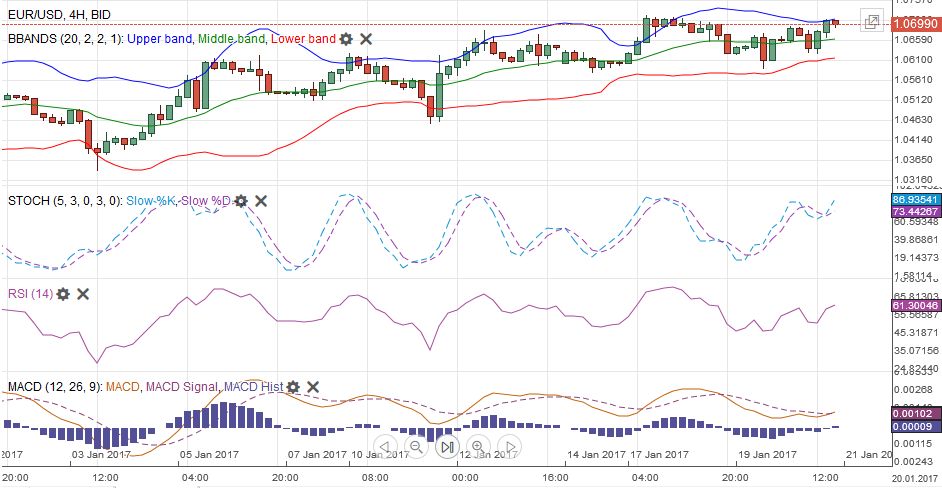 EUR/USD MACDS Stochastics Bollinger Bands RSI Relative Strength Moving Average January 21 - Click to enlarge |
USD/JPYThe US dollar recorded an outside up day against the yen on January 18. The Slow Stochastics and MACDs are poised to turn higher in the coming days. |
USD/JPY Week Ending January 21 with Technical Indicators(see more posts on Bollinger Bands, Japanese yen, MACDs Moving Average, RSI Relative Strength, Stochastics, )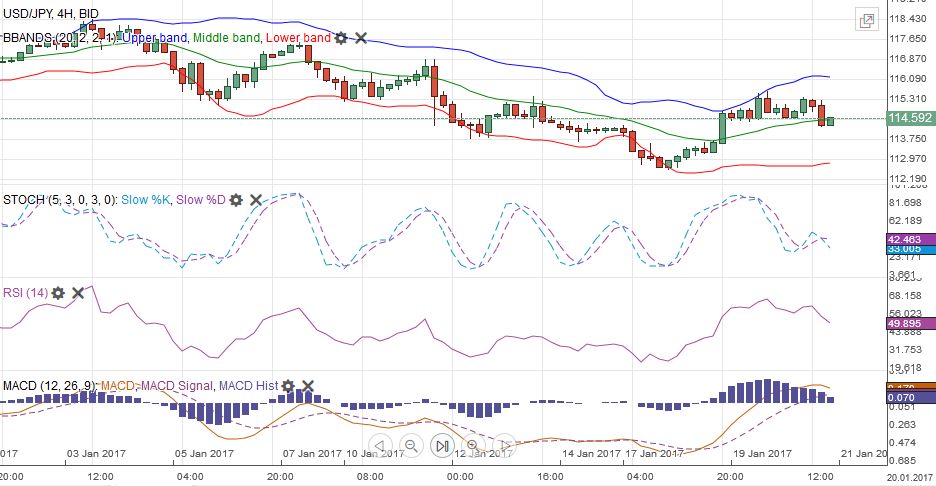 USD/JPY MACDS Stochastics Bollinger Bands RSI Relative Strength Moving Average January 21 - Click to enlarge |
GBP/USDOwing largely it seems to the issues surrounding Brexit, sterling is marching to a different beat. It gapped lower to start the week and rallied strongly on January 17. It consolidated since, finding support near the 20-day moving average near $1.2260. The technical indicators suggest another attempt higher is likely, perhaps in response to the Supreme Court decision expected early in the week ahead. The downtrend line connecting the early September high and the highs from the first of December is found near $1.2440 at the start of next week and finishes the week near $1.2400. Another nearby target could be the 61.8% retracement of the fall since the December 6 high near $1.2775. |
GBP/USD Week Ending January 21 with Technical Indicators(see more posts on Bollinger Bands, British Pound, MACDs Moving Average, RSI Relative Strength, Stochastics, )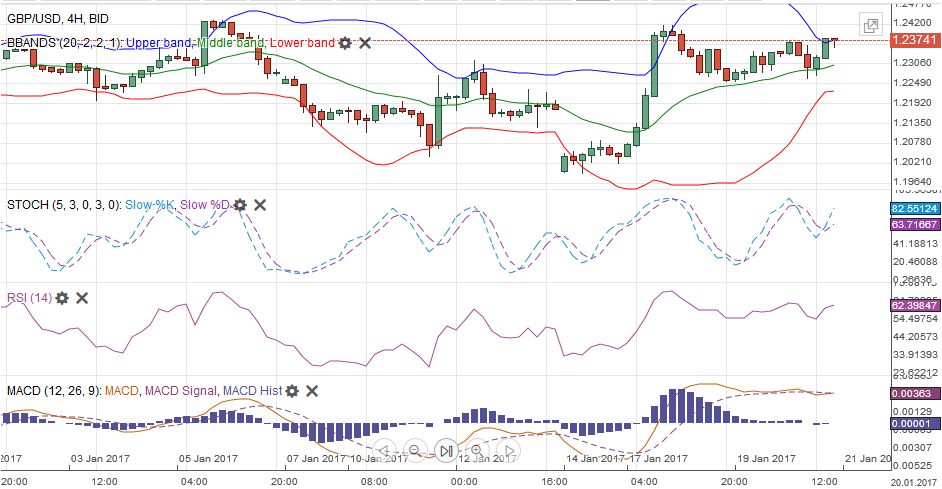 GBP/USD MACDS Stochastics Bollinger Bands RSI Relative Strength Moving Average January 21 - Click to enlarge |
AUD/USDThe Australian dollar tacked on a little more than 0.5% against the dollar to reach almost $0.7600 and its best level since mid-November.
At $0.7540, the Aussie retraced 61.8% of the drop since the US election. The technical indicators are getting stretched, but only the Slow Stochastics appear near turning down. Initial support is likely to be seen around $0.7500-$0.7525. It may take a break of $0.7425 to encourage ideas that a top is in place. We suspect that above $0.7600 and the risk-reward changes and may deter new buyers. |
AUD/USD Week Ending January 21 with Technical Indicators(see more posts on Australian Dollar, Bollinger Bands, MACDs Moving Average, RSI Relative Strength, Stochastics, )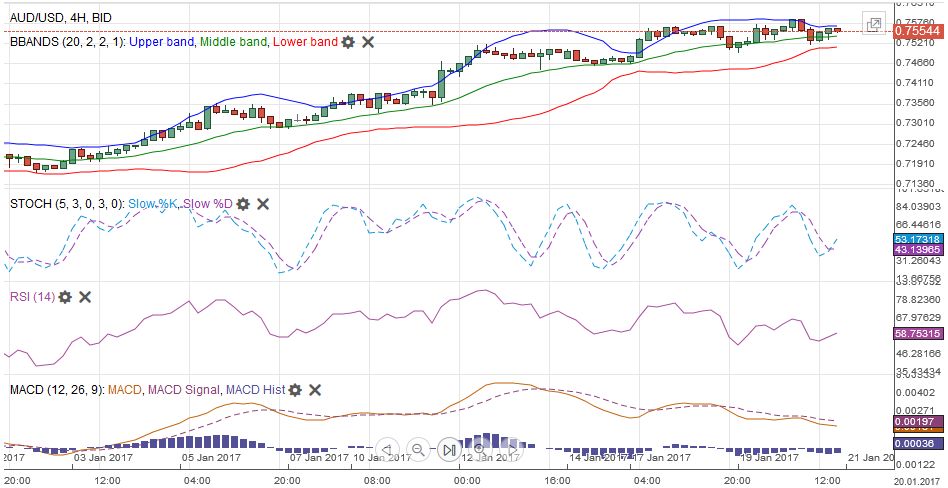 AUD/USD MACDS Stochastics Bollinger Bands RSI Relative Strength Moving Average January 21 - Click to enlarge |
USD/CADThe Canadian dollar was the worst performing of the major currencies last week. The combination of rising US rates, Trump officials signaling intention to re-open NAFTA negotiations, and somewhat soft data saw the Canadian dollar shed 1.8%. After testing the CAD1.30 area at the start of the week, recording a three-month low, the US dollar recovered strongly and by the end of the week had retraced 61.8% of the down move that began in late December (from ~CAD1.36). The technical indicators are constructive. Given the sharpness of the advance, some consolidation or backing and filling may be seen. Support is pegged near CAD1.3250. |
USD/CAD Week Ending January 21 with Technical Indicators(see more posts on Bollinger Bands, Canadian Dollar, MACDs Moving Average, RSI Relative Strength, Stochastics, )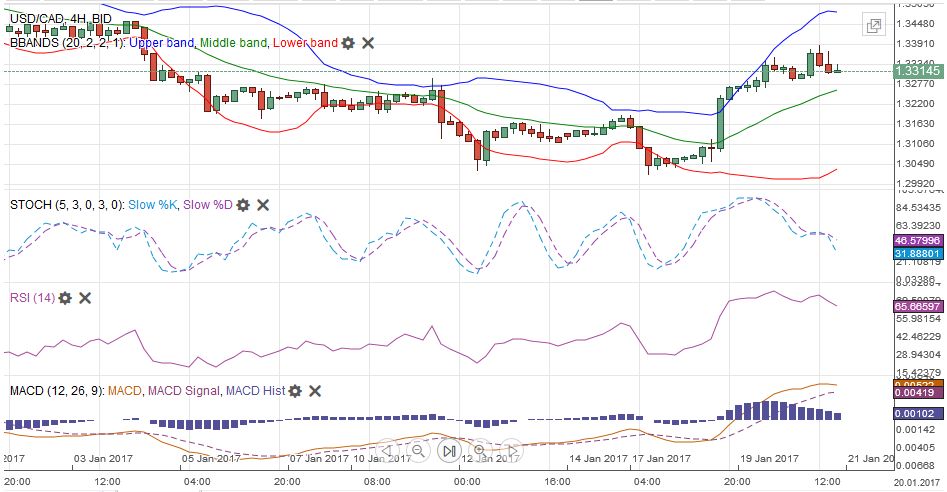 USD/CAD MACDS Stochastics Bollinger Bands RSI Relative Strength Moving Average January 21 - Click to enlarge |
Crude OilThe March crude oil futures contract retested support a little below $52 a barrel, which had held earlier in the month. The technical indicators favor additional gains. Since the middle of last November, the March contract has risen all but two weeks. The week ending January 13 snapped a four week advance. The uptrend resumed with a modest 0.75% gain. The contract has to surpass $54.40 to signal a return to the contract high near $56.20. |
Crude Oil, January 21(see more posts on Crude Oil, )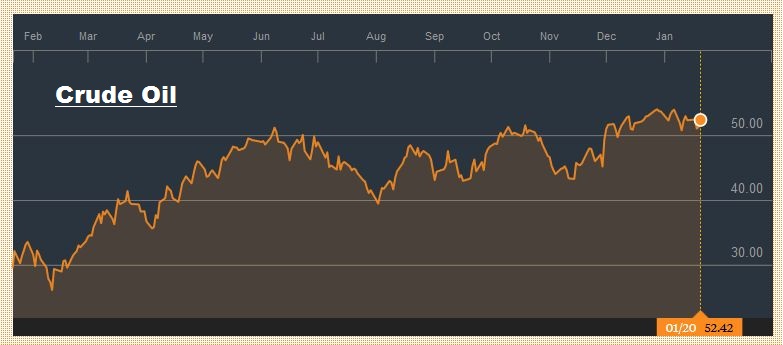 Source: bloomberg.com - Click to enlarge |
U.S. TreasuriesA seemingly necessary precondition for a stronger dollar is higher US rates.
The US 10-year yield bottomed near 2.30% early last week and finished near 2.45%, after having pushed through 2.50% earlier. The 2.50%-2.57% area is a band of congestion from last month. The March note futures peaked at 125-13 on January 17, and by the end of the week, it was flirting with the 50% retracement of the gains since the Fed’s hike (123-30). The 61.8% retracement is near 123-19. The bottom of congestion is seen near 123-00. The MACDs are just crossing lower, while the Slow Stochastics have been gradually trending lower for the better part of two weeks. The five-day average may slip below the 20-day average for the first time this month in a few days.
The US 10-year premium over Germany widened by six basis points over the past week to 3.16%. The spread recorded the mult-iyear high on December 16 near 3.39%. The US premium over Japan widened eight basis points to 2.42%. That is the highest of the year. It peaked near 2.51% on the day the Fed hiked.
The US two-year premium over Germany was off by a single basis point, a little below 1.90%. It peaked near 2.05% on December 15 and December 28. The low point has been around 1.88%.
The short-end spread seems to be more important for the euro than the long-end spread. The US two-year premium over Japan has been more stable than against Germany. It peaked a little above 1.46% on December 15 and finished last week near 1.45%.
|
Yield US Treasuries 10 years, January 21(see more posts on U.S. Treasuries, )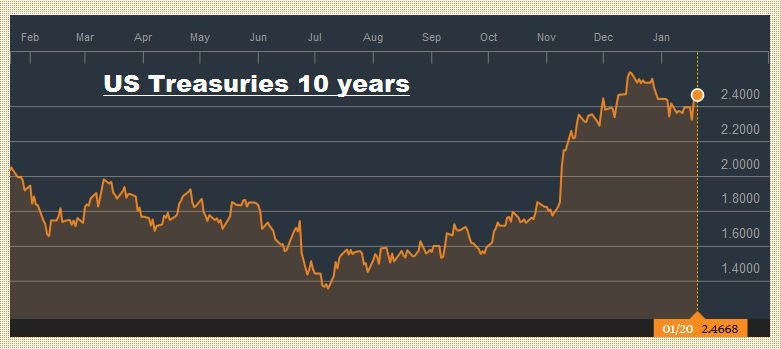 Source: bloomberg.com - Click to enlarge |
S&P 500 IndexThe S&P 500 has been choppy but has gone practically nowhere in recent weeks. It finished the first week of the year near 2277 and 2275 in the second week. Last week it finished near 2274. The technical indicators are not generating robust signals. The Slow Stochastics have turned lower. The MACDs had been drifting lower since around the Fed’s hike last month, but appear to be stabilizing and could turn higher early next week. The prospect of business-friendly policies, including deregulation and tax reform may be helping to support the market, while fear that much good news is already discounted in the market’s 7.4% rally since the election, tempers enthusiasm. |
S&P 500 Index, January 21(see more posts on S&P 500 Index, )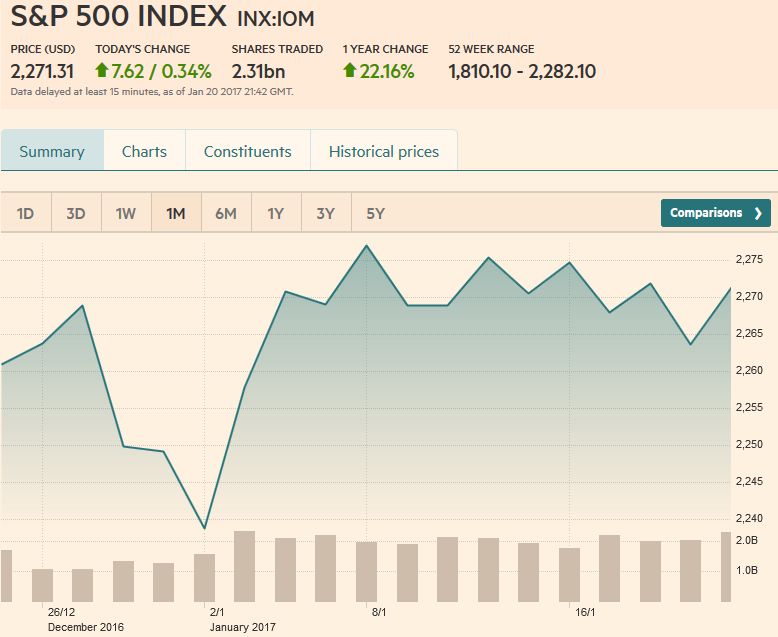 Source: markets.ft.com - Click to enlarge |
Are you the author?
Tags: Australian Dollar,Bollinger Bands,British Pound,Canadian Dollar,Crude Oil,Dollar Index,EUR/CHF,EUR/USD,Euro,Euro Dollar,Japanese yen,MACDs Moving Average,newslettersent,RSI Relative Strength,S&P 500 Index,Stochastics,Swiss Franc Index,U.S. Treasuries,USD/CHF,USD/JPY