


Marc Chandler
My articles My offerMy siteAbout meMy videosMy books
Follow on:LinkedINTwitterSeeking AlphaAmazon
Swiss Franc Currency IndexWith last Friday’s break-down of the dollar, the Swiss Franc index could recover a bit. Its loss over December is now 1%. But the dollar index had a gain of 2%.
|
Trade-weighted index Swiss Franc, December 30(see more posts on Swiss Franc Index, )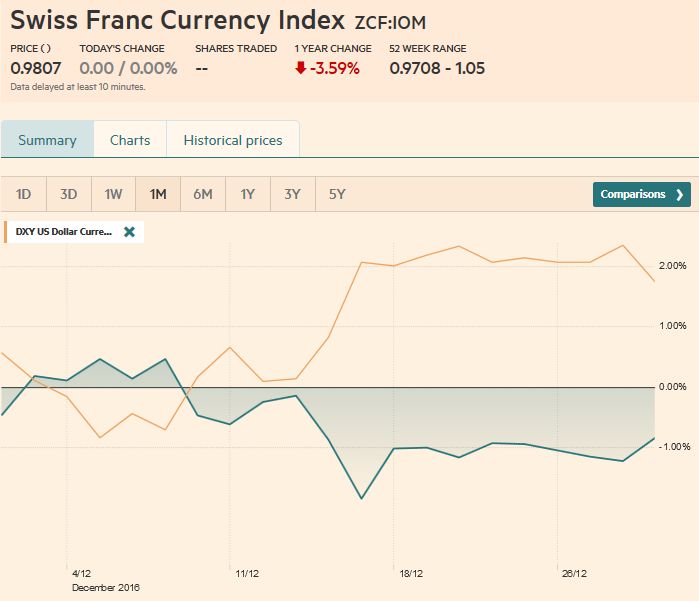 Source: FT.com - Click to enlarge |
Swiss Franc Currency Index (3 years)The Swiss Franc index is the trade-weighted currency performance (see the currency basket)On a three years interval, the Swiss Franc had a weak performance. The dollar index was far stronger. The dollar makes up 33% of the SNB portfolio and 25% of Swiss exports (incl. countries like China or Arab countries that use the dollar for exchanges). Contrary to popular believe, the CHF index gained only 1.73% in 2015. It lost 9.52% in 2014, when the dollar (and yuan) strongly improved. |
Swiss Franc Currency Index (3 years)(see more posts on Swiss Franc Index, )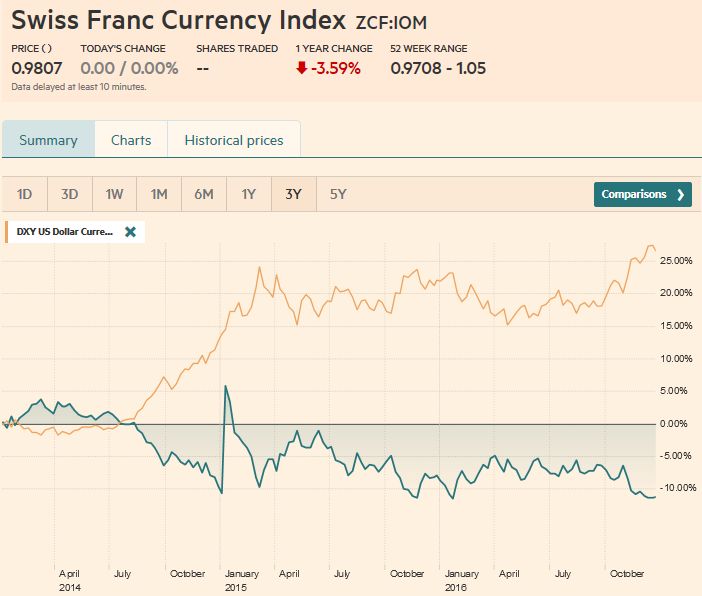 Source: FT.com - Click to enlarge |
|
USD/CHFThe technical condition of the US dollar, which has been advancing through most of the Q4 16, has been deteriorating in our assessment. This led us to anticipate a consolidative or corrective phase. Although the holiday-thinned market conditions may have spurred We have argued that the dollar rally was part of a larger |
US Dollar/Swiss Franc FX Spot Rate, December 30(see more posts on USD/CHF, )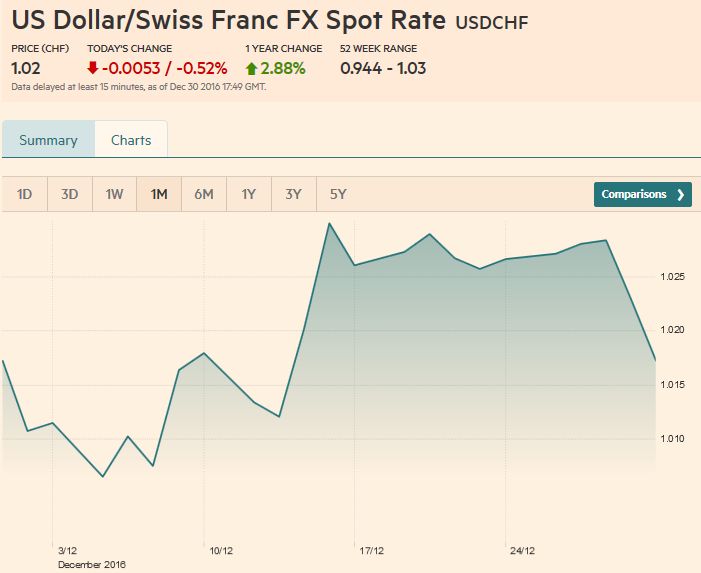 Source: FT.com - Click to enlarge |
US Dollar IndexIn the last trading session of 2016, the Dollar Index slipped through its 20-day moving average (102.15) for the first time in a couple of weeks, but managed to close just above it (~102.20). It could have put in a third point in a trend line that connects, the November 9 (~95.90), December 8 (~99.45) and December 30 low (~101.95). Nevertheless, the technical indicators remain bearish. The Dollar Index has been stalling. Consider the highs from the past three weeks, 103.56, 103.65 and 103.63. The week’s 0.8% loss snaps a three-week advance. Last week, we suggested the potential of this pullback extends to 101.00-101.50. This still seems reasonable at this juncture, though the risk is over an overshoot to the downside. The 100.70 area may be key for the outlook for Q1/17. |
US Dollar Currency Index, December 30(see more posts on Dollar Index, )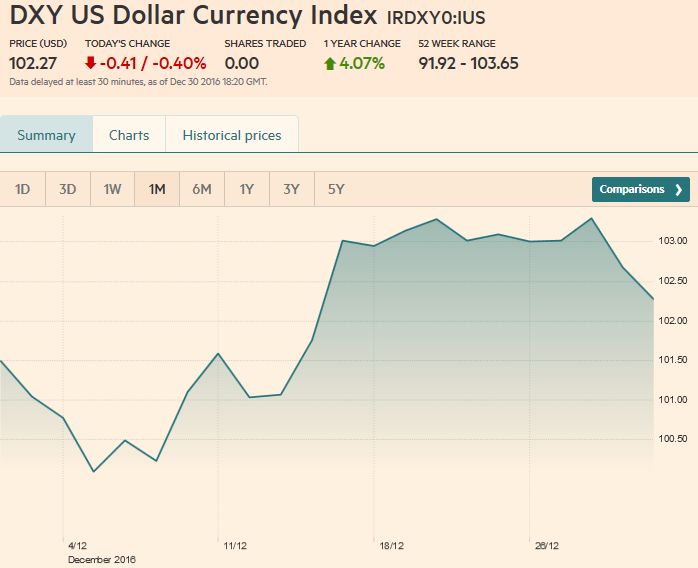 Source: FT.com - Click to enlarge |
EUR/USDThe euro spiked briefly through $1.0650 on the last trading session of the year. Although this proved premature as the euro quickly surrendered the gains, the near-term outlook is constructive. The fading upside momentum in the Dollar Index was matched by the euro, its largest component. The euro’s lows from the last three weeks are $1.0367, $1.0352, and $1.0372. The MACD and Slow Stochastics have turned up, and the five-day moving average is set to cross above the 20-day average in the coming days. Last week, we suggested potential toward $1.0675, but the way the correction has unfolded, it looks like there is scope for gains beyond there. The $1.0715 area represents a 38.2% |
Euro/US Dollar FX Spot Rate, December 30(see more posts on EUR/USD, )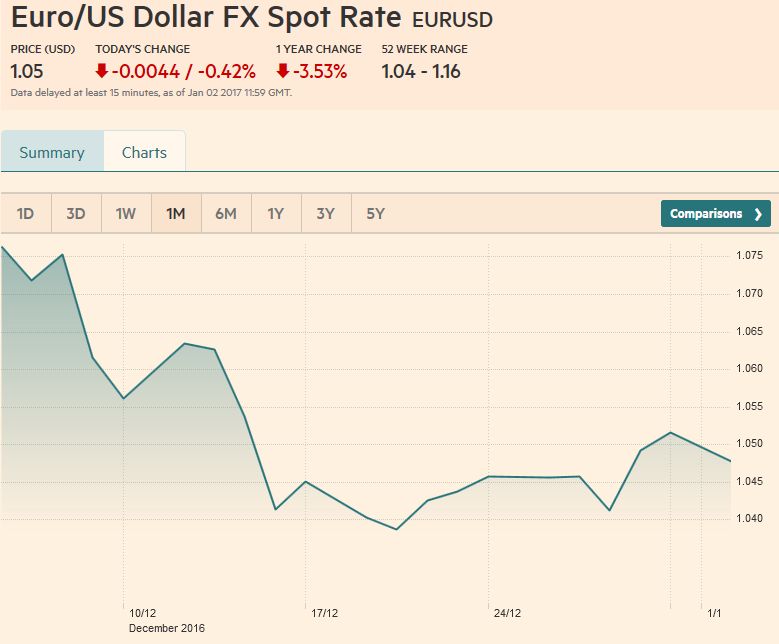 Source: FT.com - Click to enlarge |
USD/JPYThe dollar marched higher against the yen for six consecutive weeks but has not fallen for two. Indeed, at the end of last week, the greenback slipped below its 20-day moving average against the yen for the first time since the day after the US election. We had anticipated a move to JPY116.50 last week. The dollar fell to almost JPY116 last week, roughly corresponding to a 50% retracement of the rally since the December 8 low near JPY113.15. The next target we identified was the JPY115.25-JPY115.50 area. A trend line off the highs since December 15 comes in near JPY117.20 at the end of the week (January 6), though the JPY17.60 area may offer more important resistance.
|
US Dollar/Japanese Yen FX Spot Rate, December 30(see more posts on USD/JPY, )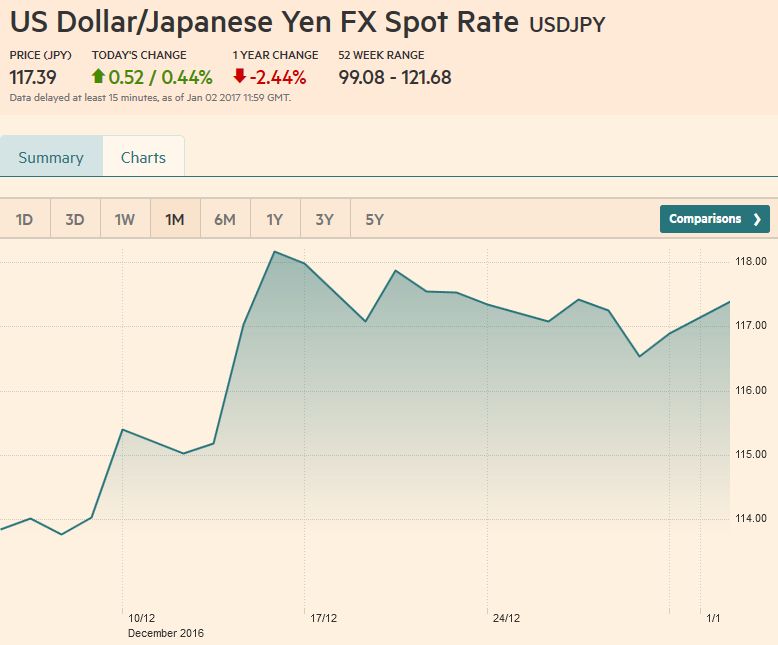 Source: FT.com - Click to enlarge |
GBP/USDSterling finished 2016 above its 5-day moving average for the first time in two weeks. It reached almost $1.2390 before the weekend. The $1.2400 level is a 38.2% retracement of sterling’s losses since the December 14 high a little above $1.2720. Support is seen near $1.2325. The RSI is firming. The Slow Stochastics are about to turn higher, and the MACDs look poised to cross higher as well. The upside beckons. The 50% |
UK Pound Sterling - US Dollar FX Spot Rate, December 30(see more posts on British Pound, ) Source: FT.com - Click to enlarge |
AUD/USDThe Australian dollar reached almost $0.7250 before the New Year, but proceeded to sell-off, briefly dipping below $0.7200 and posted a poor close. Nevertheless, the technical indicators suggest the near-term risk is on the upside. The downside momentum that pushed the Aussie from $0.7525 in mid-December faded in the $0.7160-$0.7175 area. This band is an important support. The MACDs and Slow Stochastics are turning higher. The $0.7250 area needs to be taken out, and the next target is near $0.7300, though the correction may extend toward $0.7350-$0.7380. |
Australian Dollar/US Dollar FX Spot Rate, December 30(see more posts on Australian Dollar, )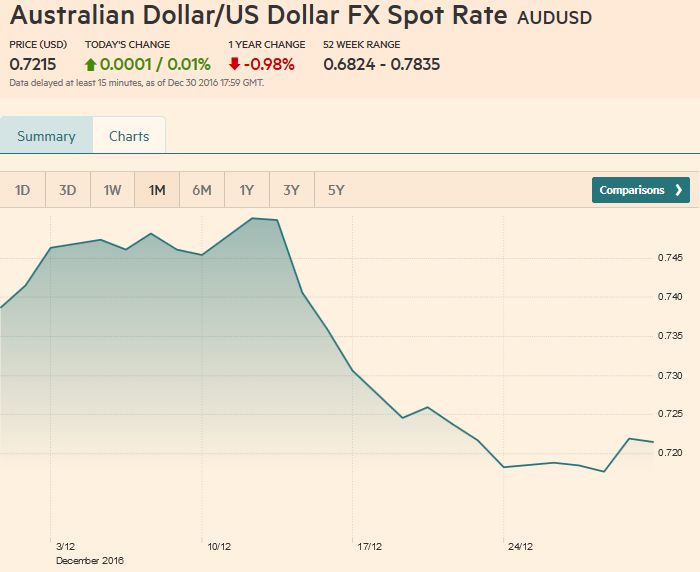 Source: FT.com - Click to enlarge |
USD/CADThe US dollar initially extended its strong recovery against the Canadian dollar but ran out of steam in front of CAD1.36, where it peaked in November. The pullback in the last two sessions of 2016 was sharp. It retraced 38.2% of the nearly three week rally to almost the tick in front of CAD1.3400. The RSI has turned lower, and the MACD and Slow Stochastics appear set to turn lower in the coming days. The 50% retracement objective is near CAD1.3340. |
US Dollar / Canadian Dollar FX Spot Rate, December 30(see more posts on Canadian Dollar, ) Source: FT.com - Click to enlarge |
Crude OilOil prices are firm but are moving broadly sideways. The February light sweet crude futures contract has been |
Crude Oil, December 30(see more posts on Crude Oil, ) Source: Bloomberg.com - Click to enlarge |
U.S. TreasuriesThe US 10-year yield rose from 1.77% to 2.64% in a six-week rally that began after the jobs data in early November. However, in the past two weeks, the yield has pulled back to 2.43%. The pullback may not be complete. The 2.35%-2.40% area offers better value. |
Yield US Treasuries 10 years, December 30(see more posts on U.S. Treasuries, )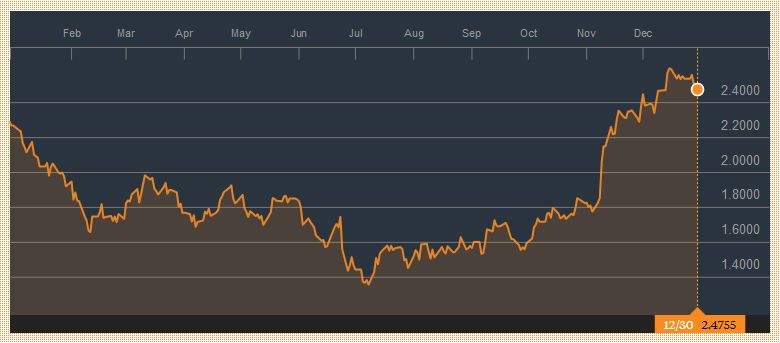 . |
S&P 500 IndexYear-end profit-taking may have prevented the Dow Jones Industrials from going through 20k and saw the S&P 500 finish the year below its 20-day moving average for the first time since November 4 when it recorded a four-month low. The sell-off gave back nearly half of December’s gain (~2232.50). The technical indicators we use warn of additional losses. The 2200 area offers initial support, but near-term potential may extend to 2160. The 200-day moving average is near 2135, and a test on it often
|
S&P 500 Index, December 30(see more posts on S&P 500 Index, ) Source: FT.com - Click to enlarge |
Are you the author?
Tags: Australian Dollar,British Pound,Canadian Dollar,Crude Oil,Dollar Index,EUR/CHF,EUR/USD,Euro,Euro Dollar,Japanese yen,MACDs Moving Average,newslettersent,S&P 500 Index,Swiss Franc Index,U.S. Treasuries,usd-jpy,USD/CHF


