George Dorgan
My articles My siteAbout meMy videosMy books
Follow on:LinkedINTwitterSeeking Alpha
CFA SocietyEconomicBlogs
Swiss Franc Currency IndexAs visible in the graph, the Swiss Franc index recovered most of its losses against the US Dollar Index for the last 30 days. In the last 30 days, both the USD currency index and the CHF currency index have had a positive performance. The USD dollar index still with a +1%, while the CHF index is finally slightly in positive territory. Clearly the major reason, is a new 6 month low on EUR/CHF, when the 1.08 line in sand got broken. |
Trade-weighted index Swiss Franc, November 04, 2016(see more posts on Swiss Franc Index, )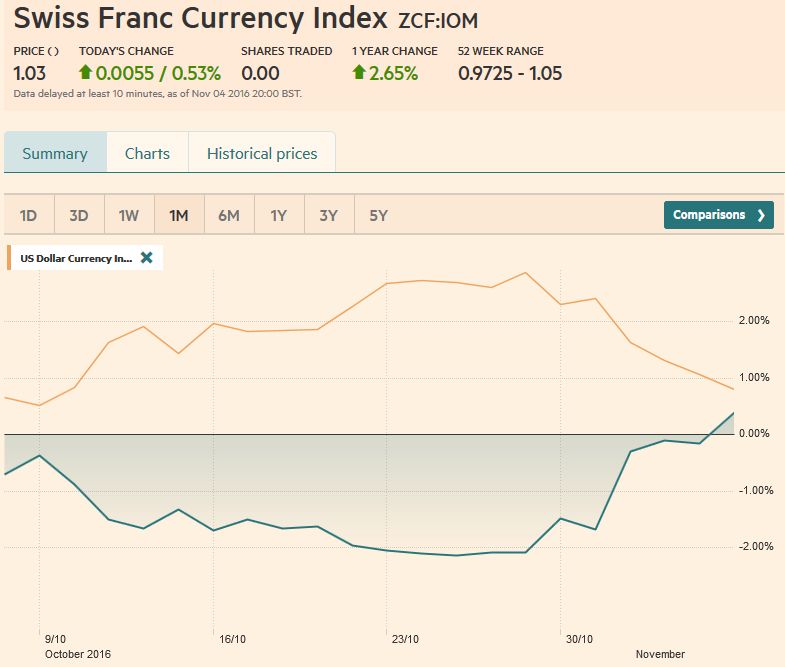 Source: FT.com - Click to enlarge |
Swiss Franc Currency Index (3 years)The Swiss Franc index is the trade-weighted currency performance (see the currency basket)On a three years interval, the Swiss Franc had a weak performance. The dollar index was far stronger. The dollar makes up 33% of the SNB portfolio and 25% of Swiss exports (incl. countries like China or Arab countries that use the dollar for exchanges). Contrary to popular believe, the CHF index gained only 1.73% in 2015. It lost 9.52% in 2014, when the dollar (and yuan) strongly improved.
|
Swiss Franc Currency Index, November 04, 2016(see more posts on Swiss Franc Index, )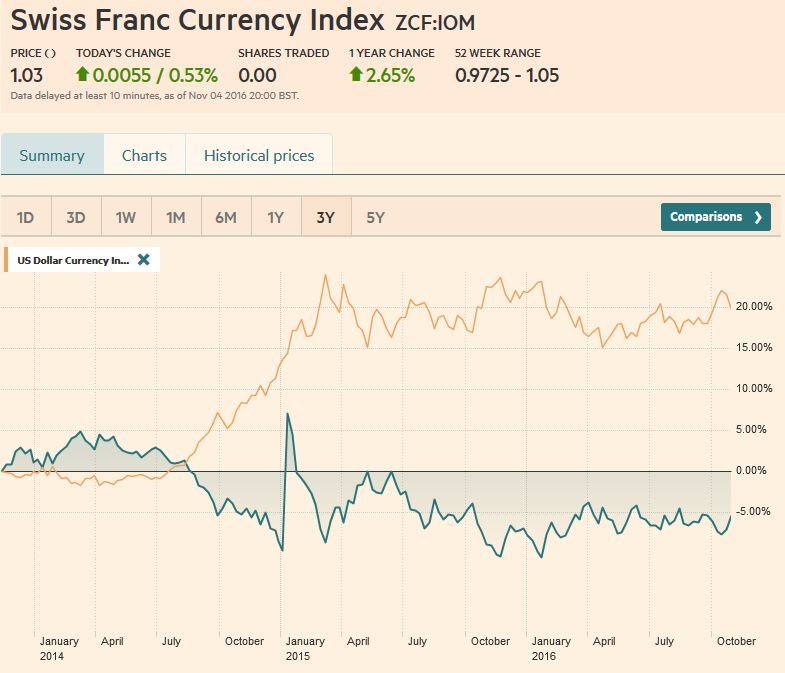 - Click to enlarge |
Marc Chandler My articles My offerMy siteAbout meMy videosMy books Follow on:LinkedINTwitterSeeking AlphaAmazon USD/CHFThe US dollar is at crossroads. It has retraced part of its recent rally that was ostensibly fueled by rising US interest rates and increased confidence of a rate hike in December. The dollar’s correction began prior to the latest turn in the presidential campaign, but it has been accelerated by the polls that show the race has tightened. Roughly speaking, the odds of a Trump presidency doubled over the past week to stand near 25% -35%.
What happens at the technical crossroads will be determined not by economic data but political developments. Our bullish outlook for the dollar is partly predicated on the continuation of the status quo broadly understood. A Trump victory could potentially unhinge investors to such an extent that it disrupts the markets profoundly and through that impact the Fed’s decision in December.
|
US Dollar - Swiss Franc FX Spot Rate, November 04, 2016(see more posts on USD/CHF, )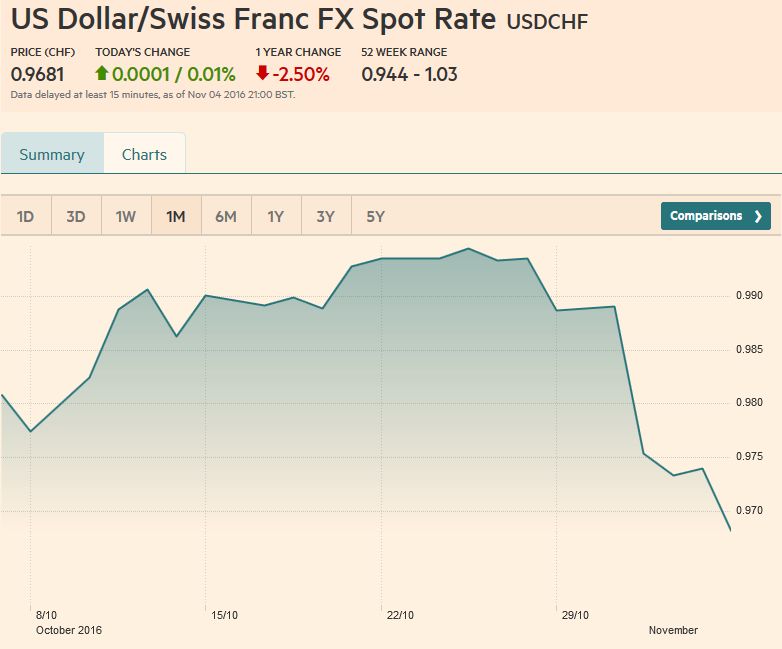 - Click to enlarge |
US Dollar IndexThe US Dollar Index fell about 1.2% last week after falling 0.35% the previous week, snapping a three-week 3.25% rally. At 97.10 it retraced 50% of the rally from late September. The 61.8% retracement is near 96.60, which corresponds to the 50-day moving average. If that 96.60 area is given, a move back to 95.00 cannot be ruled out. That said, the uptrend line that connects the June, August, and September lows intersects near 95.80 next Friday. |
US Dollar Currency Index Dollar Index, November 04(see more posts on Dollar Index, )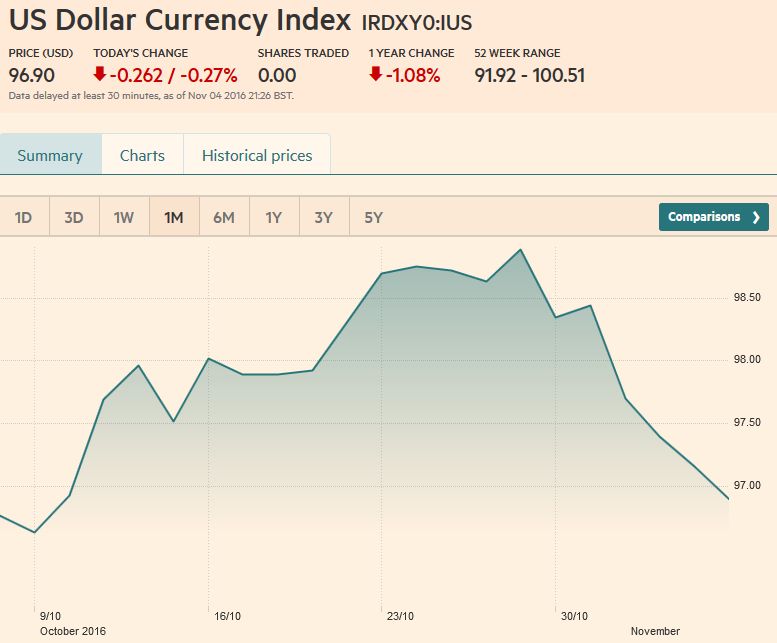 - Click to enlarge |
EUR/USDThe euro has bounced 2.75 cents since testing $1.0850 October 25. It has risen in the last four sessions and seven of the last nine. The technical indicators we look at do not rule out additional near-term gains. It has stalled in front of a band of resistance found between $1.1130 and $1.1150. Above there is the $1.12 congestion area that also corresponds to a downtrend line from the August and September highs. A break of $1.1040 is notable, but it may take a violation of the $1.0980-$1.1000 area to boost confidence that near-term high is in place. On a knee-jerk response to a Trump victory, we suspect the euro could initially rally into the $1.14-$1.5 area.
|
Euro/US Dollar FX Spot Rate, November 04, 2016(see more posts on EUR/USD, )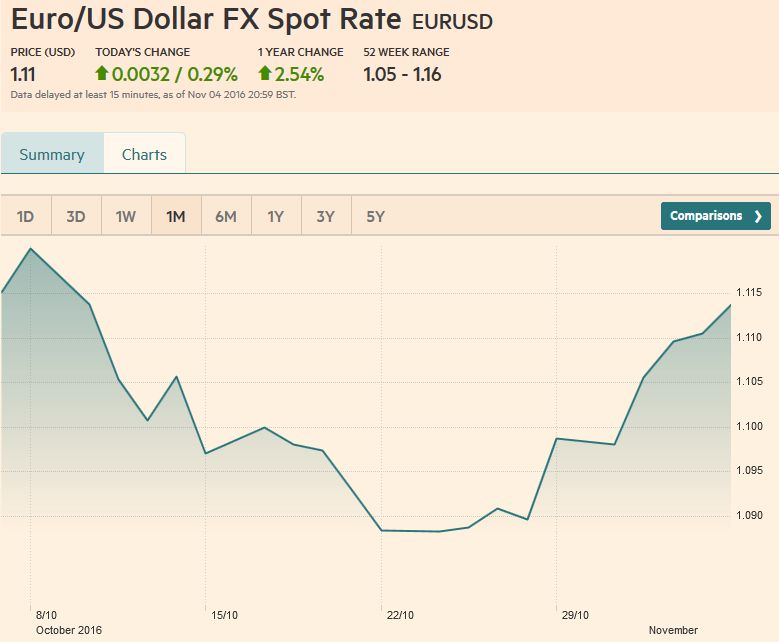 - Click to enlarge |
USD/JPYThe US dollar has fallen three yen against the Japanese currency since reaching a three-month high near JPY105.50 on October 28. The greenback’s retreat retraced more than 50% of its rally from the last September test on the JPY100. However, the dollar was unable to close below that retracement (~JPY102.80), which corresponds to the lower Bollinger Band and the 100- and 200-day moving averages. It stopped shy of the 61.8% retracement near JPY102.20.
The technical indicators are mixed, with the RSI curling up and the MACDs turning down from elevated levels. The Slow Stochastics show a bearish dollar divergence. A Trump victory could push the dollar below JPY100. The Brexit low was near JPY99.00. The JPY95 area is the 61.8% of the Abenomics rally. There is the longstanding objective of the head and shoulders pattern carved out last year on the weekly charts near JPY92.00.
|
US Dollar / Japanese Yen FX Spot Rate, November 04, 2016(see more posts on USD/JPY, )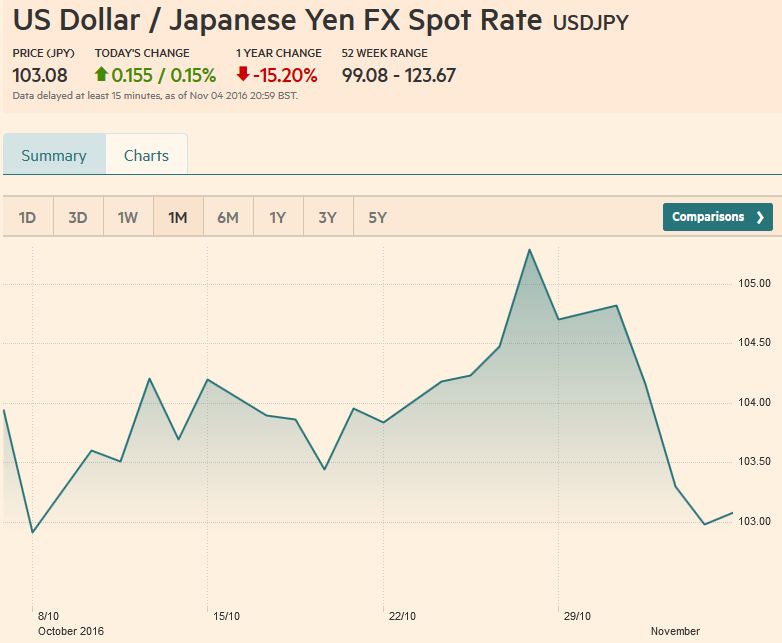 - Click to enlarge |
GBP/USDSterling’s 2.75% appreciation was the largest weekly advance since 2009. The main driver was not US politics, but the combination of the High Court ruling requiring Parliament vote on Brexit before Article 50 can be triggered and a shift in the Bank of England’s stance (now neutral) and upward revisions to its growth and inflation forecasts for 2017. Sterling’s technical tone has improved as it has strung together a six-day advancing streak, matching the longest rally of the year. Our next target is in the $1.2625-$1.2650 area. On a Trump victory, sterling could rally toward $1.2750-$1.2800, and possibly toward $1.30. Additional Comments
|
UK Pound Sterling / US Dollar FX Spot Rate, November 04, 2016(see more posts on British Pound, )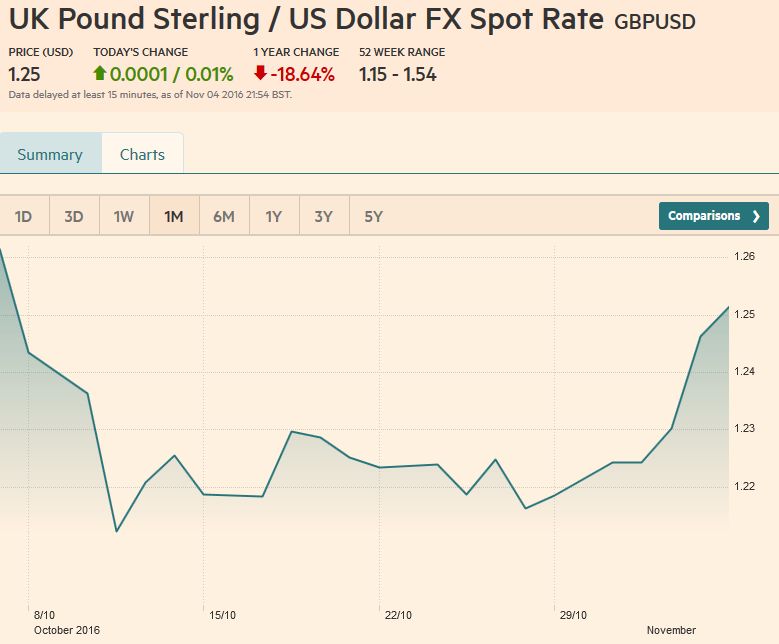 - Click to enlarge |
AUD/USDThe Australian dollar has been blocked near $0.7700 for the better part of the past four months. The central bank has signaled a shift toward a more neutral stance. A Trump victory would allow the Aussie to overcome this resistance and move toward $7800-$0.7850. Support is seen near $0.7600.
|
AUD/USD FX Rate Chart, November 04, 2016(see more posts on Australian Dollar, )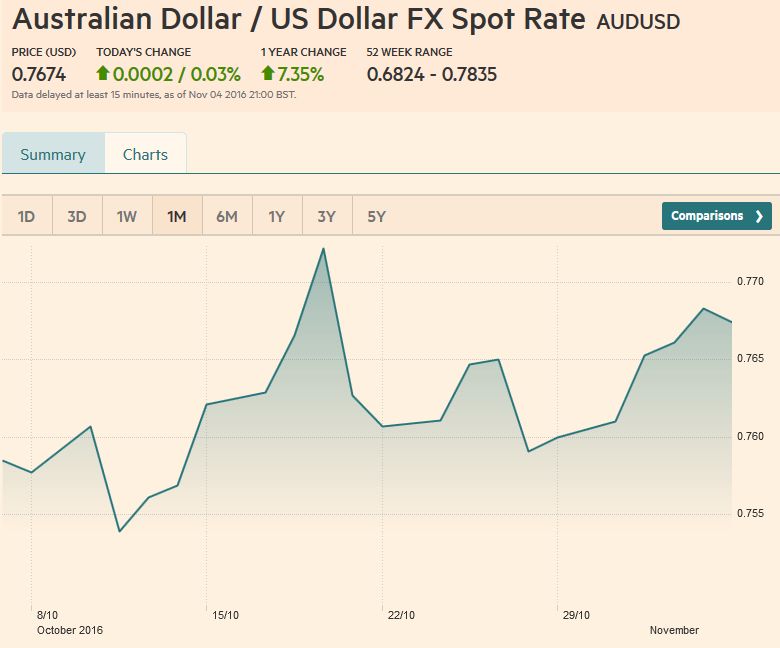 - Click to enlarge |
USD/CAD
The US dollar rose to its best level against the Canadian dollar since March before the weekend seemingly on the divergence in the economic data and the initial drop in oil prices below $44. There seems to be limited scope for additional near-term US dollar gains. The MACDs are about to turn, and the RSI did not confirm the new highs. The Slow Stochastics are set to rollover as well.
|
USD/CAD FX Rate Chart, November 04, 2016(see more posts on Canadian Dollar, )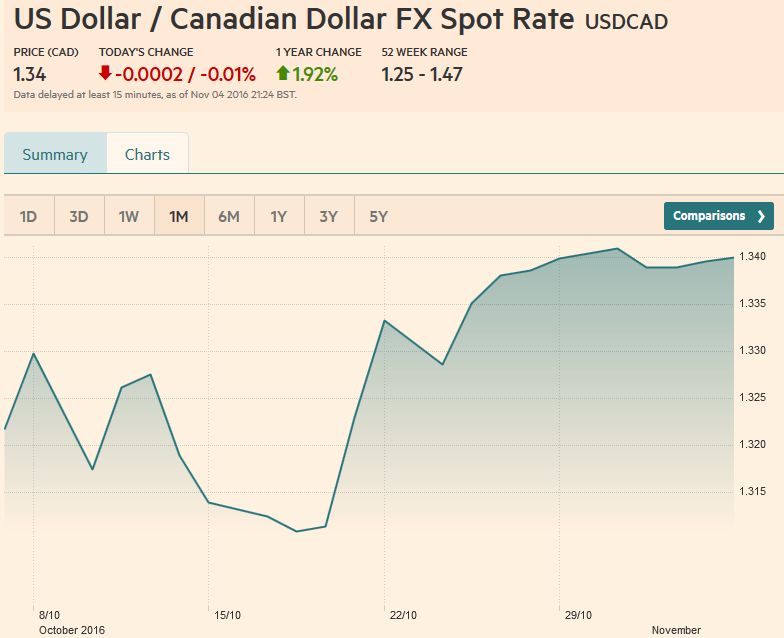 - Click to enlarge |
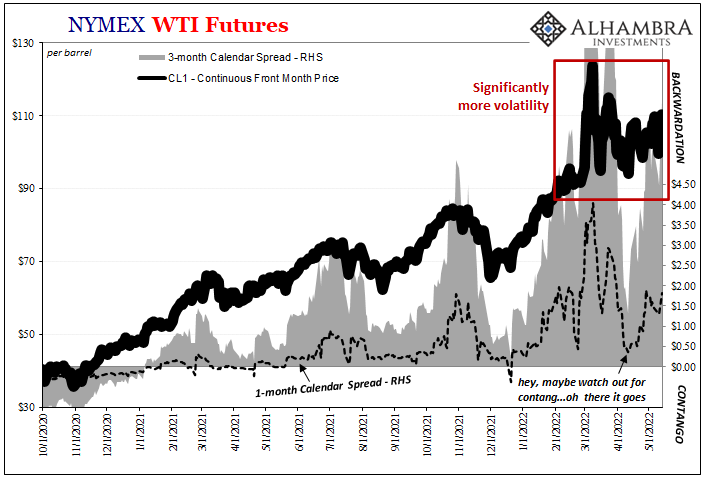
Crude OilOil was shellacked last week with more than 9% drop. The heavier dollar was insufficient to offset the poor technicals, record jump in US inventories, and increasing doubts about OPEC efforts to rein in supply. The December futures contract declined by the most since January. The two-week nearly 14% decline brought the price to almost $43.50, a nearly three-month low. There is little chart support between $43.30 and $42.00. There is scope for additional declines, but we are becoming more cautious after having anticipated the decline in mid-October when prices were still near $50 a barrel. The drop has pushed prices below the lower Bollinger Band ($44.55), and the Slow Stochastics warn of downside scope at this juncture.
|
Crude Oil, November 04(see more posts on Crude Oil, )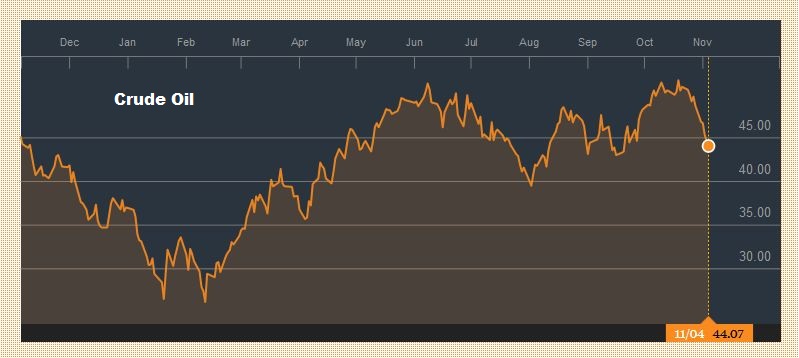 - Click to enlarge |
U.S. TreasuriesThe US 10-year yield fell below the 20-day moving average (1.78%) for the first time in a month. It peaked at the start of last week near 1.88%. There is some congestion in at slightly lower yield levels. A move below 1.70% would be seen as significant. The December note futures finished the week on its highs. Immediate resistance is seen in the 130-15 and then 130-24 to 131-00. A Trump victory would likely see a knee-jerk rally. Concern about a major disruption in the market to such an electoral outcome could also make participants considerably less confident of a December rate hike.
|
Yield US Treasuries 10 years, November 04(see more posts on U.S. Treasuries, )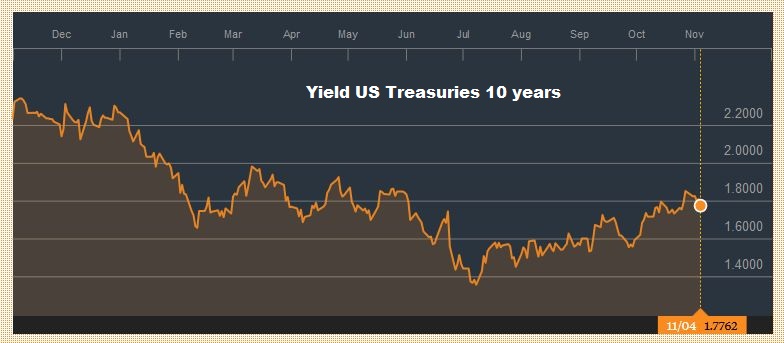 - Click to enlarge |
S&P 500 Index
|
S&P 500 Index, November 04(see more posts on S&P 500 Index, )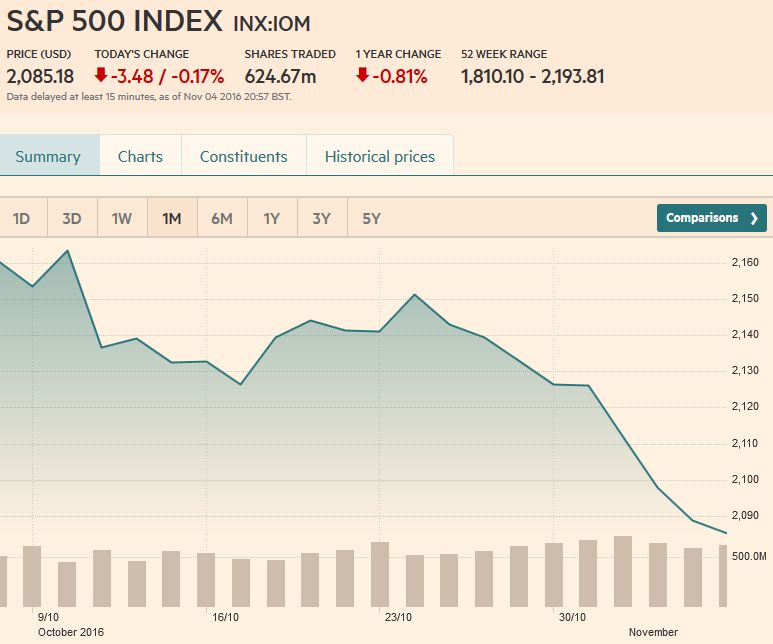 - Click to enlarge |
Are you the author?
Tags: Australian Dollar,British Pound,Canadian Dollar,Crude Oil,Dollar Index,EUR/CHF,EUR/USD,Euro,Japanese yen,MACDs Moving Average,newslettersent,S&P 500 Index,Swiss Franc Index,U.S. Treasuries,usd-jpy,USD/CHF,USD/JPY