


George Dorgan
My articles My siteAbout meMy videosMy books
Follow on:LinkedINTwitterSeeking Alpha
CFA SocietyEconomicBlogs
Swiss Franc Currency IndexAt least against the Swiss Franc index, the dollar index could further advance last week. We had observed SNB interventions in the previous week that kept the euro mostly above 1.07. Investors were hedging against the Trump reflation trade and potential inflation that comes with it.
|
Trade-weighted index Swiss Franc, November 25(see more posts on Swiss Franc Index, )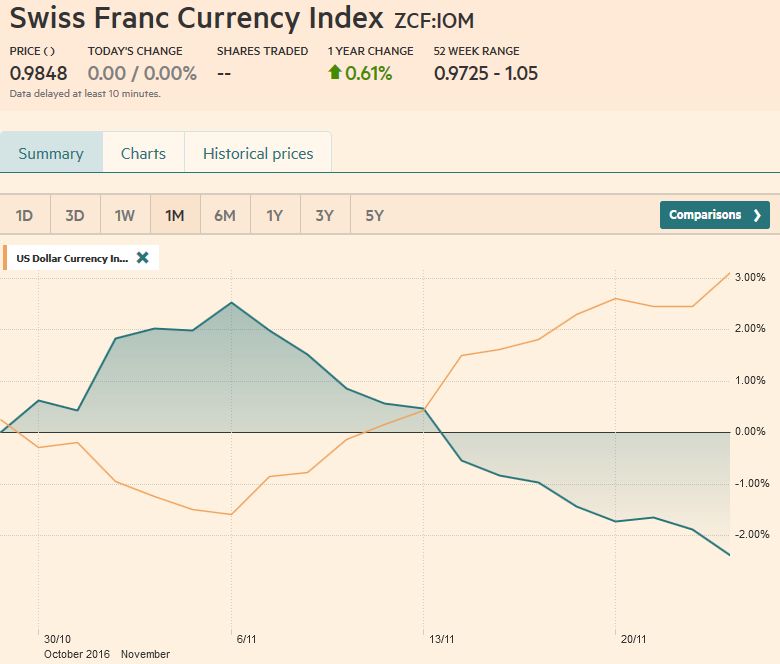 . Source: FT.com - Click to enlarge |
Swiss Franc Currency Index (3 years)The Swiss Franc index is the trade-weighted currency performance (see the currency basket)On a three years interval, the Swiss Franc had a weak performance. The dollar index was far stronger. The dollar makes up 33% of the SNB portfolio and 25% of Swiss exports (incl. countries like China or Arab countries that use the dollar for exchanges). Contrary to popular believe, the CHF index gained only 1.73% in 2015. It lost 9.52% in 2014, when the dollar (and yuan) strongly improved. |
Swiss Franc Currency Index, November 25(see more posts on Swiss Franc Index, )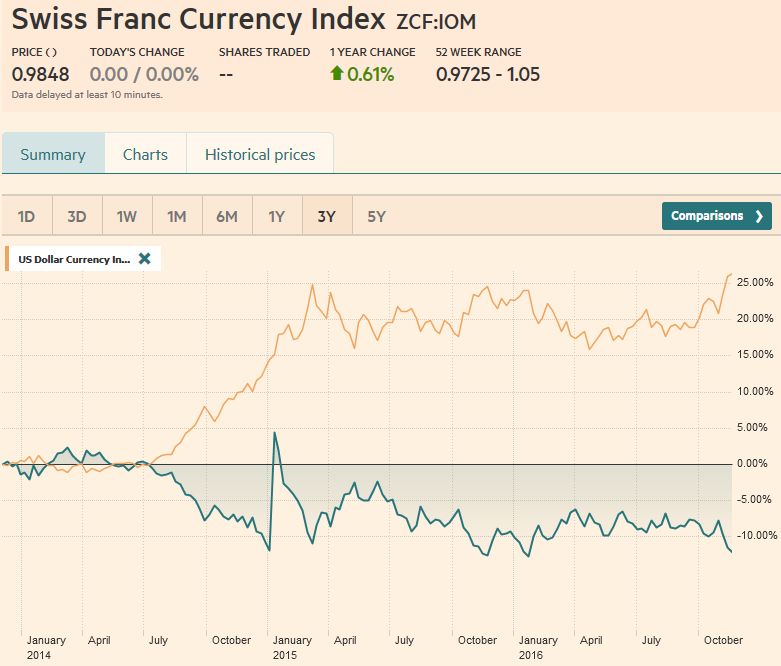 . Source: FT.com - Click to enlarge |
Marc Chandler My articles My offerMy siteAbout meMy videosMy books Follow on:LinkedINTwitterSeeking AlphaAmazon USD/CHFAfter a three-week rally, the dollar bulls finally showed signs of
tiring ahead of the weekend. Technical indicators have begun rolling over from over-extended conditions. Nevertheless, the dollar’s pullback is limited in time to the first part of the week ahead, and in scope to only modest retracement targets ahead of the US employment data, the Italian referendum, and the Austrian presidential election on December 4. We have suggested that the dollar’s advance was fueled by the divergence that had little to do with the US election. It is clear from Fed comments and the minutes from the November FOMC meeting that officials were prepared to hike rates regardless of the election outcome. Moreover, subsequent data has been mostly better than expected.
Trump’s promise of significant fiscal stimulus with the world’s largest economy already grown near or above trend, the inflationary implications are clear. Nominal rate differentials have widened significantly in US favor. We are cautious are extrapolating too much from the inflation-linked securities as the liquidity premium tends to exaggerate the movement.
Also, Fed funds futures strip has not fully priced in two hikes next year, suggesting potential room further adjustment.
|
US Dollar-Swiss Franc FX Spot Rate, November 25(see more posts on USD/CHF, )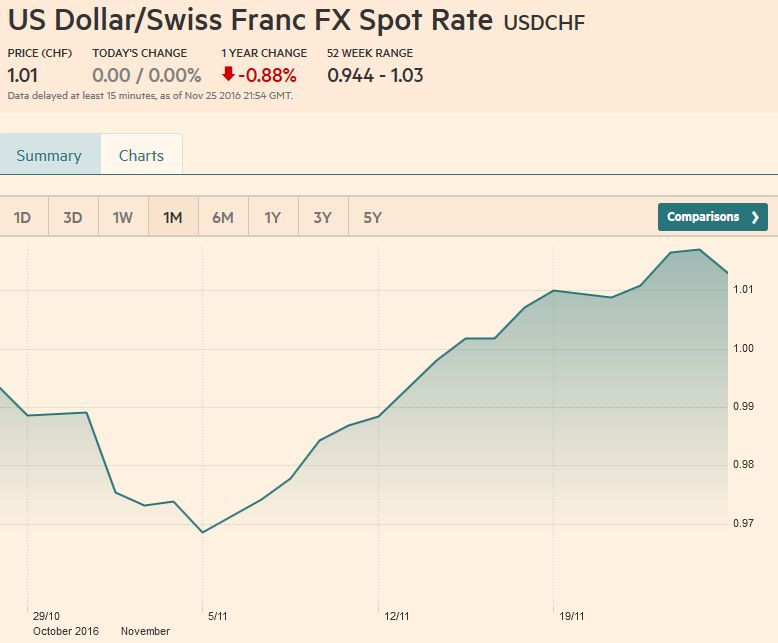 . Source: FT.com - Click to enlarge |
US Dollar IndexSince November 4, a few days before the US election, the Dollar Index rose about 5.35% at last week’s peak just above 102.00. The RSI has rolled over, as has the Slow Stochastics. The MACDs may turn next week. Initial support is seen in the 101.00-101.20 and then 100.65.
|
US Dollar Currency Index, November 25(see more posts on Dollar Index, )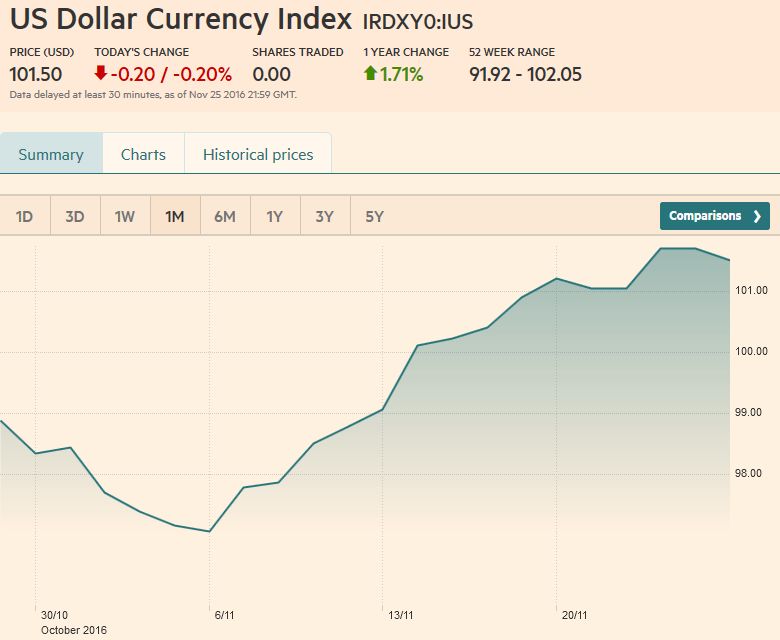 . Source: FT.com - Click to enlarge |
EUR/USDThe euro put in a low a little below $1.0520 while Americans were celebrating Thanksgiving. Like the Dollar Index, the RSI and Slow Stochastics have turned, but MACDs, as often the case, are lagging.
Nearby resistance is seen in the $1.0650-$1.0660 area. Above there, and the euro can test the $1.0725 area.
To the extent the widening of the U.S. premium is a critical driver for the dollar, we note that both the two-year and 10-year premiums continued to widen ahead of the weekend, despite the greenback’s pullback.
The US two-year advantage reached 1.90% bp at the end of last wee the most in 16 years. It finished at 1.86%, a 13 bp
gain on the week. The US 10-year advantage widened eight basis points to 3.10% before the weekend. It has been as much as 3.20%, which is the largest since 1992. |
Euro/US Dollar FX Spot Rate, November 25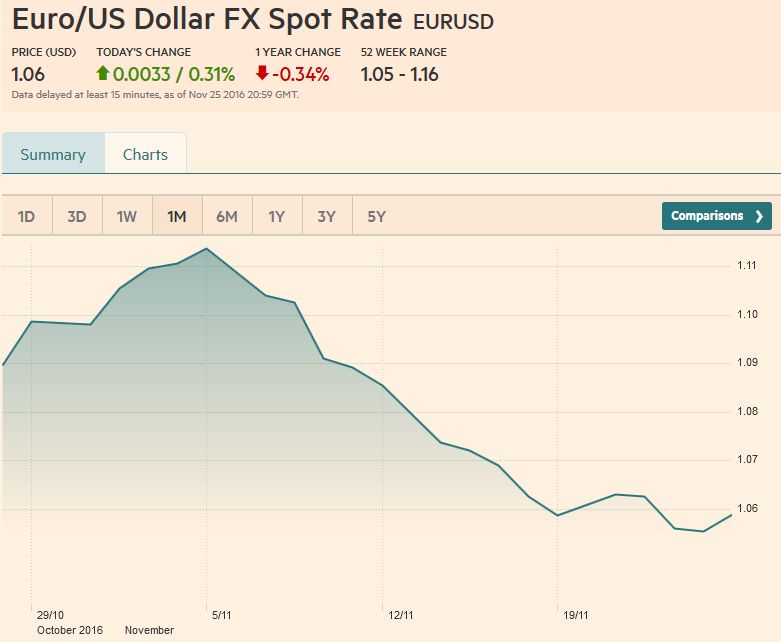 . Source: FT.com - Click to enlarge |
USD/JPYSince November 4, the dollar has risen 11% against the A break could see another yen decline that pushes the greenback In the bigger picture, it looks the drop in the dollar from last year’s high (almost JPY126) to this year’s low (circa JPY99) was corrective in nature, meeting a little more than the 50% retracement target of the Abenomics induced rally. This suggests further dollar gains against the yen lie ahead over the medium-term. Near-term, the JPY114.35-JPY114.65 may offer some resistance on the way to JPY115.00-JPY115.60. |
US Dollar / Japanese Yen FX Spot Rate, November 25(see more posts on USD/JPY, )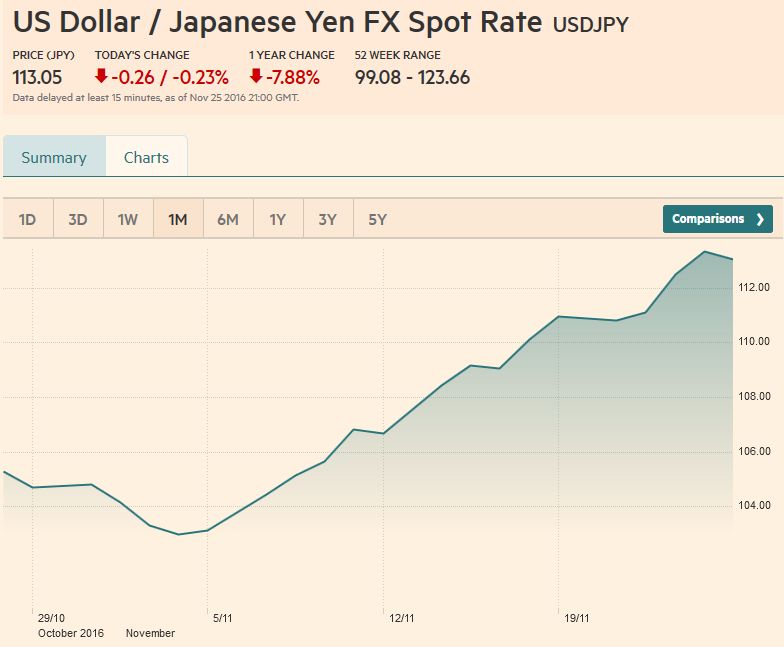 . |
GBP/USDSterling is a horse of a different color. Since the flash crash on October 6, sterling has been in two ranges. The first was between $1.21 and $1.23. It largely confined prices until early November. Most of this month, it has been in $1.23 to $1.25 range for the most The technical indicators are not generating strong signals, but the We note that the US two-year premium over the UK widened by 17 bp last week to 1.03%, which is the largest divergence since at least 1992. The US 10-year premium widened to 96 bp last week. It finished last month near 58 bp. The US premium is approaching the late-August extreme near 1.06%, which was the widest since 2000. |
UK Pound Sterling / US Dollar FX Spot Rate, November 25(see more posts on British Pound, )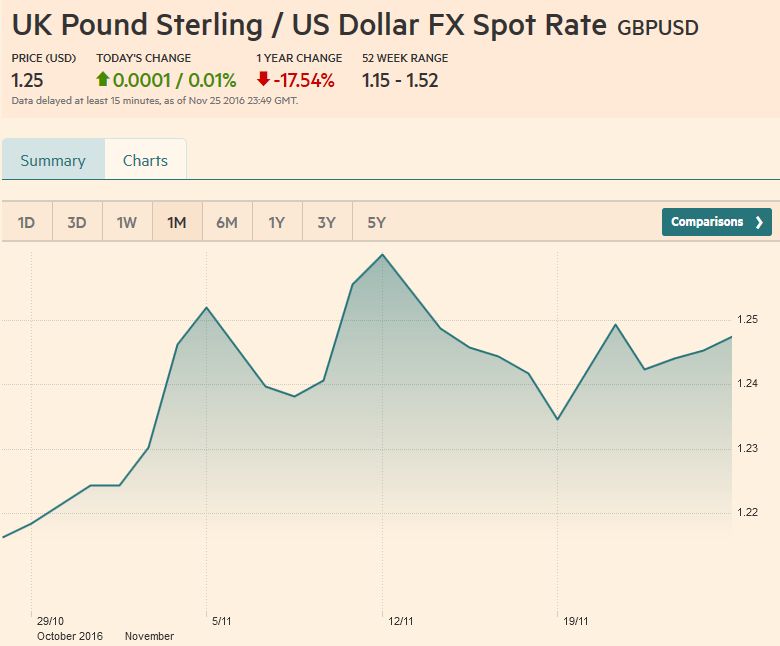 . Source: FT.com - Click to enlarge |
AUD/USDThe Australian dollar was the strongest of the major currencies last week, gaining nearly 1.4% against the US dollar. The Aussie had bottomed at the start of the week in front of $0.7300 after toying with the ceiling above $0.7700 as recently as November 10. If Aussie’s A move back below $.0.7380 would like signal a top is in place. It ran |
Australian Dollar / US Dollar FX Rate Chart, November 25(see more posts on Australian Dollar, )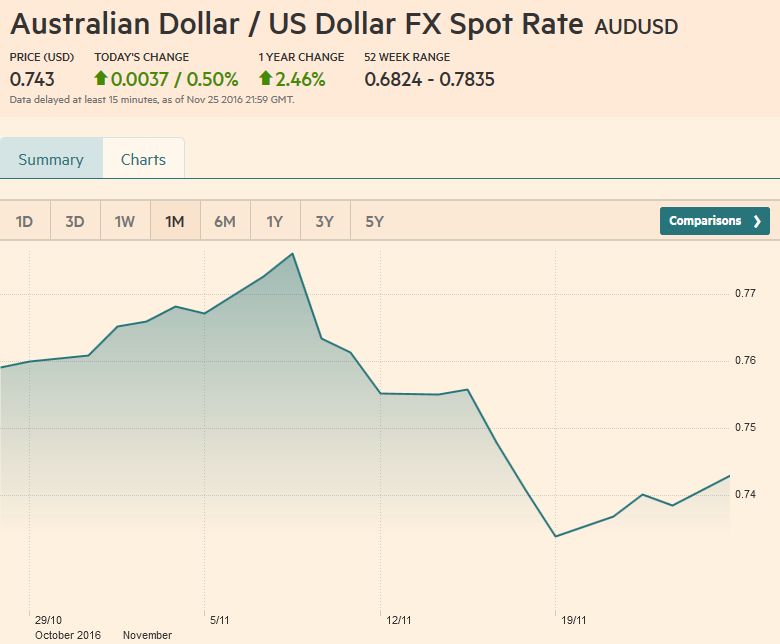 . Source: FT.com - Click to enlarge |
USD/CADSince reaching almost CAD1.36 on November 14, the US dollar has been consolidating its gains against the Canadian unit. Here too we note that the US interest rate premium continued to widen even though the greenback failed to extend its recent gains against the Loonie. Both the two and 10-year premiums are moving back toward the extremes set at the start of the year. The sharp drop in oil prices ahead of the weekend weigh on Canada, and helped lift the greenback to test a short-term down trend line drawn off the November 14 and November 18 highs. It came in near CAD1.3540 ahead of the weekend and caught the high It caught the high, which was recorded late in the session. We note that the CAD1.3575 area represents a 50% retracement of the US dollar’s slide since the multi-year high was set in January. That slide looks corrective in nature, but in any event, the next major upside target is near CAD1.3840.
|
US Dollar / Canadian Dollar FX Rate Chart, November 25(see more posts on Canadian Dollar, )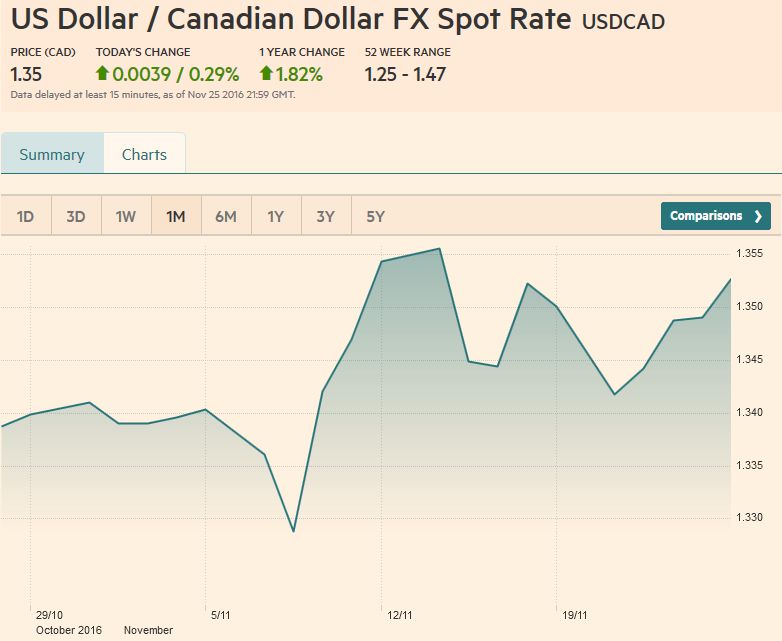 . Source: FT.com - Click to enlarge |
Crude OilThe January light sweet crude oil futures contract’s 14% rally since November 14 appears ton have run out of steam. Optimism about the ability of OPEC and non-OPEC countries faded in recent sessions. The people playing up the likelihood of an agreement came from parties that might not participate in output cuts like Iran and Russia (reports suggested Iraq could participate). Then before the weekend, Saudi Arabia |
Crude Oil, November 25(see more posts on Crude Oil, )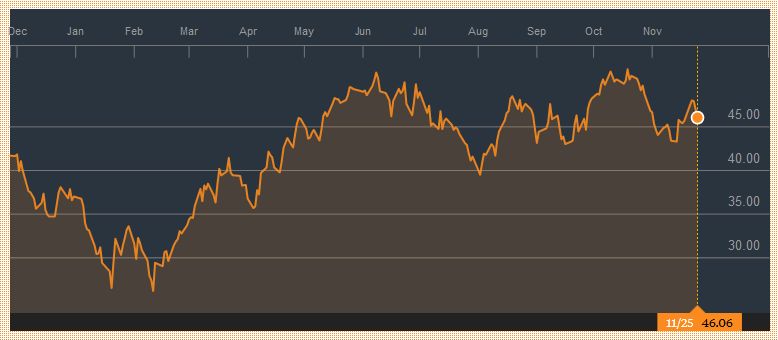 . Source: Bloomberg.com - Click to enlarge |
U.S. TreasuriesThe 10-year US note yield poked briefly through 2.40% and pullback back toward 2.36% ahead of the weekend Congestion is seen a little below 2.30%. The December futures contract made a new low ahead of the weekend before reversing higher, leaving a potential bullish hammer in its wake. The 126-00 area offers initial resistance. However, the technical indicators still point to weakness ahead. Broad sideways consolidation over the next few sessions may resolve the situation. |
Yield US Treasuries 10 years, November 25(see more posts on U.S. Treasuries, ) . Source: Bloomberg.com - Click to enlarge |
S&P 500 IndexThe equity bull market continued with the Dow Jones Industrials, NASDAQ and S&P 500 reaching new record highs before the weekend. Indeed, after the Thanksgiving holiday, the S&P 500
gapped higher and closed on new record highs. The gap is found between 2204.72 and 2206.27. While the technical indicators are getting stretched, they do not appear to preclude additional gains. Resistance is of little meaning with the index at record highs. The gap may offer initial support, but better support is seen near 2190. |
S&P 500 Index, November 25(see more posts on S&P 500 Index, )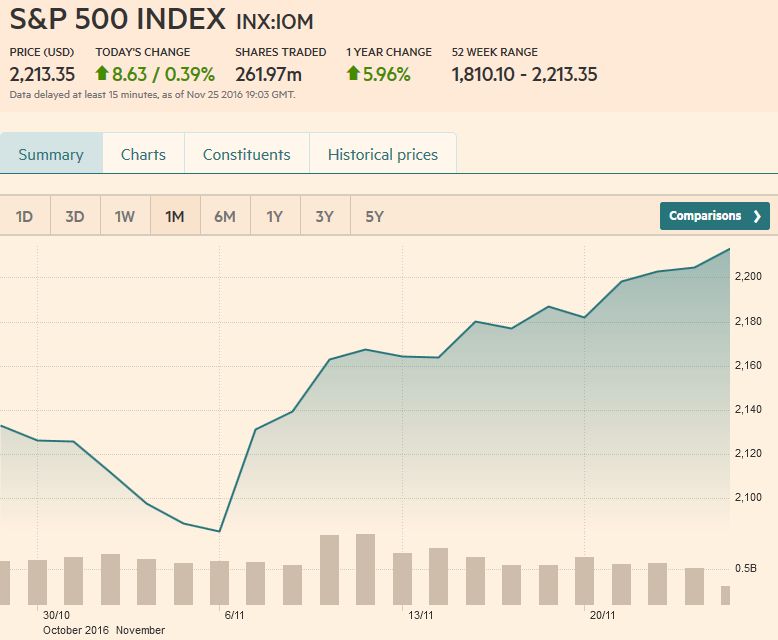 . Source: FT.com - Click to enlarge |
Are you the author?
Tags: Australian Dollar,British Pound,Canadian Dollar,Crude Oil,Dollar Index,EUR/CHF,Euro,Euro Dollar,Japanese yen,MACDs Moving Average,newslettersent,S&P 500 Index,Swiss Franc Index,U.S. Treasuries,usd-jpy,USD/CHF,USD/JPY


