George Dorgan
My articles My siteAbout meMy videosMy books
Follow on:LinkedINTwitterSeeking Alpha
CFA SocietyEconomicBlogs
Swiss Franc Currency IndexThe weeks after Trump’s election continue to see a weakening of the Swiss Franc, while the dollar index is on a steady rise. Still both the euro and the yen have seen worse performance than the Swiss Franc. The euro is currently under 1.07 CHF. |
Trade-weighted index Swiss Franc, November 18(see more posts on Swiss Franc Index, ) Source: FT.com - Click to enlarge |
Swiss Franc Currency Index (3 years)The Swiss Franc index is the trade-weighted currency performance (see the currency basket)On a three years interval, the Swiss Franc had a weak performance. The dollar index was far stronger. The dollar makes up 33% of the SNB portfolio and 25% of Swiss exports (incl. countries like China or Arab countries that use the dollar for exchanges). Contrary to popular believe, the CHF index gained only 1.73% in 2015. It lost 9.52% in 2014, when the dollar (and yuan) strongly improved. |
Swiss Franc Currency Index, November 18(see more posts on Swiss Franc Index, )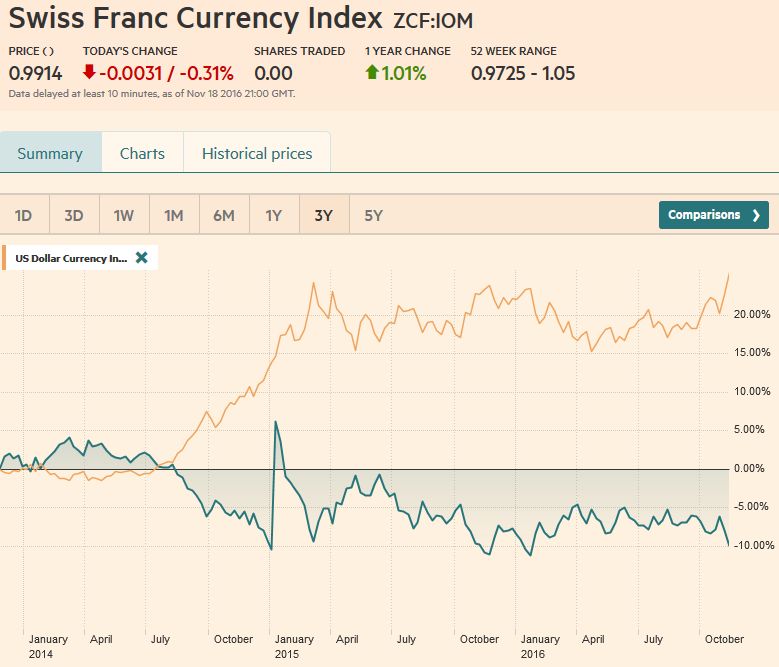 Source: FT.com - Click to enlarge |
Marc Chandler My articles My offerMy siteAbout meMy videosMy books Follow on:LinkedINTwitterSeeking AlphaAmazon USD/CHFThe US dollar has recorded its best two-week performance since Reagan was President. There has been a sea change.
Although the low in global yields took place before the US election, and deflation forces looked to have been largely defeated (with a few exceptions, including Japan), more market participants recognize the likelihood that the three-decade decline in bond yields may be over.
At the very least, the promise of fiscal stimulus for a U.S. economy that is already growing near-trend, while core PCE deflator and wage growth gradually increasing, may be confirming the biggest change in the investment climate since the financial crisis.
The dramatic adjustment seen in interest rate markets and the dollar reflects the repricing of assets under a new paradigm. Of course, two weeks after the election, details do not exist yet, and the Republican President-elect has bolder ideas that part of the Republican Party that may lead the legislative branch. However, the direction is clear.
|
US Dollar-Swiss Franc FX Spot Rate, November 18(see more posts on USD/CHF, )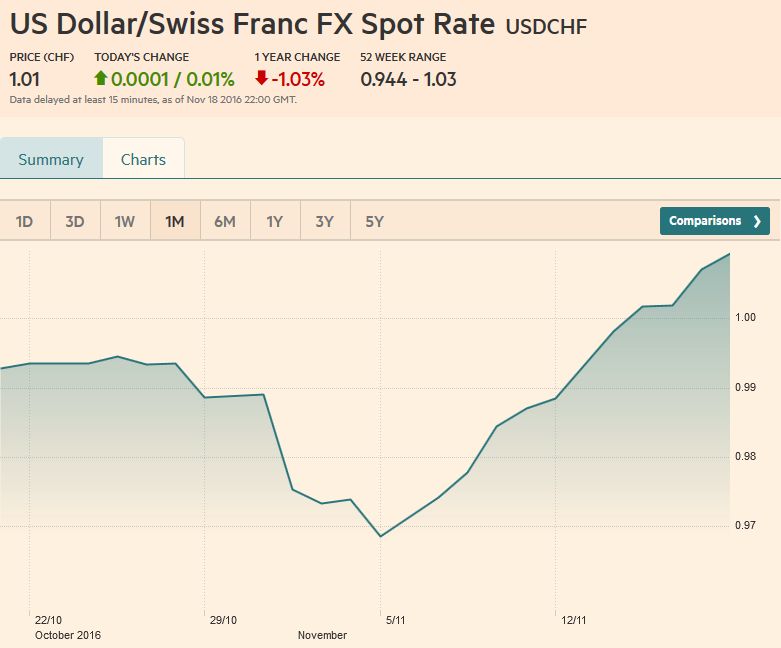 Source: FT.com - Click to enlarge |
US Dollar IndexThe US Dollar Index has risen for ten consecutive sessions. In this two-week period, it has gained about 4.25% to reach its best level since 2003. It has only fallen in two of the first seven weeks here in Q4. On October 20, when the 50-day moving average moved above the 200 day moving average (Golden Cross), Dollar Index closed near 98.30. It pushed a little past 101.30 last week. The technicals are stretched. The RSI is at its highest in more than 18 months, but there no bearish divergences. The price action gives no reason to think that this surge in dollar demand has been satiated. In the last seven sessions, the Dollar Index recorded higher highs and higher lows. The next important chart point is seen near 101.80. That is the 61.8% retracement of the Dollar Index’s decline from what I have dubbed the Clinton Dollar Rally of the second half of the 1990s, ending with G7 intervention to arrest the euro’s slide. A convincing break of that area will make my longer-term call of a move to that Clinton Dollar Rally high (~121) look less extreme.
|
US Dollar Currency Index, November 18(see more posts on Dollar Index, )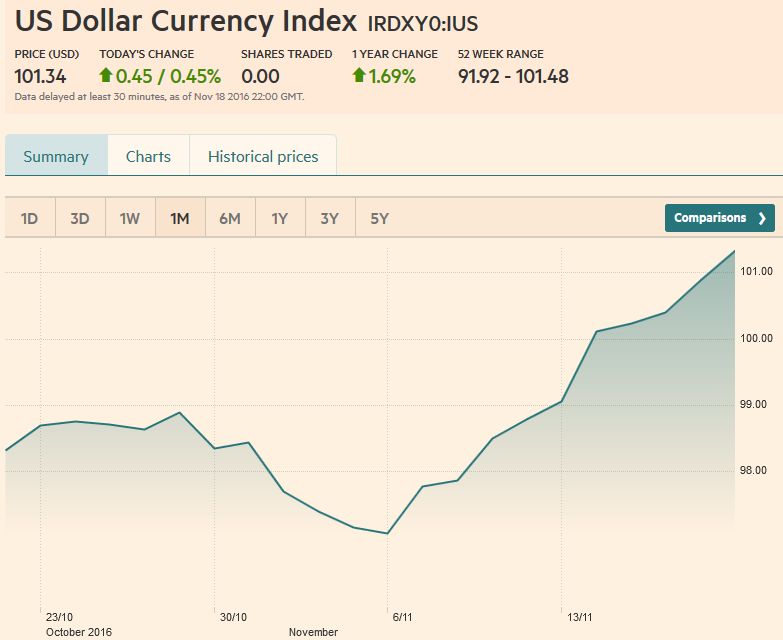 Source: FT.com - Click to enlarge |
EUR/USDEven after being down nine consecutive sessions, the euro still could not sustain the smallest of upticks, and so its streak was extended ahead of the weekend.
It is not the US side of the equation. Europe is looking more and more out of step. The US, Japan, Canada, and the UK (expected to be signaled by UK Chancellor of the Exchequer in the Autumn Statement in the week ahead) are or will adopt the more stimulative fiscal policy. The EC continues to insist on austerity, and Germany is not inclined to use the fiscal space that the IMF and ECB claim to exist.
Just as importantly, if not more so, the populist-right appeal that has arguably been expressed in the UK and the US heads toward Europe.
Europe is more vulnerable to a rise in nationalism and anti-integration sentiment. Italy’s referendum and Austria’s presidential election are the first. The most likely scenario following the probable defeat of the referendum is another caretaker government whose mandate to resolve the conflicting electoral law and prepare for 2018 election.
Austrian’s presidency is mostly ceremonial office, but the victory of the populist right candidate would be seen as another sign of the power of that tendency.
The euro’s 50-day moving average fell below the 200-day moving average on October 24 when it finished the North American session a little above $1.0880. To reach that level required the euro to violate the uptrend drawn off the January, June and July lows. The 2015 low was in the $1.0460 area in the spring and $1.0525 at the end of the year. These represent the next near-term targets. Given the speed and duration of the euro’s slide, some technical bounce would not be surprising.
We note that the euro has not closed above its five-day average since 4 November. It comes in now near $1.0675. An intraday move, or close above there would be a preliminary indication of the end of the strong downside momentum.
|
Euro/US Dollar FX Spot Rate, November 18(see more posts on EUR/USD, )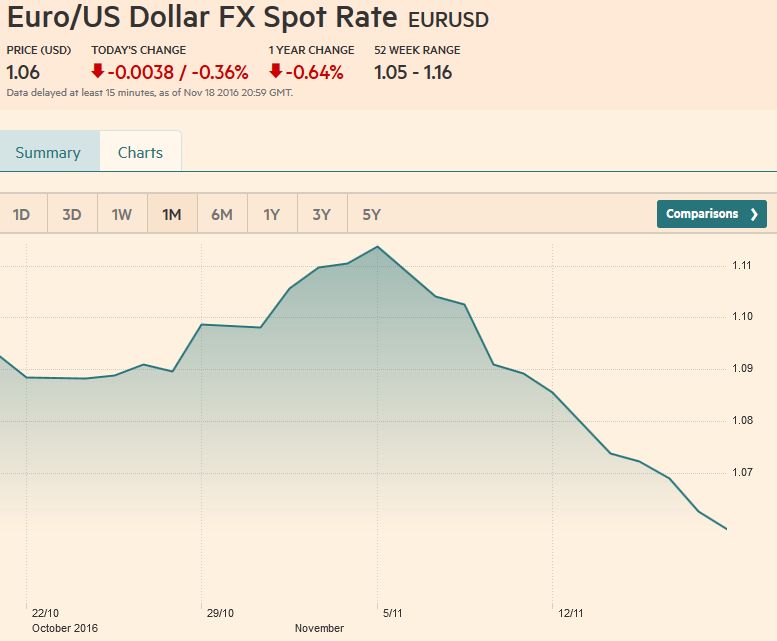 Source: FX.com - Click to enlarge |
USD/JPYThe dollar has risen 7% against the yen over the past two weeks. It is rose neared JPY111 for the first time in six months. Like the dollar’s gains against the euro, the rise in the dollar vs. the yen fueled by the sharp higher US interest rates, the greater US premiums, and the general reflation meme.
At JPY110.35 the dollar recouped half of this year’s losses. The 50% retracement from the dollar’s peak from mid-2015 near JPY125.85 is a little below JPY112.50. The technical readings are stretched. The MACDs and Slow Stochastics appear to be peaking, while the RSI is at its highest level since the middle of 2015. The dollar has been climbing the five-day average. It is now near JPY109.45. Its violation would warn that the leg up is over.
|
US Dollar / Japanese Yen FX Spot Rate, November 18(see more posts on USD/JPY, ) Source: FT.com - Click to enlarge |
GBP/USDSterling snapped a two-week advance against the US dollar. It lost a little more than 2% against the dollar last week. It held up a little better than the euro (~ -2.4%). This also underscored the sense of it being a dollar move.
The US premium over the UK on two-year money (~86 bp) appears to be the largest in the quarter of a century that Bloomberg has data. Sterling finished last week below its 20-day moving average (~$1.2365) for the first time since November 1. It is poised to test the congestion band seen between $1.2160 and $1.2260.
Sterling may be more interesting against the euro than against the dollar.
|
UK Pound Sterling / US Dollar FX Spot Rate, November 18(see more posts on British Pound, )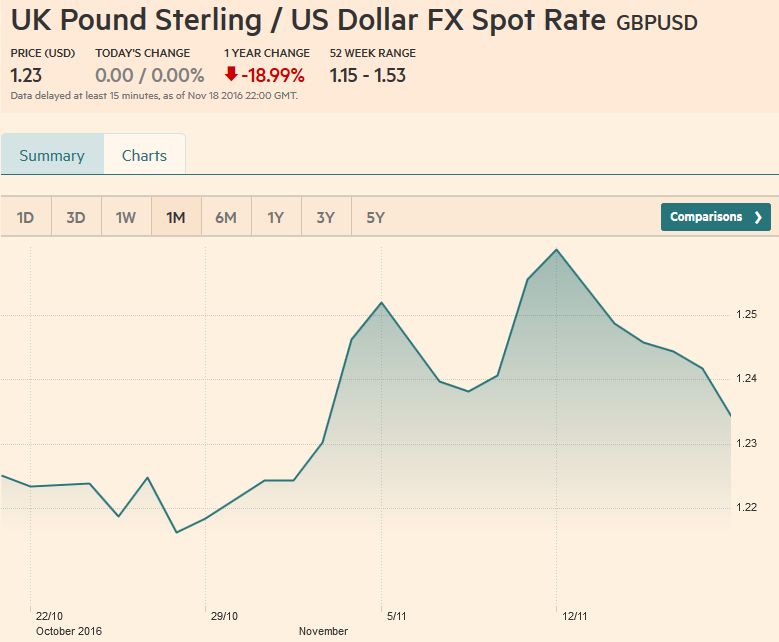 Source: FT.com - Click to enlarge |
AUD/USDAfter the Japanese yen, the Australian dollar has fallen the most of the major currencies since the US election. It has lost a touch more than 5%, while the yen has depreciated by 5.7%. In the second half of last week (three sessions), the Aussie dropped nearly 3% (2.9%). Softer metal prices provided a ready excuse, but the new higher interest rate environment steals some of the thunder of the traditional high yielders, like the Australian dollar.
Like the yen, but unlike the euro and sterling, speculators in the futures market were leaning the wrong way. They had net long Australian dollar futures positions.
Before the weekend, the Australian dollar met, almost to the tick, the 50% retracement objective of this year’s gain. The next retracement objective is near $0.7200. However, the near-term yellow flag is that the Aussie closed below the lower Bollinger Band (~$0.7400) for three consecutive sessions. While a corrective bounce may lift the Aussie back toward the Bollinger Band, the Bollinger Band itself may drift lower toward prices.
|
Australian Dollar / US Dollar FX Rate Chart, November 18(see more posts on Australian Dollar, )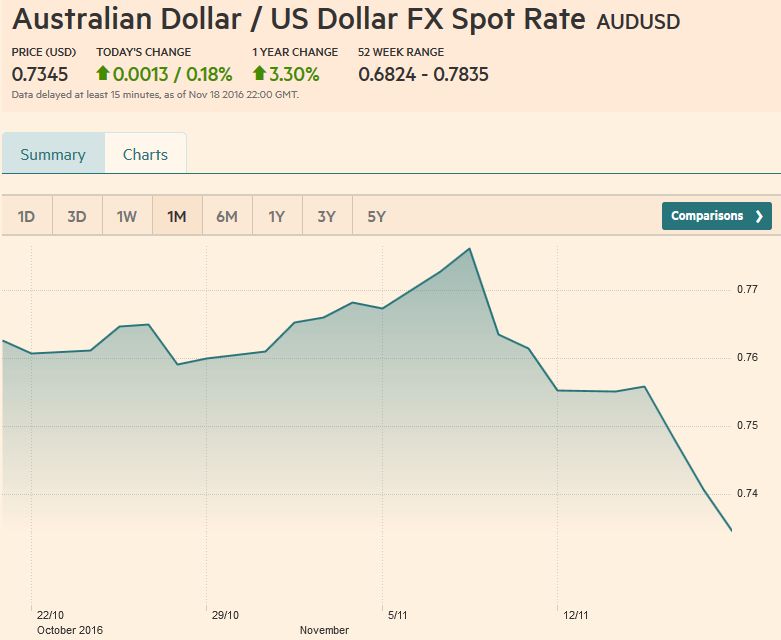 Source: FT.com - Click to enlarge |
USD/CADThe Canadian dollar was the only major currency to gain against the US dollar last week (~0.3%). The Toronto stock exchange was the second-best performing major stock market last week (~2%) behind Japanese shares (Topix +3.6%).
Oil prices snapped a three-week decline. But, it is not unusual for the Canadian dollar to outperform European currencies and the yen in a strong US dollar environment.
What is impressive of the even the minor Canadian dollar gains is that it come as US two-year interest rate premiums over Canada rose to its highest level in 10-months. At 38 bp it has risen 12 bp over the past two weeks. The greenback’s highs were made at the start of last week (~CAD1.3590) and the attempted retest before the weekend was rebuffed, after a seemingly bullish outside advancing session was recorded the previous day.
The CAD1.3575 area houses the upper Bollinger Band and the 50% retracement of the US dollar’s decline from the late-January high, a little below CAD1.37 to May low near CAD1.2460. To be anything significant from a technical perspective, the US dollar pullback needs to extend through CAD1.3400.
A move above $47 would be constructive and set up another test on the $50 threshold.
|
US Dollar / Canadian Dollar FX Rate Chart, November 18(see more posts on Canadian Dollar, )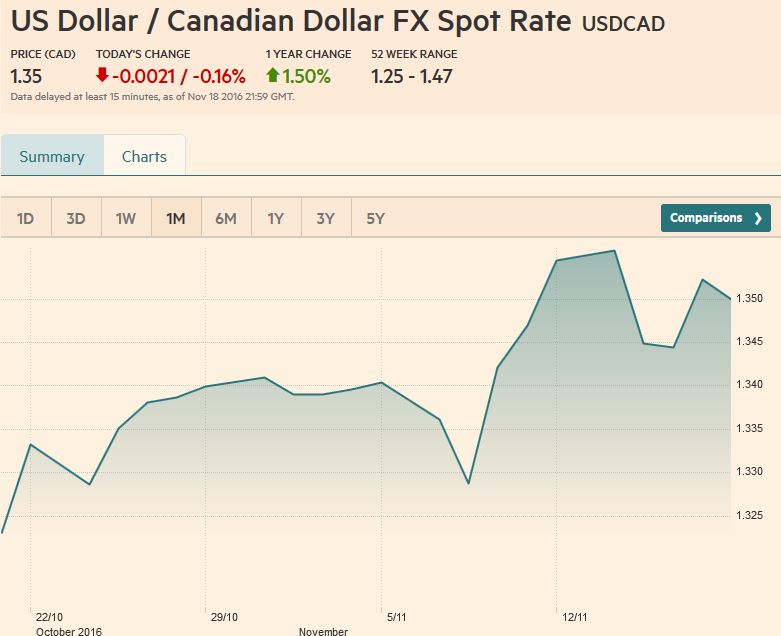 Source: FT.com - Click to enlarge |
Crude OilThe price of the January 2017 light sweet crude oil futures has risen only in one of the last seven sessions.
It was a roughly 5.6% gain Tuesday on ideas that maybe Russia will participate in OPEC’s attempt to reduce supply. It more than offset the string of losses and was sufficient to snap a three-week air pocket, as the market grew suspicious of a meaningful accord. The point is that the downside momentum has eased and the technical tone has improved.
|
Crude Oil, November 18(see more posts on Crude Oil, )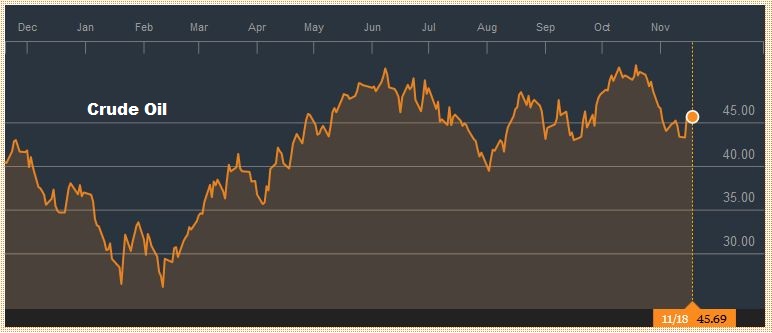 Source: Bloomberg.com - Click to enlarge |
U.S. TreasuriesUS 10-year Treasury yields continued their upward climb tacking on another 23 bp on top of the previous week’s 38 bp rises. New highs in the 10-year yield were seen ahead of the weekend at 2.35%. The next obvious technical target is last year’s high near 2.50%. In the big picture, yields have been falling for 30 years. The 10-year fell to almost 1.30% this year, essentially test the cyclical low seen in 2012. This may mark the historic low, and such low yields will look as quaint as the double yielding Treasuries, the last of which recently matured. We suspect that the two-year yield, which has risen 25 bp since the election to 1.05%, is going find the 1.10%-1.20% area provides a formidable cap.
|
Yield US Treasuries 10 years, November 18(see more posts on U.S. Treasuries, )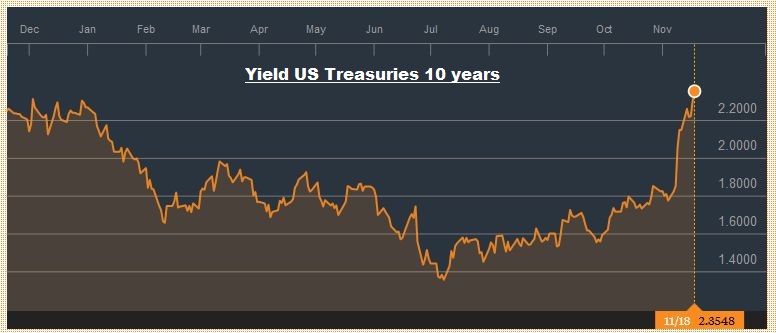 Source: Bloomberg.com - Click to enlarge |
S&P 500 Index
|
S&P 500 Index, November 18(see more posts on S&P 500 Index, )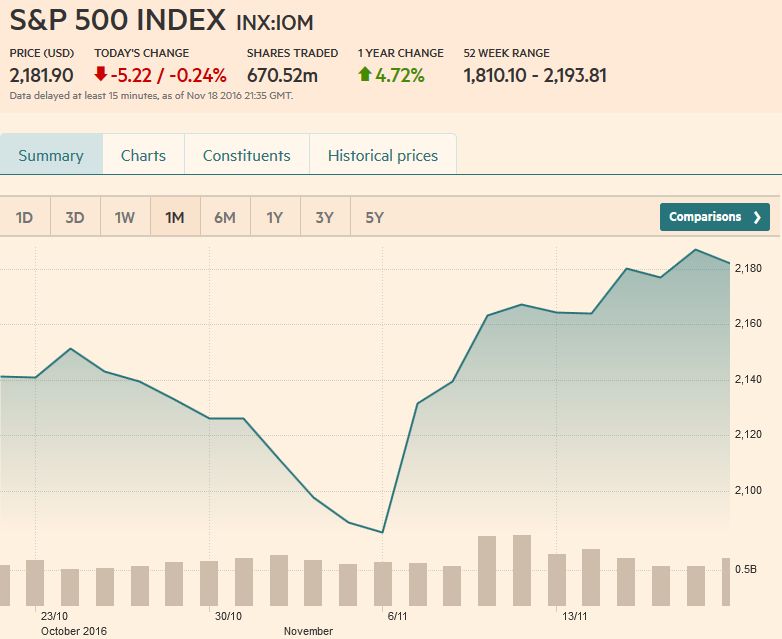 Source: FT.com - Click to enlarge |
Are you the author?
Tags: Australian Dollar,British Pound,Canadian Dollar,Crude Oil,Dollar Index,EUR/CHF,EUR/USD,Euro,Euro Dollar,Japanese yen,MACDs Moving Average,newslettersent,S&P 500 Index,Swiss Franc Index,U.S. Treasuries,usd-jpy,USD/CHF,USD/JPY