


George Dorgan
My articles My siteAbout meMy videosMy books
Follow on:LinkedINTwitterSeeking Alpha
CFA SocietyEconomicBlogs
This week we focus on the charts, we omit the technical explanations, given that Marc Chandler is currently on a two-weeks trip. The dollar was surprisingly strong this week. This despite a more hawkish ECB, bad U.S. economic data in the ISM surveys.
Swiss Franc Currency IndexThe Swiss Franc index had a bad week with a bad Friday. The dollar index rose at the end.
|
Swiss Franc Index Trade-weighted index Swiss Franc 1M(see more posts on Swiss Franc Index, )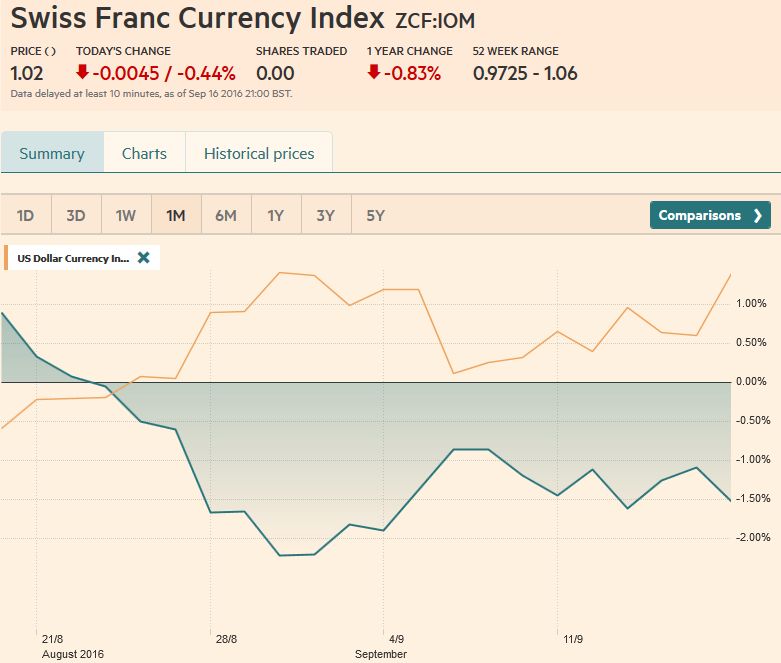 Swiss Franc Index Trade-weighted index Swiss Franc 1M, Click to enlarge. |
|
Swiss Franc Currency Index (3 years)The Swiss Franc index is the trade-weighted currency performance (see the currency basket)On a three years interval, the Swiss Franc had a weak performance. The dollar index was far stronger. The dollar makes up 33% of the SNB portfolio and 25% of Swiss exports (incl. countries like China or Arab countries that use the dollar for exchanges). Contrary to popular believe, the CHF index gained only 1.73% in 2015. It lost 9.52% in 2014, when the dollar (and yuan) strongly improved.
|
Swiss Franc Index Trade-weighted index Swiss Franc 3Y(see more posts on Swiss Franc Index, ) Swiss Franc Index Trade-weighted index Swiss Franc 3Y. Click to enlarge. |
USD/CHF
|
US Dollar - Swiss Franc FX Spot Rate(see more posts on USD/CHF, )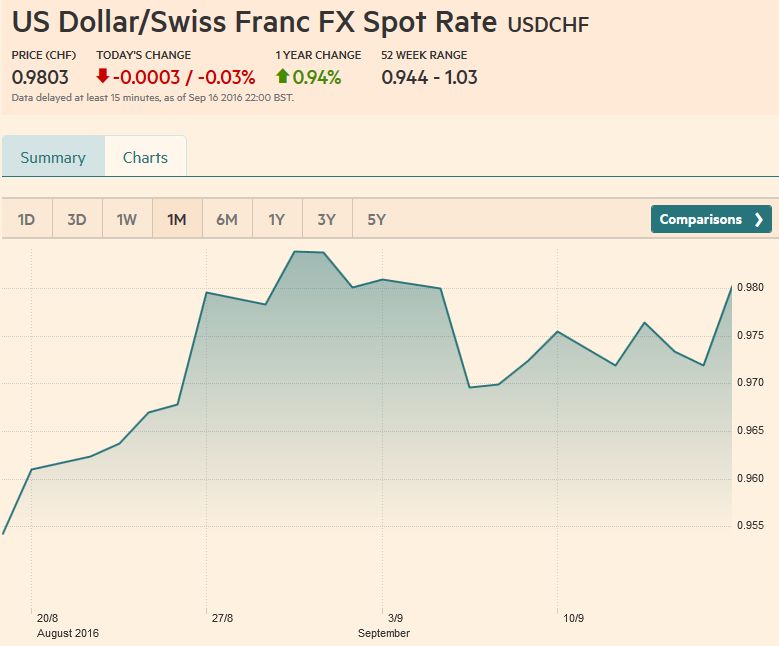 US Dollar - Swiss Franc FX Spot Rate - click to enlarge. - Click to enlarge |
US Dollar IndexThe US dollar rose against the major currencies except the Japanese yen last week. It also appreciated against most of the emerging market currencies, with the South African rand, the Brazil real, and the Chinese yuan the notable exceptions.
Consistent with the recent pattern, the dollar closed the week on a firm note. The dollar has appreciated against the euro and yen each Friday for the past five weeks. In addition, on each Friday over this period, the US interest rate premium rose against Germany and Japan, on two-year and 10-year money.
What happens on Monday’s, you ask. The euro has fallen in three of the four Monday’s. Last Monday broke the streak. There was not “turn-around Tuesday” for the euro during this period. The euro finished the North American session lower on three of the the past four Tuesday’s.
|
US Dollar Currency Index Dollar Index(see more posts on Dollar Index, )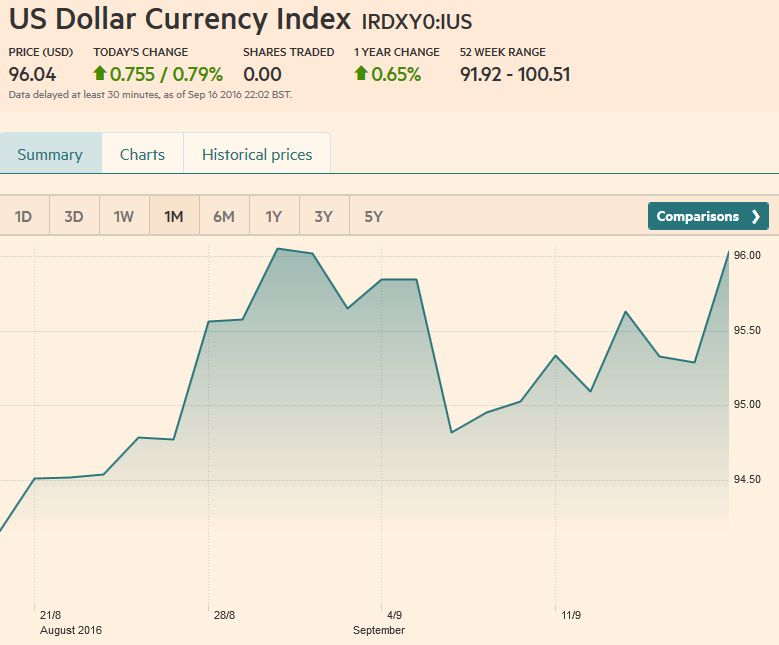 US Dollar Currency Index Dollar Index - click to enlarge. - Click to enlarge |
EUR/USDThe weakness of the euro is very astonishing. The EUR/USD has fallen:
The euro broke out of the narrow range that had dominated the week in response to the slightly firmer than expected US CPI, where, as we have warned, is being driven higher by rents and medical services. The technical tone is poor. It broke the up trendline we have been monitoring (drawn off the late-July, late-August, and early-September lows), coming in a little below $1.1190 before the weekend. The five-day moving average has slipped below the 20-day. The RSI and MACDs have turned down.
The 50% retracement of the advance from late July is found near $1.1160, and the euro closed below it. The 61.8% retracement is at $1.1110. Before the euro gets there, it has to overcome the shelf created in early-September in the $1.1120-$1.1145 band. The lower Bollinger Band intersects at the lower end of that shelf. Lastly, we note euro nearly fell to the 200-day moving average (~$1.1145) before the weekend. This average caught the lows in late-August and early-September.
|
Euro/US Dollar FX Spot Rate(see more posts on EUR/USD, )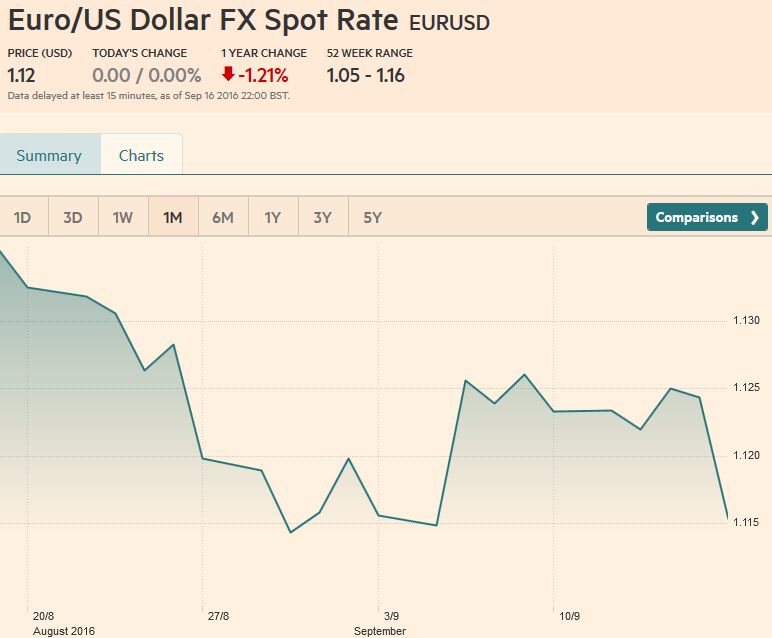 Euro/US Dollar FX Spot Rate - click to enlarge. - Click to enlarge |
USD/JPYAfter advancing against the yen for the past five Friday’s, the dollar’s has advanced in two of the past four Monday’s. The same is true for Tuesdays. Initial support is near JPY101.70. Below there,the JPY101.20-JPY101.40 is more significant. On the upside, the down trendline drawn off the late-May, late-July and early-September highs comes in near JPY 103.20 at the start of next week and JPY102.85 at the end.
We have cautioned that the market seems to be an inflection point that is changing intermarket relationship and seems to be impacting the reaction function of market participants. One of these is evident with the yen. Typically, percent changes in the dollar-yen exchange rate and the stocks (S&P 500) are strongly correlated. This has changed.
Over the past 60 days, the correlation stands near 0.36 as it trends lower from the late-July 0.62. The low for the year is 0.34. Over the past 30 days, the correlation (of the percentage change) is negative 0.2. It is the first negative reading since June 2015.
|
US Dollar Japanese Yen FX Spot Rate(see more posts on USD/JPY, )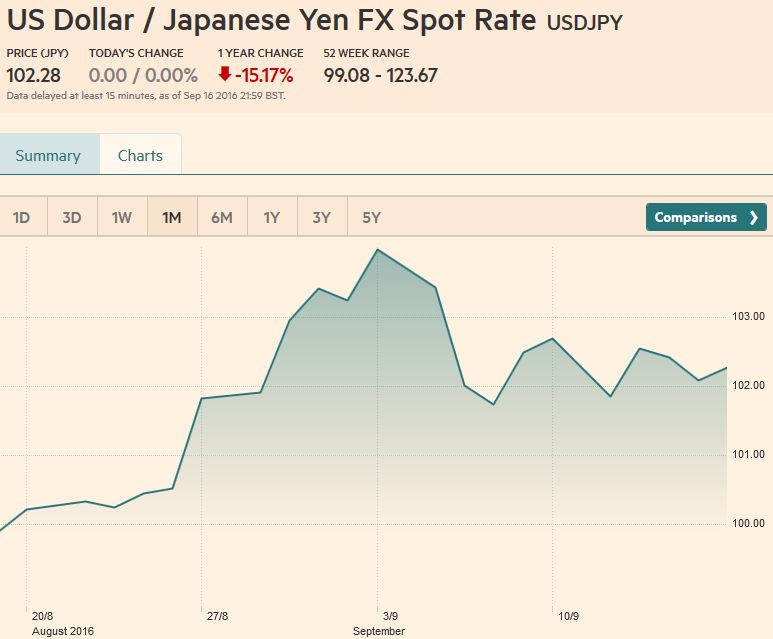 US Dollar Japanese Yen FX Spot Rate - click to enlarge. - Click to enlarge |
GBP/USD
|
UK Pound Sterling / US Dollar FX Spot Rate(see more posts on British Pound, )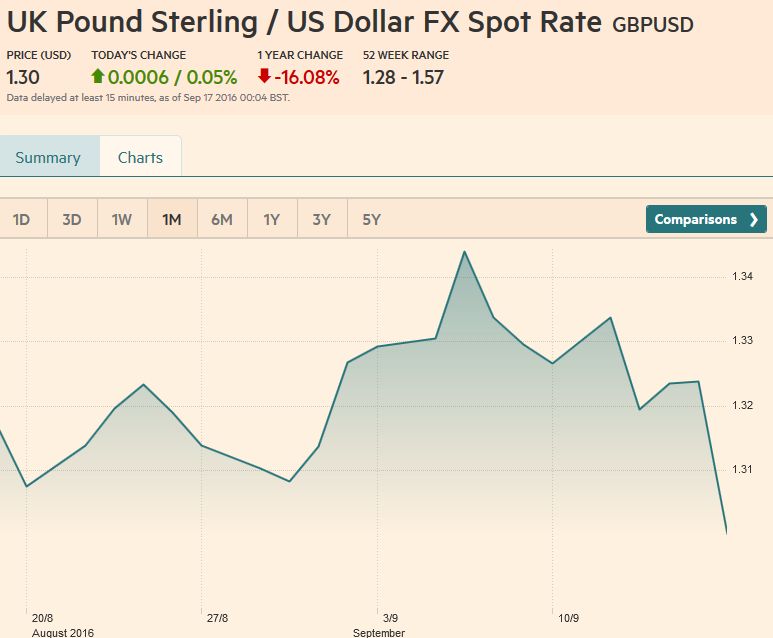 UK Pound Sterling / US Dollar FX Spot Rate - click to enlarge. - Click to enlarge |
AUD/USDThe Australian dollar has fallen in six of the past seven Friday’s. This past Friday was not the exception. It lost about a 0.33% to snap a two day advance in which it gained 0.66%. There is not typically much follow through on Monday’s. Of the six Monday’s during this period, the Australian dollar has risen on five of them.
To close lower before the weekend, the market had to reject the three-day high (~$0.7525) that it had reached. The recent lows in the $0.7440 area is the immediate target. More significant support is seen at $0.7400.
|
Australian Dollar / US Dollar FX Spot Rate(see more posts on Australian Dollar, )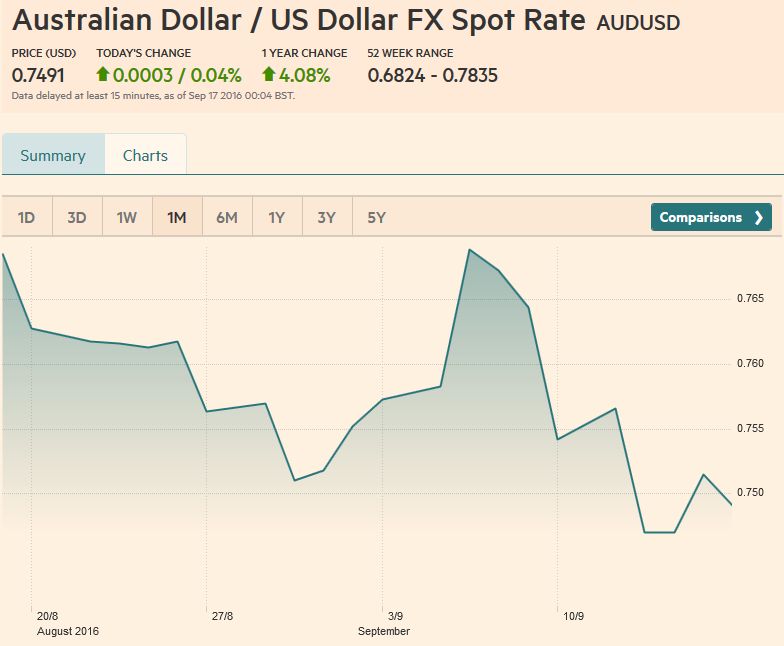 Australian Dollar / US Dollar FX Spot Rate - click to enlarge. - Click to enlarge |
USD/CADThe US dollar traded above our CAD1.32 target in the last three sessions and finally managed to close above it before the weekend. This is the upper end of a four-month trading range. To convincingly indicate a breakout, a close above CAD1.3250 is needed. The CAD1.3310 is a 38.2% retracement of the greenback’s drop from nearly CAD1.47 on January 20 to CAD1.2460 on May 3. The 50% retracement is CAD1.3575.
The Mexican peso lost 3.6% last week to new record lows against the US dollar. It was the poorest performer of among emerging market currencies. In the first half of September is has fallen 4.2%. Year-to-date, it is off 12.25%, the most except for the Argentine peso, which has fallen 14.6%.. With the US Presidential contest tightening, many link Trump’s rise to the peso’s weakness.
|
US Dollar / Canadian Dollar FX Spot Rate(see more posts on Canadian Dollar, )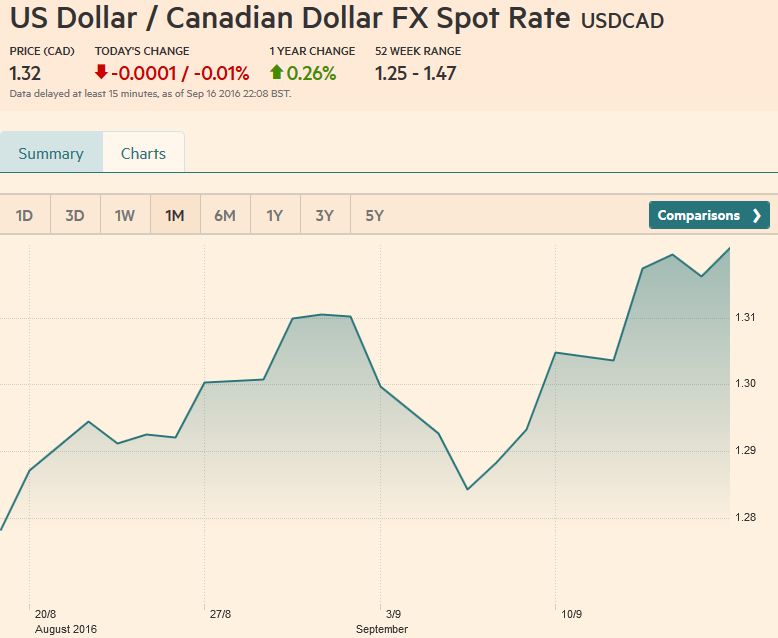 US Dollar / Canadian Dollar FX Spot Rate - click to enlarge. - Click to enlarge |
Crude Oil
|
Crude Oil(see more posts on Crude Oil, )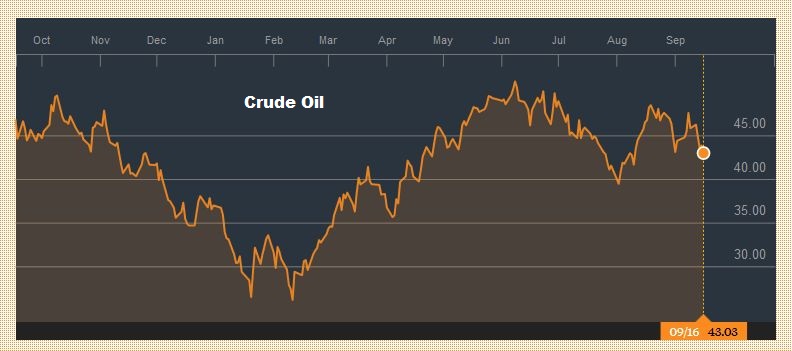 Crude Oil - click to enlarge. - Click to enlarge |
U.S. TreasuriesThe US 10-year note yield continues to trade in a new and higher range. The low last week, around 1.635% was still above the top of the previous range (1.60%). The top of a new range appears to be near 1.75%. The market yield has closed above the 1.70% level only once, and it needs to do this convincingly to boost confidence of an advance into the 1.80%-1.90% band.
While the 10-year yield has risen for five Friday’s, there has not been an increase on any of the four Monday’s of the streak. The December note futures faltered at 130-26 before the weekend, as a bounce was held in check by the 20-day moving average. A break of last week’s low (~129-26) could signal a move toward 129-00 initially.
|
Yield US Treasuries 10 years(see more posts on U.S. Treasuries, )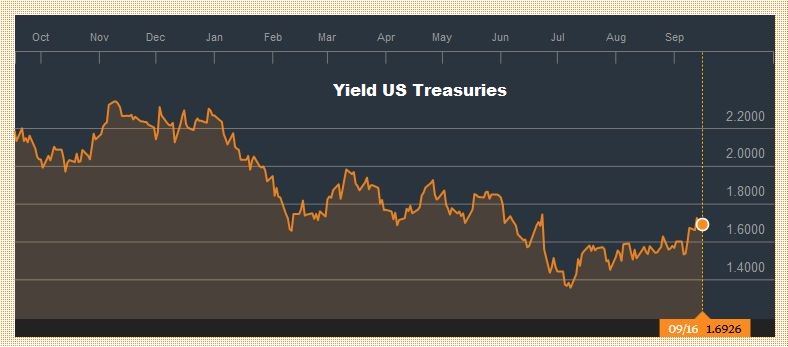 Yield US Treasuries 10 years - click to enlarge. - Click to enlarge |
S&P 500 Index
|
S&P 500 INDEX(see more posts on S&P 500 Index, )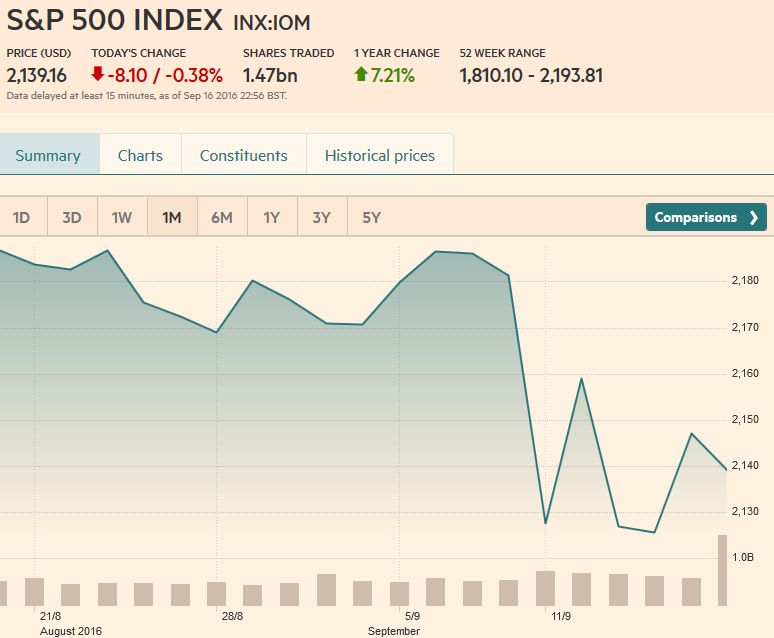 S&P 500 INDEX - click to enlarge. - Click to enlarge |
Charts and CHF data added by George Dorgan and the snbchf team
Are you the author?Tags: Australian Dollar,British Pound,Canadian Dollar,Crude Oil,Dollar Index,EUR/CHF,EUR/USD,Euro,Japanese yen,MACDs Moving Average,newslettersent,S&P 500 Index,Swiss Franc Index,U.S. Treasuries,usd-jpy,USD/CHF,USD/JPY


