George Dorgan
My articles My siteAbout meMy videosMy books
Follow on:LinkedINTwitterSeeking Alpha
CFA SocietyEconomicBlogs
Swiss Franc Currency IndexThe Swiss franc (-0.3%) and the yen (-0.5%) were the worst performers as so-called “safe haven” buying was reversed during the week after Brexit.
But the Swiss Franc index is still stronger in the last month.
|
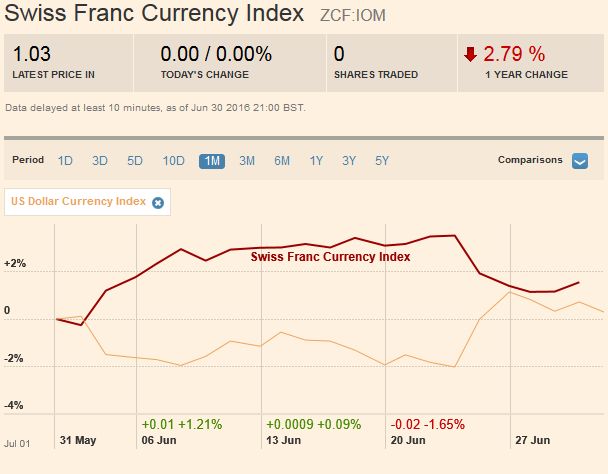 Via Financial Times. Click to enlarge. |
Swiss Franc Currency Index (3 years)The Swiss Franc index is the trade-weighted currency performance (see the currency basket)On a three years interval, the Swiss Franc had a weak performance. The dollar index was far stronger. The dollar makes up 33% of the SNB portfolio and 25% of Swiss exports (incl. countries like China or Arab countries that use the dollar for exchanges). Contrary to popular believe, the CHF index gained only 1.73% in 2015. It lost 9.52% in 2014, when the dollar (and yuan) strongly improved.
|
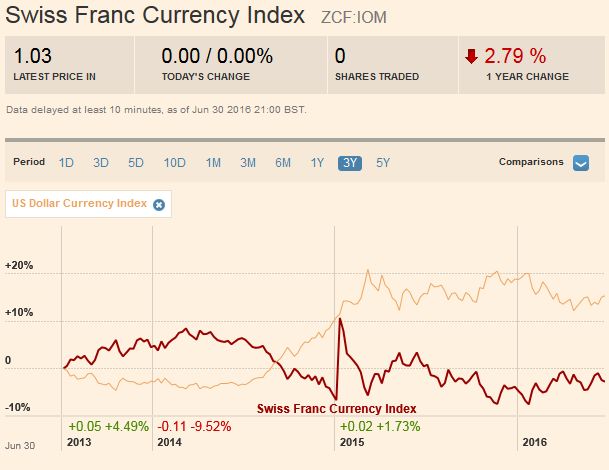 Via Financial Times. Click to enlarge. |
EUR/CHFLast week, the euro recovered from a bad start after Brexit. We will learn in our weekly sight deposits and speculative positions, how much the SNB had to intervene.
|
FX Rates June 27 to July 01, 2016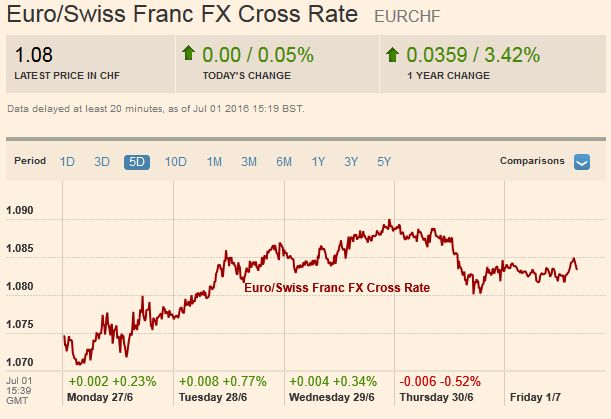 Click to enlarge. |
USD/CHFThe major move during the Brexit period was into the US Dollar. The fundamental reasoning was that Brits have less purchasing power when the currency loses ground. Sales of Swiss companies should be hit harder than sales of US firms. Unexpectedly the main safe havens were USD and JPY, but not CHF.
|
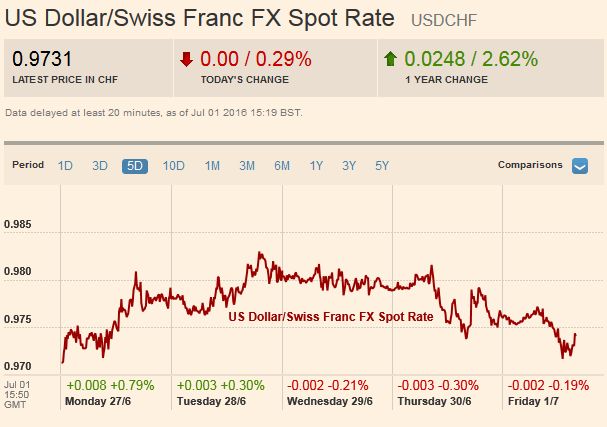 Click to enlarge. |
Marc Chandler
My articles My offerMy siteAbout meMy videosMy books
Follow on:LinkedINTwitterSeeking AlphaAmazon
US DollarThe US dollar turned in a mixed
performance in the week after the UK decision to leave the EU. There was an acute market reaction for a couple of days, but the disruption to the financial system was not major. Officials and investors feared worse. The initial line of defense, central bank swap lines were barely used. The Bank of Japan was the only central bank to draw on the Fed’s lines, and even then, the amount was inconsequential ($2 million).
The dollar-bloc and the Swedish krona did best as risk appetites seemed to return. Consistent with this was the 4% rally in the MSCI Emerging Market equity index. This was the largest weekly rise since early-March. It finished the week at its highest level since June 9.
Both the Dollar Index and euro appear to be carving out a flag pattern. Flag patterns are usually continuation patterns. If valid, it would suggest that from a technical point of view, addition dollar gains are likely.
It is not clear at what level the pattern is no longer valid in the Dollar Index. Ideally, it would hold above 95.30, a retracement level that corresponds with the 20-day moving average (~95.25), but even if it eases to 94.40 (200-day moving average is near 94.65), it may still be valid. Flags fly at half-mast, and depending on how the pattern unfolds; it could project toward 97.50-98.00.
|
FX Rates June 27 to July 01, 2016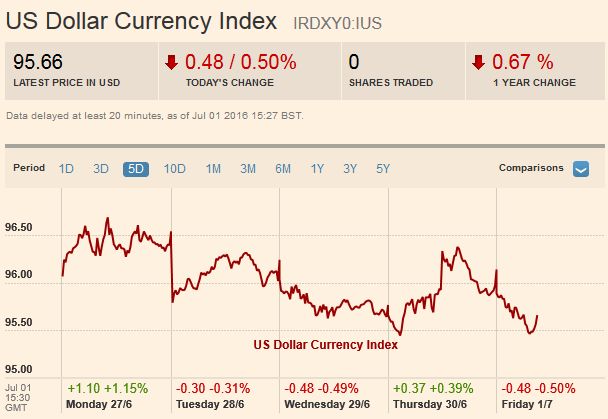 Click to enlarge. |
EUR/USDThe euro held the $1.1170 retracement level ahead of the weekend. Above there is the $1.1230 retracement target, which coincides with the 20- and 100-day moving averages. Support is seen in the $1.1000-$1.1030 band. If its flag is also at half-mast, it could project a move |
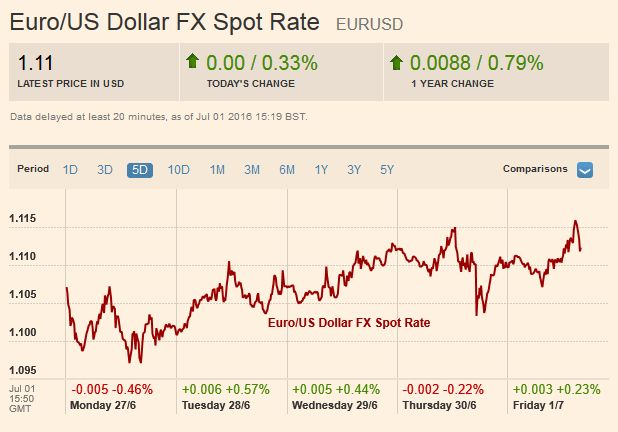 Click to enlarge. |
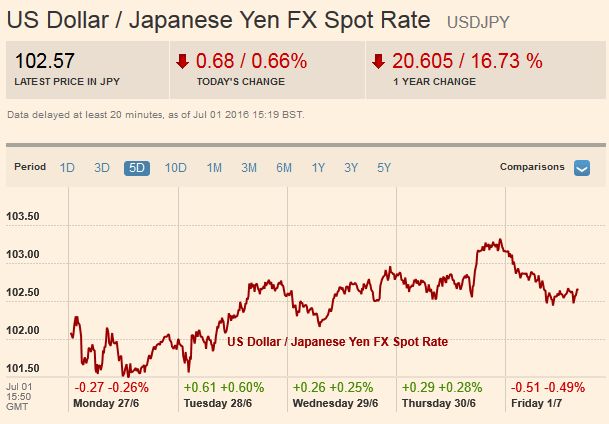
USD/JPYThe dollar was turned back from the week high near JPY103.40 before the weekend, and it was pushed to the lower end of its
The RSI is low and flat, but the MACDs are about to turn higher. The slow stochastics are also constructive. We suspect that the blowout move to JPY99 satiated many of the yen bulls, and are more inclined to buy dollars on further weakness, in anticipation of a recovery in US job growth, and new stimulus in Japan after the July 10 upper house election.
|
 Click to enlarge. |
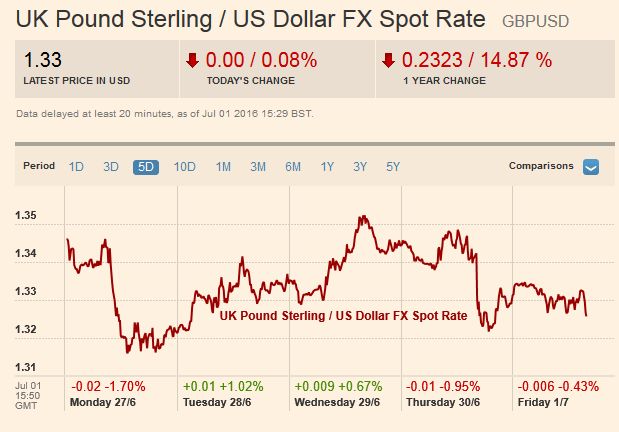
GBP/USD
|
 Click to enlarge. |
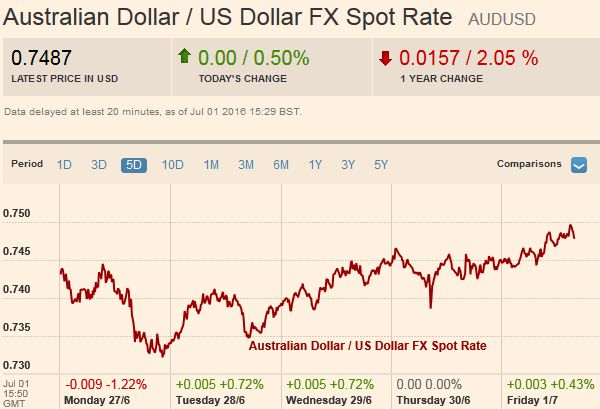
AUD/USDThe Australian dollar extended its The technical tone remains constructive with |
 Click to enlarge. |
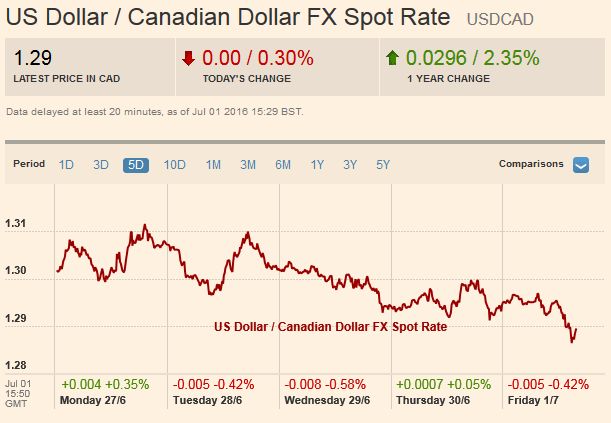
USD/CADThe Canadian dollar was the strongest of Important support for the US dollar, near CAD 1.2850, remained intact. It corresponds with a retracement objective and the 20-day moving average. A convincing break could warn of a move back to CAD 1.27. |
 Click to enlarge. |
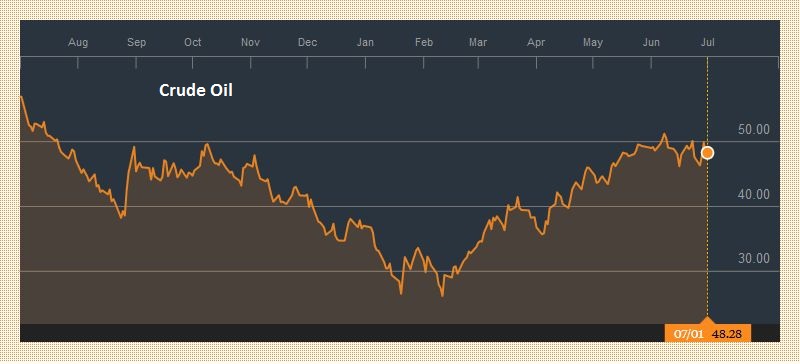
Crude OilOne of the things that may have helped the
|
 Click to enlarge, Source Bloomberg
|
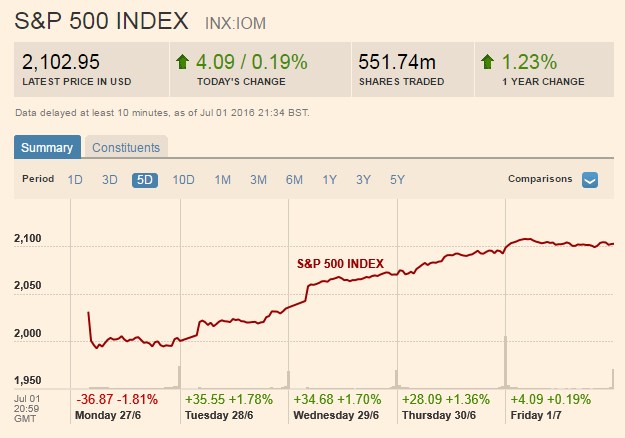
S&P 500The S&P 500 traded at 2113 as the UK went to the polls on June 23. It reached a low of 1991 two sessions after the vote. It then proceeded to rally strongly, finishing each session The S&P gapped lower to start the week but gapped higher Wednesday, leaving a bullish two-day island bottom. This year’s high was set in early June near 2120, and the 2015 high was 2135. They are the obvious targets. The speed of the market’s recovery probably means that there was not broad participation. This may suggest good buying could materialize on the next pullback, which would then stop shy of technical objectives. |
 click to enlarge |
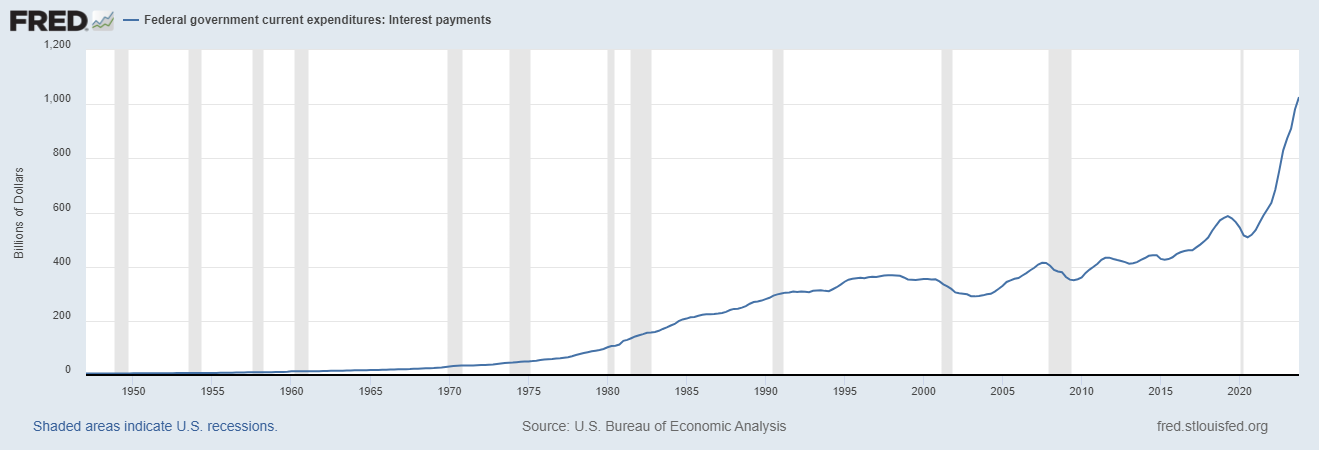
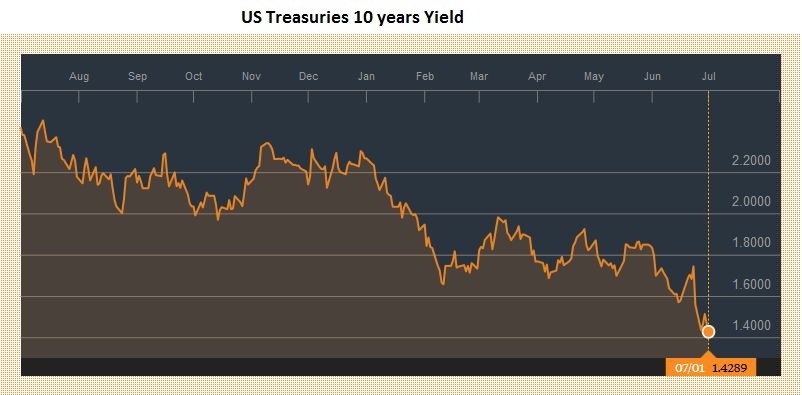
US TreasuriesThe US 10-year yield fell for the fifth consecutive week. On May 27, the yield finished at 1.85%. This week it dipped below 1.38% and closed near 1.46%. The decline in yields is happening as the US economy accelerates toward trend growth.
The Atlanta Fed says Q2 growth tracked 2.6%, while the NY Fed
puts it at 2.1%. Less than half of the decline in nominal ten-year yields can be explained by a decline in inflation expectations. The 10-year break-even fell 17 bp in Q2, whereas the 10-year yield fell 45 bp. Shifting expectations for Fed policy may also be playing a role in driving down long-term yields. The two-year note yield has also fallen for the fifth consecutive week and fell 41 bp since the end of May. However, we suspect the most important driver is not what is a
happening in the US, but the continued fall in yields in Europe and Japan.
German and Japanese rates are negative
through 15 years, and the entire Swiss curve offers negative yields. The French curve is negative out eight years. And, importantly, given the ECB’s self-imposed prohibition against buying bonds with yields less than the deposit rate (minus 40 bp), this means that Germany Bunds out seven years are no longer eligible. The 10-year may be one small shock away from being disqualified. French bonds through four years are ineligible, and there may have been some days that the five-year bond could not be included in the program.
That said, the September 10-year note futures spent last week consolidating the re-pricing triggered by the Brexit decision above the price highs seen before the referendum.
The market appears stretched (e.g.,is bumping against the upper Bollinger Band), but broad sideways trading ahead
of the job data rather than an outright correction may be the most likely scenario. |
|
Charts and CHF comment data added by George Dorgan and the snbchf team, Text Posted by Marc Chandler on Marc to Markets,
Are you the author?Tags: Canadian Dollar,Crude Oil,Dollar Index,EUR/CHF,EUR/USD,FX Weekly Review,inflation expectations,MACDs Moving Average,newslettersent,Safe-haven,Stochastics,Swiss Franc Index,U.S. Treasuries,USD/CHF,USD/JPY