Marc Chandler
My articles My offerMy siteAbout meMy videosMy books
Follow on:LinkedINTwitterSeeking AlphaAmazon
George Dorgan
My articles My siteAbout meMy videosMy books
Follow on:LinkedINTwitterSeeking Alpha
CFA SocietyEconomicBlogs
EUR/CHFThe massive surprise in the US job report was reflected in currency rates. The EUR/CHF surprisingly increased, despite weak US data. This reflects the fact that the ECB is currently considered the most dovish central bank.
|
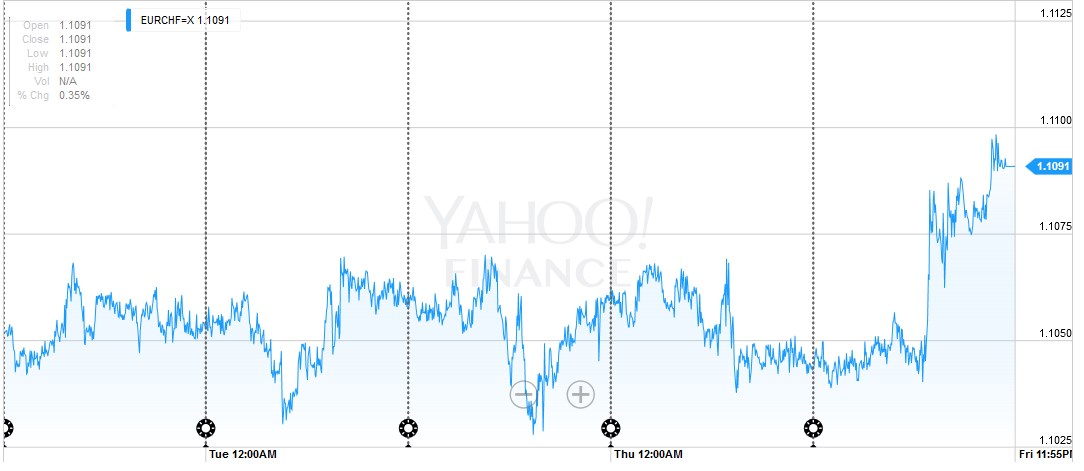 Click to expand |
USD/CHFAfter a relatively steady week, the dollar lost 130 bips on Friday. |
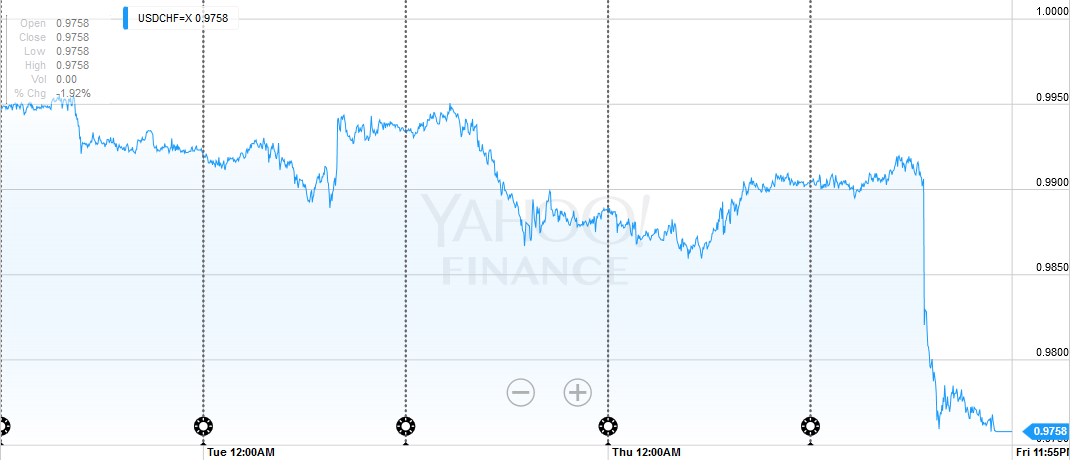 Click to expand |
Continued by Marc Chandler:
The US dollar was mostly firmer over the past week. There were two exceptions among the major currencies: Sterling and the Canadian dollar.
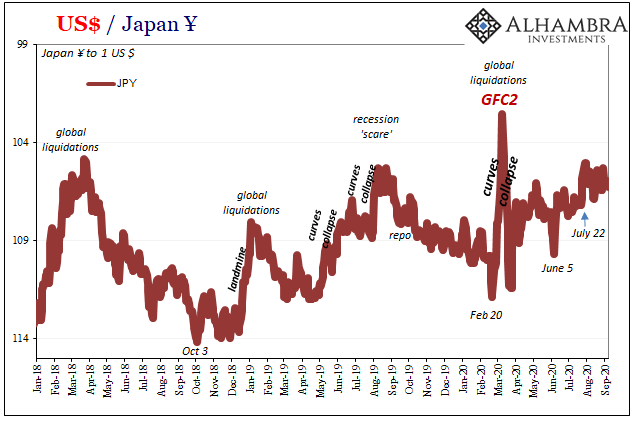
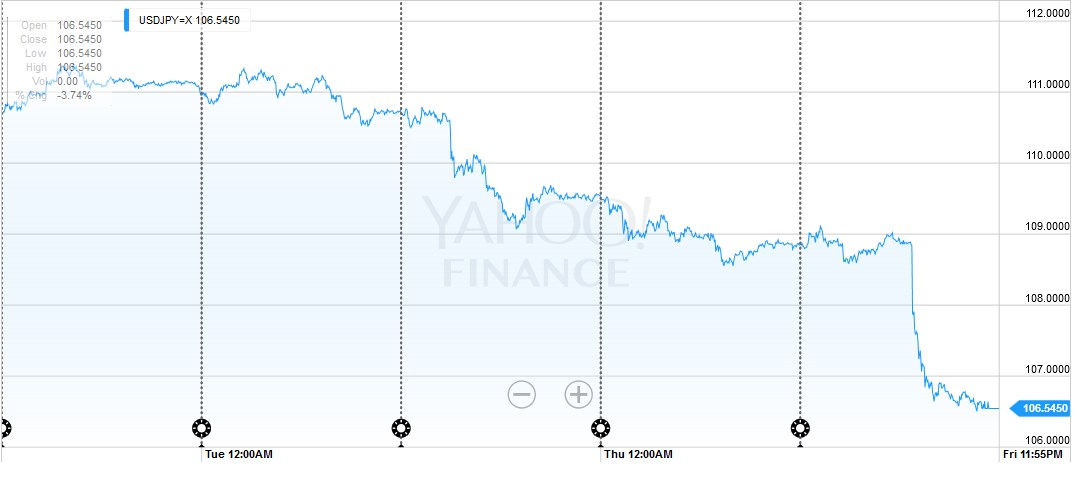
USD/JPYThe US dollar reversed higher on May 3 and trended higher. It peaked on May 30, but it was not clear until the poor US jobs report sent the greenback reeling on June 3. The fact that May 3-May 30 move is over is the most important technical consideration for the dollar’s outlook.
It is interesting to recall that the dollar had bottomed a fortnight before the FOMC minutes and Fed comments had encouraged the market to re-price a summer hike. The dollar now has peaked prior to investors pushing out the rate hike once again.
The prudent first assumption is that the dollar is correcting its May advance. This simple approach can be used for all the major currencies, but the Japanese yen, which took out the retracement objectives. While the JPY106.25 area may offer the dollar some initial support, there is little stopping a return to the May 3 low of JPY105.55. A break of it would fan expectations of a move toward JPY100 (with JPY100.60 representing a 50% retracement of the Abe-Kuroda rally).
Given that many fund managers are barred from taking naked currency positions, a bullish yen view can be expressed by buying Japanese government bonds. Foreigners have been net buyers of JGBs for nine consecutive weeks, after selling in March. At the same time, others may conclude that the yen’s strength (even if actually dollar weakness) may increase the likelihood of additional easing by the BOJ. This may attract some foreign buyers or JGBs on ideas that yields still have room to fall.
|
 click to expand |
|
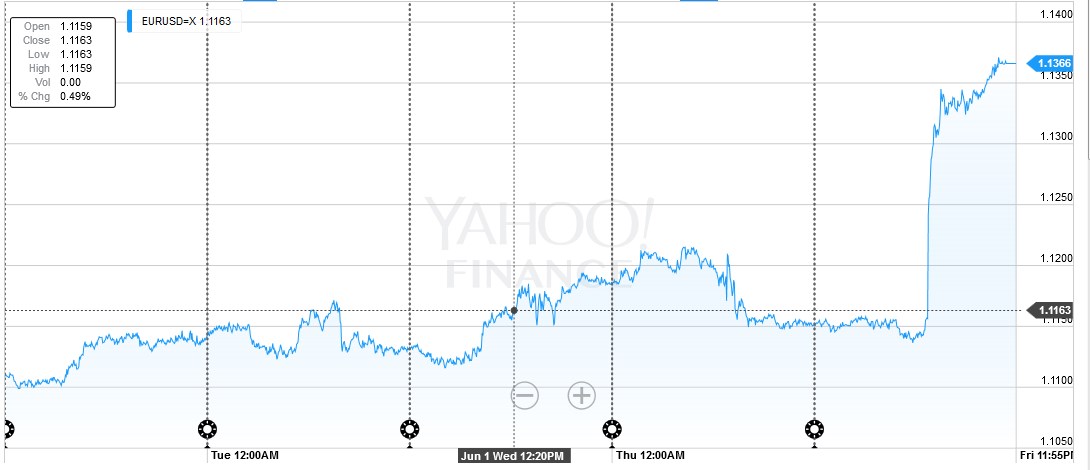
EUR/USDThe euro’s rally after the dismal US employment report was the third largest advance of the year. It shot through the 38.2% retracement near $1.13 to approach the 50% retracement at $1.1360. Above there is the 61.8% retracement objective ($1.1420) which is also near the upper Bollinger Band ($1.1440). The five moving average is likely to cross above the 20-day early next week, and this is a helpful proxy for trend followers. Technically, the euro should hold above $1.1250.
|
 click to expand |
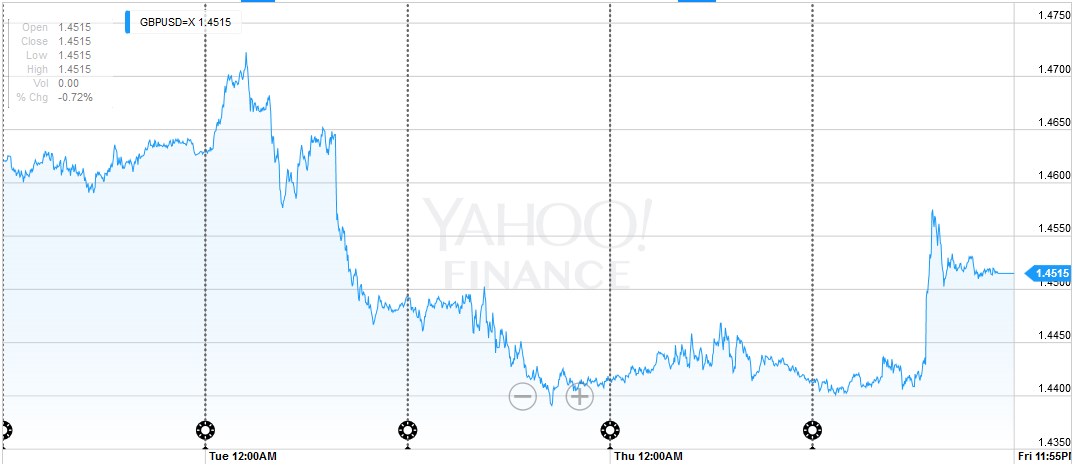
GBP/USDSterling was the only major currency to lose ground against the US dollar in the past week (~-0.6%). The culprit was not the economic data. In fact, the UK’s composite PMI for May was better than expected at 53.0, which is also above the three-month average. Fears of Brexit appear to have been rekindled based on some surveys, and sterling experienced its biggest weekly drop against the euro in a year.
The euro had trended lower against sterling from early-April through late-May. Over that period, the euro went from about GBP0.8115 to around GBP0.7565. That move effective retraced 50% of the euro’s advance from last November and is over. The next target for the euro is GBP0.7840 and then GBP0.7900. Against the dollar, the $1.4600 offer initial resistance with stronger cap a little above $1.4700.
|
 |
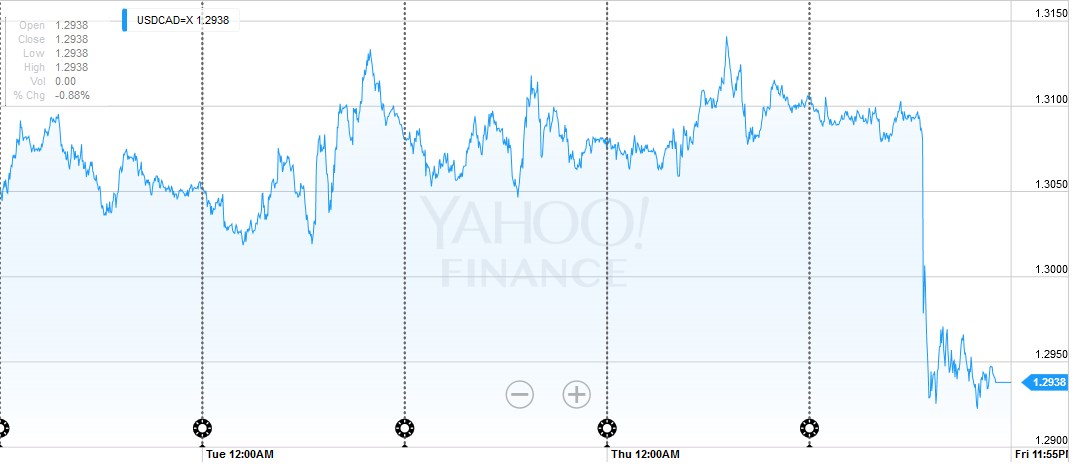
USD/CADThe US dollar has shed 38.2% of its gains against the Canadian dollar that have been registered since May 3’s key reversal. The CAD1.2910 level was first seen on May 26, but the greenback recovered over the next several sessions to hit a high near CAD1.3145 on June 2. The technical indicators suggest a high probability that the CAD1.2910 will yield, which would allow for a move toward CAD1.2825, and possibly CAD1.2740.
|
 click to expand |
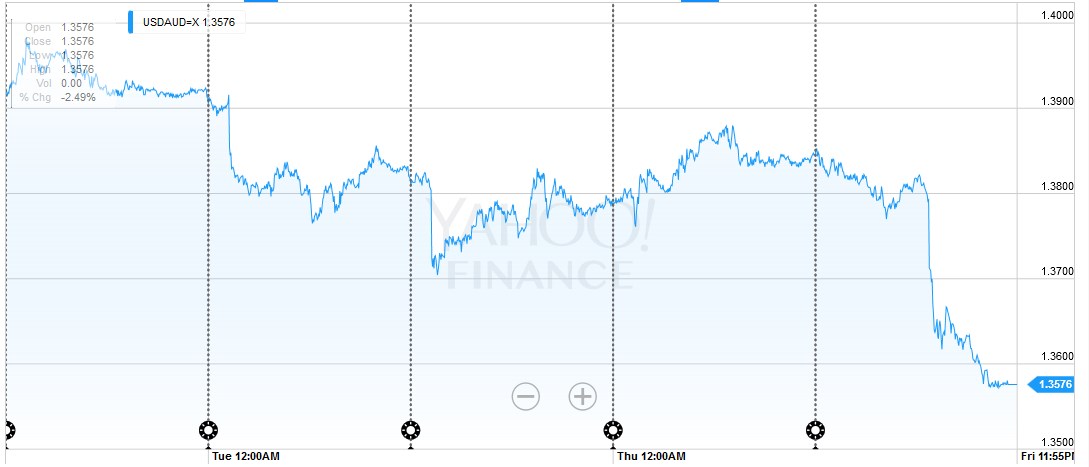
USD/AUD. Recently, the Australian dollar has been leading the other majors. The Aussie peaked on April 21 (~$0.7835), while the other majors did not peak until May 3. The Aussie bottomed on May 24 (~$0.7145). The other majors did not bottom until May 30. An upside correction should be expected in the period ahead. The first target is a little above $0.7400 and then $0.7500. We do not expect the RBA to cut rates next week, but if it does, the Australian dollar needs to hold around $0.7270 to keep the constructive outlook intact.
|
 click to expand |
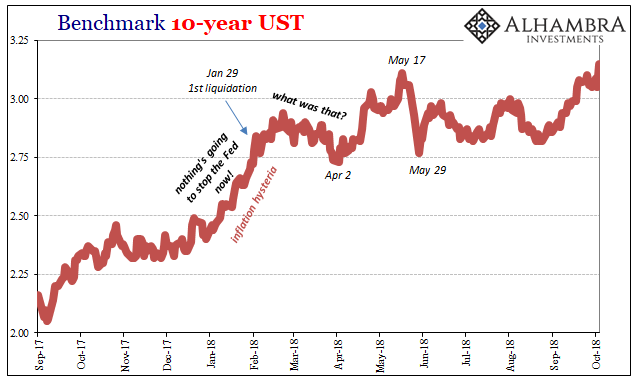
Bonds
Equities
The S&P 500 recovered from below 2050 to approach 2100. The technical indicators are supportive for a re-test on the year’s high set in April near 2111. Last November’s high was about 2116, and the record high was set last May at almost 2135.
Oil Prices
The firmer US dollar has not derailed the recovery in oil prices. The July contract flirted with the $50 barrel level but the market could not sustain the initial thrust. The pullback was shallow. Supply disruptions (and the drawdown in US inventories) appear to be the fundamental catalyst. OPEC is unlikely to reach an output freeze agreement. The RSI and MACDs suggest the market is stretched, but have yet to turn down. We will be on the lookout for a reversal pattern after the strong run-up.
Originally Posted by Marc Chandler on Marc to Markets, Charts and CHF data added by George Dorgan and the snbchf team
Tags: Japanese yen,newslettersent,SPY,usd-jpy