George Dorgan
My articles My siteAbout meMy videosMy books
Follow on:LinkedINTwitterSeeking Alpha
CFA SocietyEconomicBlogs
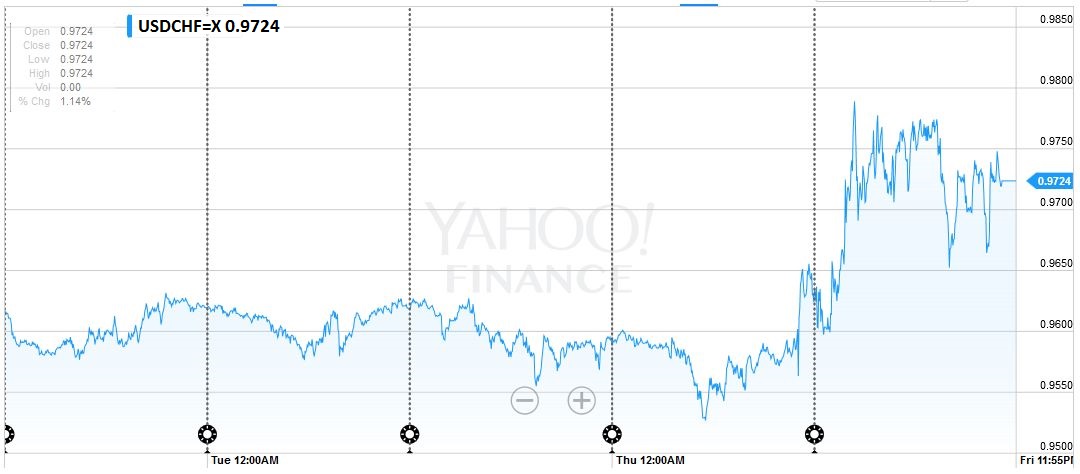
EUR/CHFThe Euro-Swiss remained nearly stable at the begin of the week. It peaked shortly before the Brexit referendum, when traders were anticipating a yes. It found its trough when the No was published. We showed the obvious SNB intervention that started at 7.45 am. on Friday.
|
FX Rates June 20 to June 24, 2016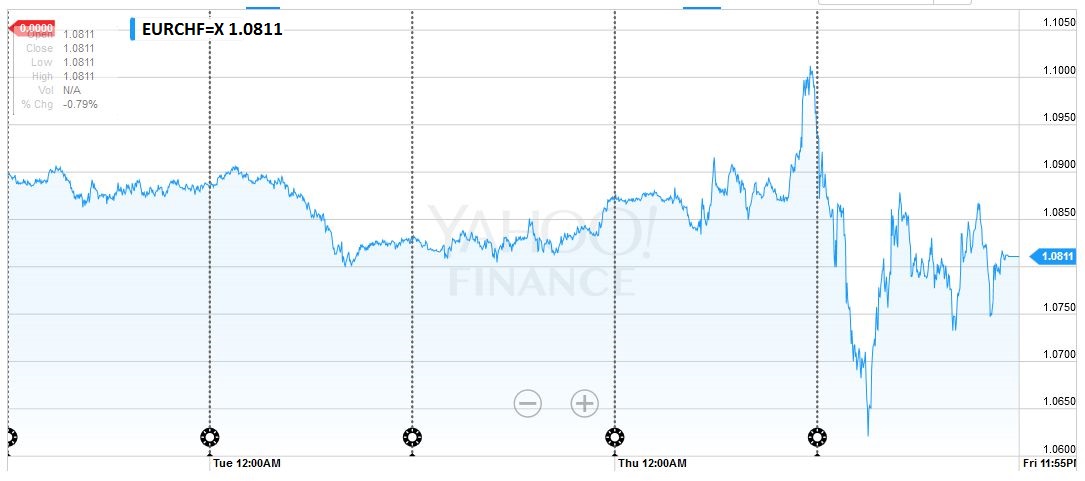 click to enlarge, Source Yahoo Finance |
USD/CHFAfter being nearly stable during the week, the dollar appreciated with the outcome of the referendum.
|
 click to enlarge, Source Yahoo Finance |
Marc Chandler
My articles My offerMy siteAbout meMy videosMy books
Follow on:LinkedINTwitterSeeking AlphaAmazon
US Dollar IndexThe dramatic reaction to the UK decision to leave the European Union has changed the technical condition in the foreign exchange market.
While the precipitating factor is a fundamental political development, it is mediated by psychology. Group psychology is the subject of technical analysis. In the current context, the technical analysis puts the price action in the larger context and provides mile-markers, as it were, and potential inflection points.
Typically volatility in the short-term is auto-correlated. High volatility in one period is often followed by high volatility in the next.
Not to put too fine of a point on it, it is difficult to put toothpaste back into the tube. That warns that price swings may still be large in the coming sessions. Over the medium- and long-term, volatility is mean reverting, though it does not appear to hold for foreign exchange prices.
The US Dollar Index rallied to approach 96.80, which corresponds to a 61.8% retracement of this year’s decline. Near-term consolidation is likely as the market awaits more clarification, but as long as the 94.50 area holds, the Dollar Index can extend its gains and re-challenge
the 100.00 area that has capped the upside since early last year. |
FX Rates June 20 to June 24, 2016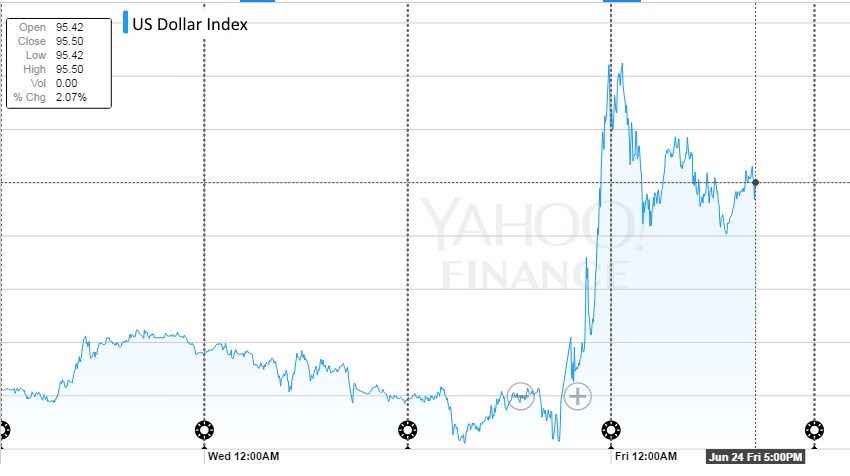 Click to enlarge, Source Yahoo Finance
The U.S. Dollar Index (DXY) tracks the strength of the dollar against a basket of currencies. In recent years, the strength of the U.S. dollar has fallen against other currencies as a result of U.S. monetary policy. It is a weighted geometric mean of the dollar’s value relative to other select currencies: 57.6% EUR, 13.6% JPY, 11.9% GBP, 9.1% CAD, 4.2% SEK, 3.6% CHF
|
EUR/USDThe Euro retraced 61.8% of rally since December 2015 at $1.0940 as the euro spiked through $1.0915. However, it recovered to nearly $1.1200. The market is over-extended, though the euro finished just inside lower Bollinger Band (a little below $1.11). Assuming the euro can overcome the offers near $1.12, there is potential toward $1.13. |
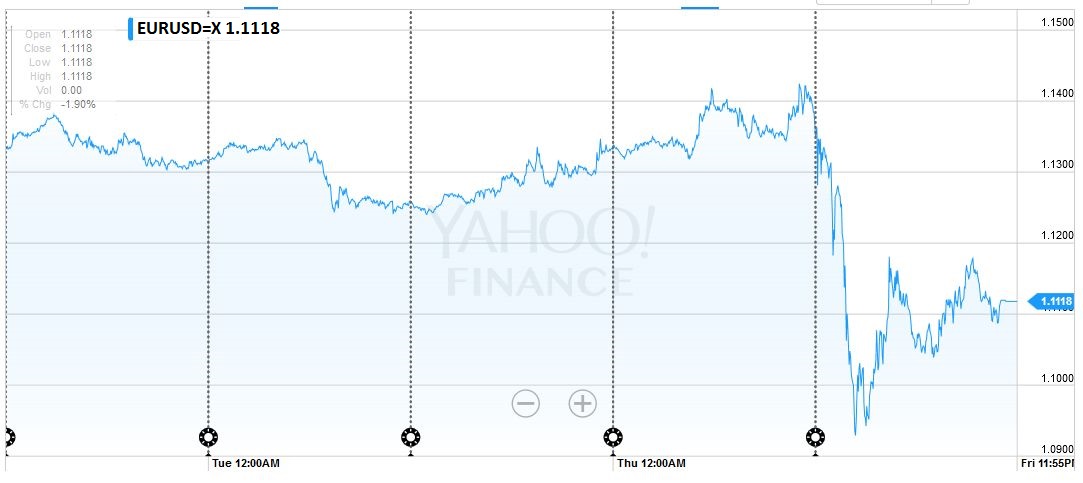 Click to enlarge, Source Yahoo Finance |
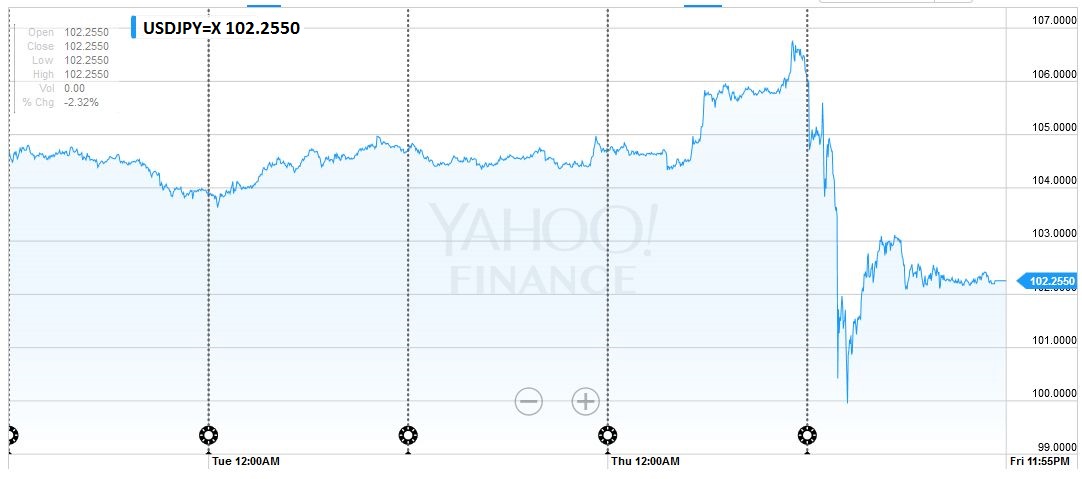
USD/JPYThe dollar fell to JPY99.00 in the frantic activity as it became clear that the UK was choosing to dissolve its more than 40 year old marriage to the EU.
Although some suspected a sharp
bounce to JPY102 may have been intervention, we doubt it. There has been no dealer confirmation, and similar price action in volatile and thin markets was seen in other currency pairs in the same time window. At a little below JPY101, the dollar retraced 50% of the Abe induced rally. The 61.8% retracement is found near JPY95. Like the euro, the dollar managed to finish the week just inside the lower Bollinger Band (~JPY102.10).Its recovery met resistance near JPY103. Just like we think the euro has little more upside potential in the snap back after the dramatic move, so too does the greenback against the yen. There is near-term scope toward JPY104.
Some market participants have been warning of the risk of BOJ intervention since February.
We have been skeptical.
However, in light of the recent developments and the G7 statement that reiterated the undesirability of volatility and disorderly markets, we suspect the risk of intervention has increased. The first line of defense will likely be the swap line network developed during the recent financial crisis. The other point that needs to be made believing that the BOJ picks some level like JPY115, of JPY110, or JPY100 that it will then defend is not particularly helpful, in the sense that it does not lead to robust strategies. It is to misunderstand the concern of officials. It is not the level that is
ultimately the key but the pace of change, or volatility.
|
 click to enlarge, source Yahoo Finance |
GBP/USD
|
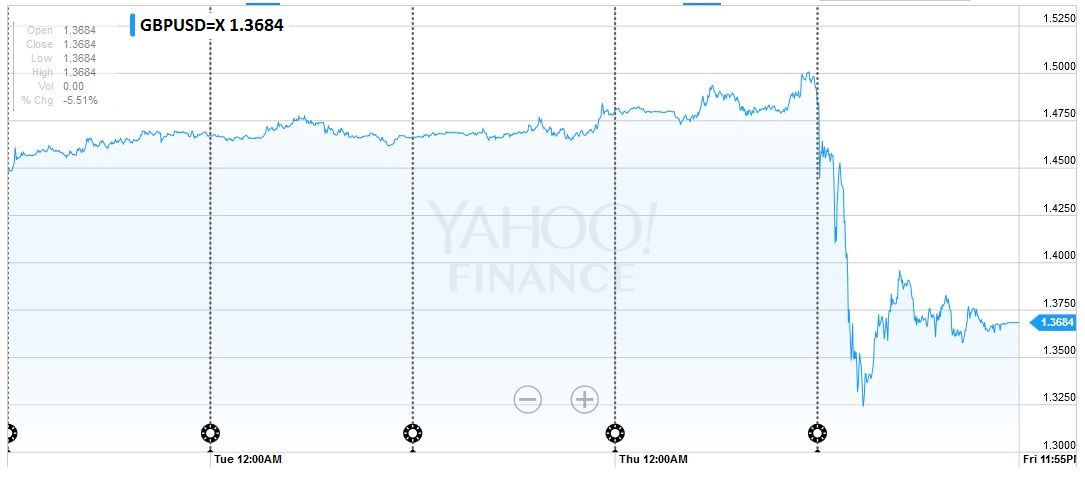 click to enlarge, source Yahoo Finance |
USD/CADThe Canadian dollar was the worst performer among the dollar-bloc currencies last week. The Australian and New Zealand dollars rose a little more than 1% against the US dollar last week. The Canadian dollar lost almost 1%. The US dollar finished near CAD1.30. Near-term potential extends toward CAD1.3100 CAD1.3150. May’s highs were recorded a little below CAD1.3200. This area needs to be taken out to demonstrate a robust bottom is in place. |
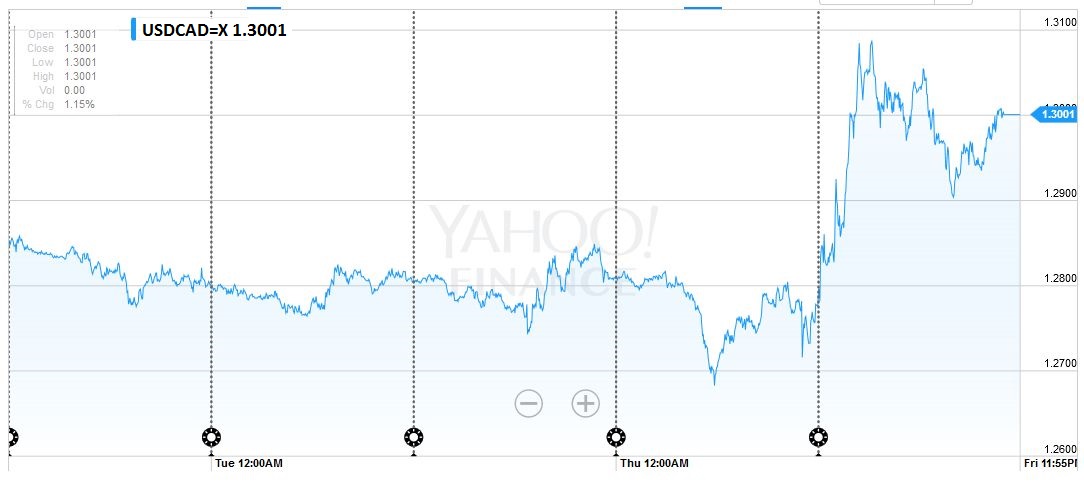 click to enlarge, source Yahoo Finance |
AUD/USDThe Australian dollar has been streaky this Spring. It completed its fourth consecutive weekly advance. This run followed a six-week drop. It finished the week at its highest level since early-May. It is set to extend the move for another week, but it needs to establish a foothold above $0.7500. Failure to do so could spur a setback to $0.7300. |
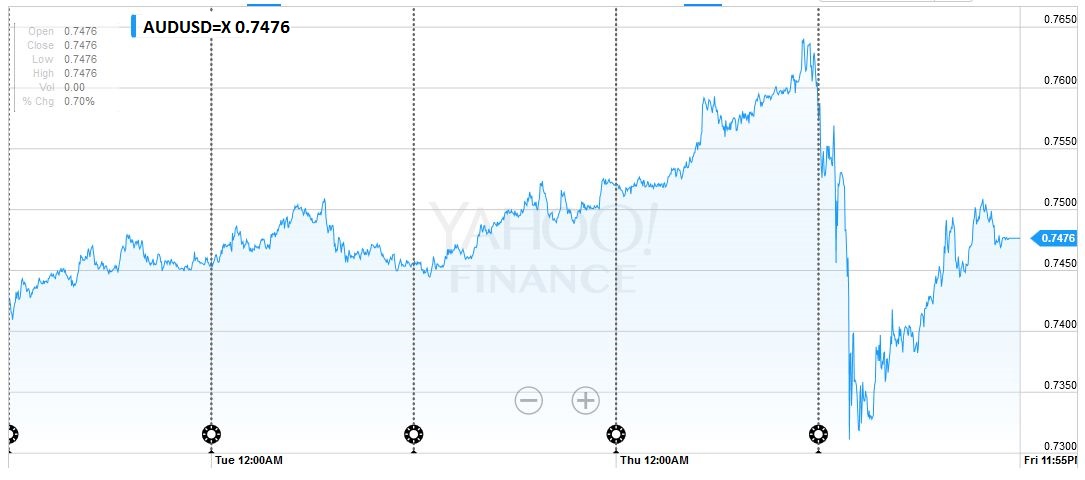 click to enlarge, Source Yahoo Finance |
S&P 500The S&P extended their downdraft for the third consecutive week. The 3.6% loss before the week gave it a 1.6% loss for the week. The technical tone is poor, though, at the low, the S&P 500 stopped around the 100-day moving average (~2033). A move above 2070 would help stabilize the tone. The May low was set near 2026, and the 200-day moving average This gives a measuring objective inthe 1987-1990 area. The 38.2% retracement of the rally off the February lows is near 2000, and the 50% retracement is 1965. |
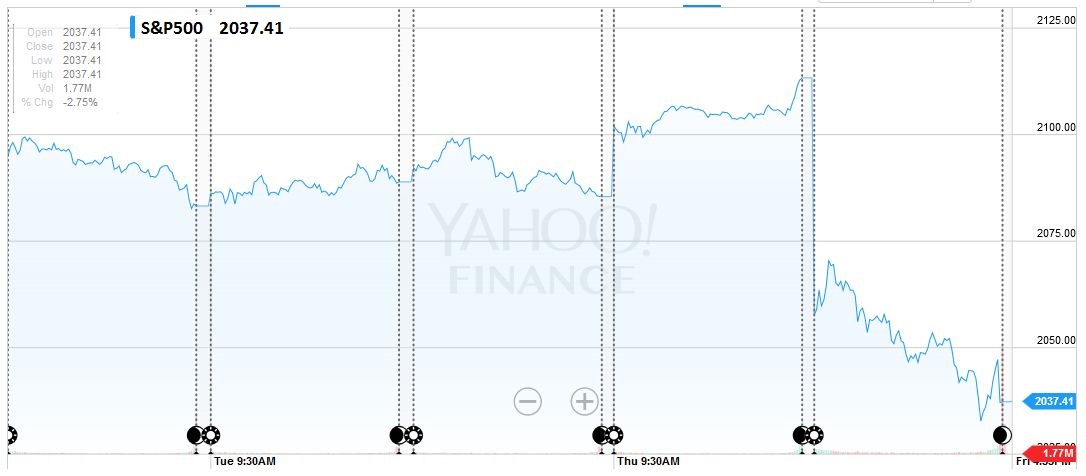 click to enlarge,source Yahoo Finance |
US TreasuriesAfter reaching a panic low of 1.40%, the yield on the US 10-year Treasury note rose no higher than 1.60% and finished the week at 1.56%, down five basis points on the week. Some observers continue to read dire consequences of the drop in US yields. While part of the decline may reflect concern that weaker growth in Europe, including the UK, could weigh on the US economy, part of the decline is reflects flows in a safe haven (public good) offering positive yields in a deep, broad and secure market. A break of the 130-20 to 132-20 range may signal the direction of the next trend. |
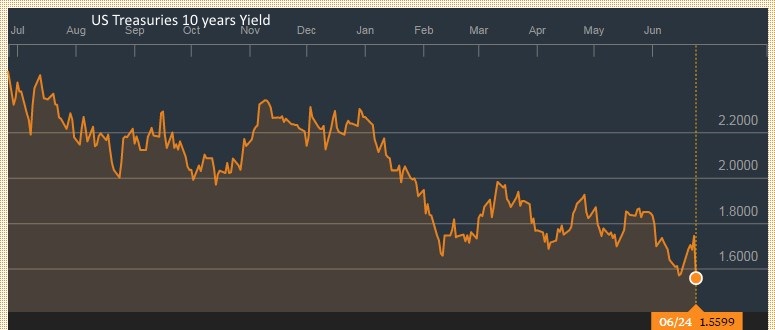 click to enlarge: Source Bloomberg |
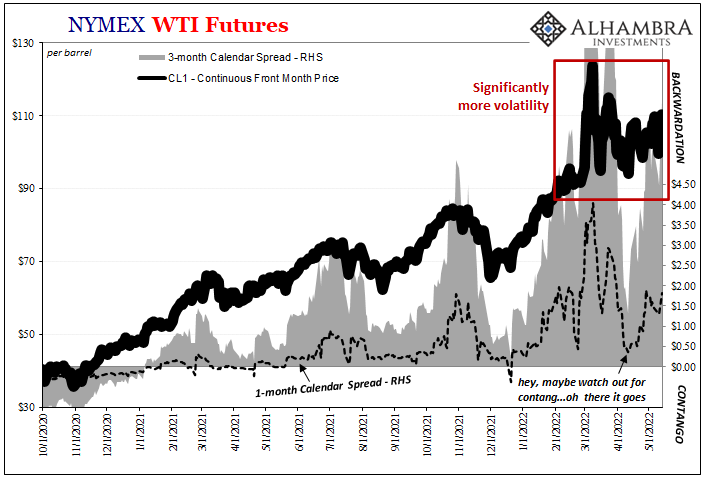
Crude OilThe price of August light sweet crude oil was struggling at the $50 threshold in the days before the UK referendum. The dramatic price action saw it fall to $46.70 before recovering to close at $47.65. The technicals favor the downside, with a break of $46.40 signaling move |
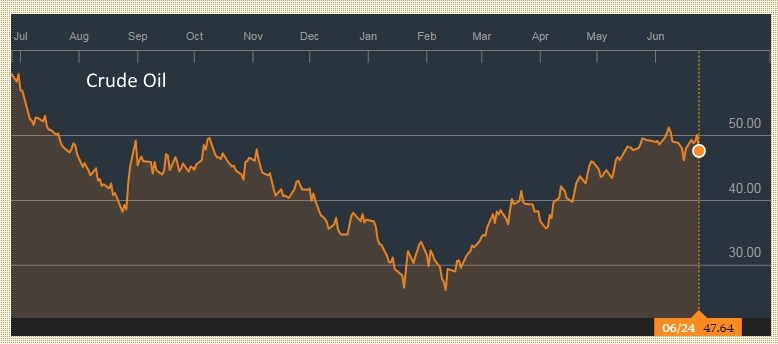 Click to enlarge, Source Bloomberg
|
Charts and CHF comment data added by George Dorgan and the snbchf team, Text Posted by Marc Chandler on Marc to Markets,
Are you the author?Tags: Canadian Dollar,Crude Oil,Dollar Index,EUR/CHF,EUR/USD,newslettersent,U.S. Treasuries,USD/CHF,USD/JPY