Marc Chandler
My articles My offerMy siteAbout meMy videosMy books
Follow on:LinkedINTwitterSeeking AlphaAmazon
 The US dollar continued the recovery begun May 3 and rose against most of the major currencies over the past week. A nearly 3.5% rally in oil prices, the fifth weekly gain in the past six weeks (a $9.5 advance over the period), helped the Norwegian krone turn in a steady performance. The Canadian dollar’s 0.2% decline put it in second place.
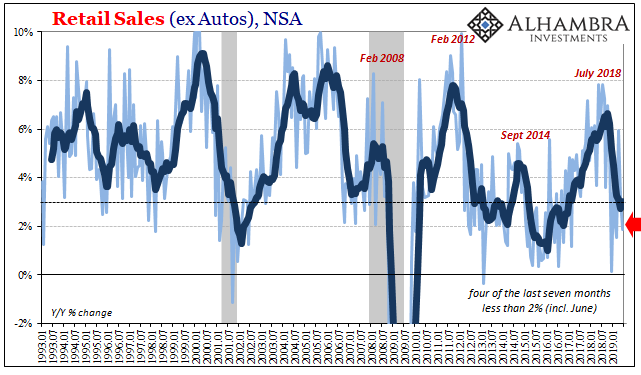
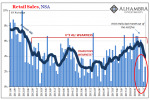
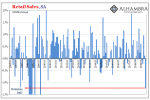
 With the strongest rise in US retail sales in a year, prompting the Atlanta Fed’s GDPNow tracker to rise to 2.8% for Q2, many observers are linking the dollar’s strength to a greater risk of Fed tightening. While we are sympathetic to the idea that the market was underestimating the likelihood of Fed hikes this year, the fact of the matter is that market expectations have not changed, even though greenback is trading better, and the Dollar Index has risen in four of the past five weeks.
The June Fed funds futures imply an average effective rate of 37.5 bp next month. It was 38.5 bp at the end of April. There has been more talk about the possibility of a July hike, though it is not accompanied with new forecasts or a scheduled press conference. At the end of April, the implied yield was 40.5 bp. After the retail sales report, it finished last week at 38.5 bp. In recent weeks, the effective Fed funds rate has averaged 37 bp. Over the past two weeks, the US two-year premium over Germany has is flat (narrowed a single basis point).
The divergence between economists and the market has narrowed, according to the latest Wall Street Journal survey. The economists have moved toward the market rather than the other way around. For the first time since February, a majority of the poll does not anticipate a June hike. In April, three-quarters of the economists saw a June move. Now 31% do, and 21% envision a July hike. Another 31% anticipate a September hike.
For the second week in a row, the euro rose in one of five sessions. Over the past two weeks, it has lost a 1.5 cents. The US retail sales data before the weekend and the downward revision to Germany’s April CPI (-0.4% rather than -0.2%) helped push the euro through an uptrend drawn off the March 10 Draghi-induced lows. It was found near $1.1375 and dovetails with the 20-day moving average.
Last week we anticipated that a break of the $1.1350-$1.1380 area would spur a move toward $1.12. The pre-weekend low was set just above $1.1280. The technical tone is fragile, and the RSI and MACDs are moving lower. The five-day moving average is set to cross below the 20-day average. The $1.12 area remains the next target. A break of it would suggest a more significant euro top is in place and offer the next target near $1.1080.
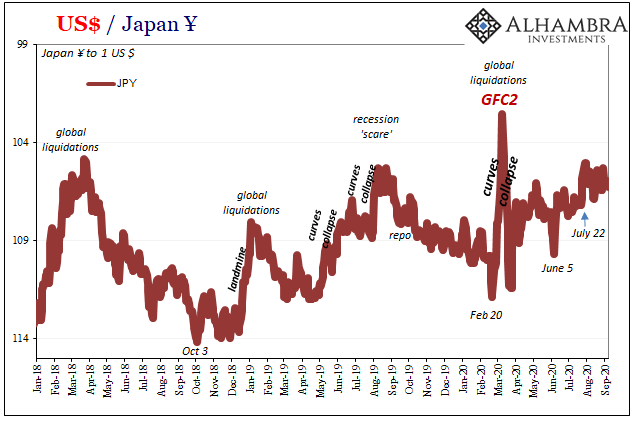
Despite the stepped up verbal threats of intervention, barring some major shock, BOJ intervention ahead of the May 20-21 G7 meeting (which Japan hosts) is not very likely. The greenback spent the last four sessions in roughly a JPY108.25-JPY109.50 range. The greenback bottomed on May 3 near JPY105.50.
The modest recovery has taken place without the help of wider US premium or higher stocks. The US 10-year premium over Japan has narrowed by a dozen basis points since the greenback’s lows. The S&P 500 is off a little less than one percent over the same period, while the MSCI World Index (developed equity market index) is off 1.5%.
The dollar made new lows for the North American session ahead of the weekend, and the close was weak. The greenback did make new highs for the week after the retail sales report. It briefly and marginally pushed through JPY109.50. The inability of to overcome this resistance for four sessions may have spurred technical selling. Recall that in late-April, the market tried five times to send the greenback above the JPY112 area, before giving up, and sending the dollar to new lows (with an assist by Kuroda’s reluctance to ease policy after having just introduced negative rates at the end of January).
The RSI is neutral. The MACDs and slow stochastics are constructive. The five-day average is set to cross above the 20-day average early next week. A loss of JPY108 is probably needed to signify anything important on the downside. A convincing move above JPY109.50 could signal a move back toward the late-April ceiling near JPY112.
Sterling finished the week at its lowest level against the dollar since April 21. The contrast between the disappointing UK construction data for March and a downward revision of the February series and the stronger US retail sales report (and upward revisions in February and March) pushed sterling below the shelf that had been built in recent days near $1.4375.
Unlike the euro and yen, where the five and 20-day moving averages are about to cross, sterling’s averages have already crossed. The RSI and MACDs are moving lower. The next immediate target is $1.4300. Below there is a trend line drawn off the late-February and early-April lows. It is found a little below $1.4200 by the end of next week.
Despite the technical weakness, sterling has been fairly resilient during the dollar’s recovery that began with the reversal on May 3. Since then, sterling’s 1.2% decline means that it is the second strongest of major foreign currencies after the Norwegian krone’s 0.9% slippage. Some observers argue sterling’s relatively good showing is a reflection of the fact that Brexit has been discounted.
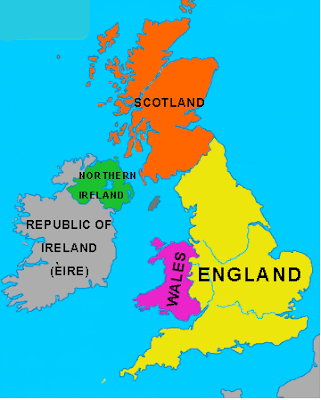
We are less sanguine. First, anecdotally many investors think that, like the Scottish referendum, the polls are exaggerating the tightness. We are worried that this means that their hedge ratios are light. Second, contingent risk, which is what the referendum represents is best expressed through the options market. It is in the options market, not the spot market that shows the Brexit impact.
Two-month volatility posted its second biggest increase of the year before the weekend. Near 17.5%, it rose to its highest level since 2009. At the same time, the skew between puts and calls (two-month 25 delta) is near 4.75%, which is shy of record levels since at the end of April.
The US dollar briefly rose above CAD1.30 at the start of last week. It had not seen that level in a month and was greeted with fresh sales. The greenback fell to nearly CAD1.2770 before reversing higher on Thursday and building on the gains after the retail sales data (and strongest consumer confidence report in a year). These late-week gains suggest, from a technical point of view, that the greenback’s advance that began with a key reversal on May 3 is resuming. A move above CAD1.3045 targets CAD1.32.
The Australian dollar fell 1.3% last week, bringing this month’s decline to 4.4%. With new two-month lows seen before the weekend, additional losses look likely from a technical point of view. The Aussie tested its 200-day moving average (~$0.7260), but we see the next support area near $0.7200, where retracement objectives, the lower Bollinger Band,and past congestion can be found.
The Aussie appeared to lead the move against the US dollar earlier this year. There is a certain symmetry in it now leading on the downside. It bottomed on January 15, before commodities, including oil and emerging markets. It peaked April 21 while many of the other majors did not peak until early May.
The US dollar is being stymied near MXN18.25, the 50% retracement of drop from the February 11 high (~MXN19.45). The upper Bollinger Band is found there as well. The next retracement target is MXN18.53, but the MXN18.75 area may be more important technically.
Although oil prices pulled back ahead of the weekend, it was only the second decline in the past eight sessions. However, the price of June light sweet crude oil is up less than 30 cents here in May. Technical considerations are still constructive, but the rally, which has seen prices rise in five of the past six weeks is stretching the momentum indicators. There is initial potential toward $48 provided the $45 area offers support.
US 10-year Treasury yields slipped below 1.70% for the first time since early-April. The yield fell nearly eight basis points last week and finished nearly on its lows. The June futures firmed and finished 1/32 below 131-00. They look rich and face resistance in the 131-06 to 131-14 range. The technical indicators are not generating strong signal.
The S&P 500 lost 0.5% last week and closed at its weakest level in a month. The technical indicators warn of additional losses. These initially can extend into the 2030-2040 area, though since the 2100 area was sold, we emphasized the risk of a pullback toward 2000. Resistance may now be near 2070.
He has been covering the global capital markets in one fashion or another for more than 30 years, working at economic consulting firms and global investment banks. After 14 years as the global head of currency strategy for Brown Brothers Harriman, Chandler joined Bannockburn Global Forex, as a managing partner and chief markets strategist as of October 1, 2018.
Tags: Japanese yen,newslettersent,SPY,U.S. Retail Sales