Tag Archive: Yield Curve
Global Asset Allocation Update:
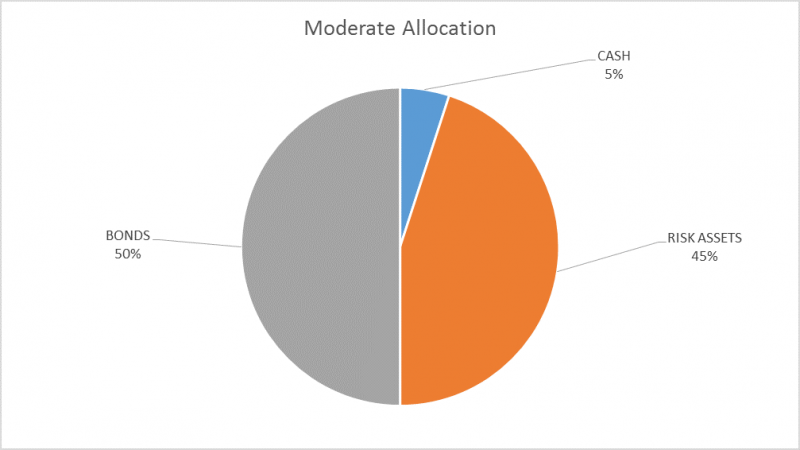
There is no change to the risk budget this month. For the moderate risk investor the allocation to bonds is 50%, risk assets 45% and cash 5%. Despite the selloff of the last week I don’t believe any portfolio action is warranted. While the overbought condition has largely been corrected now, the S&P 500 is far from the opposite condition, oversold. At the lows this morning, the S&P 500 was officially in correction territory, down 10% from the...
Read More »
Read More »
Cool Video: Bloomberg Double Feature–BOE Meeting and the Yield Curve
The Bank of England meets tomorrow. Although no one expects a move, it has little to do with the recent market volatility. The FTSE 100 is poised to snap a six-day 7%+ slide. The FTSE 250 fell for seven consecutive sessions through yesterday, shedding 5.75% in the process. The UK's 2-year yield slipped about seven basis points from last week's close to58 bp before recovering to 63 bp today, around the middle of this week's range.
Read More »
Read More »
Bi-Weekly Economic Review: Markets At Extremes
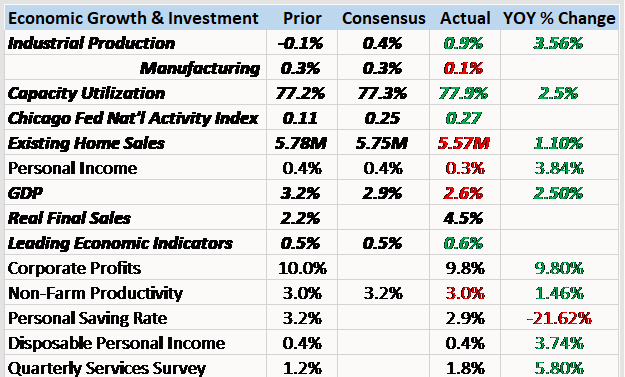
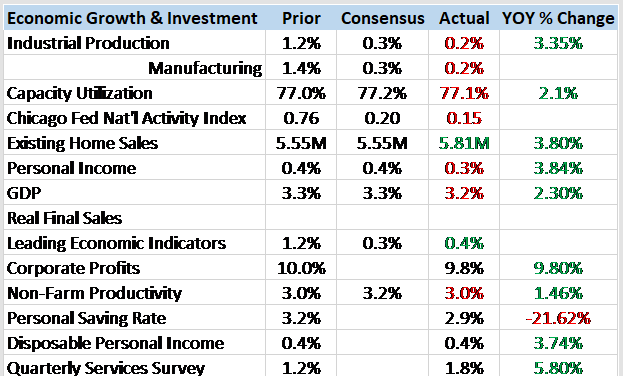
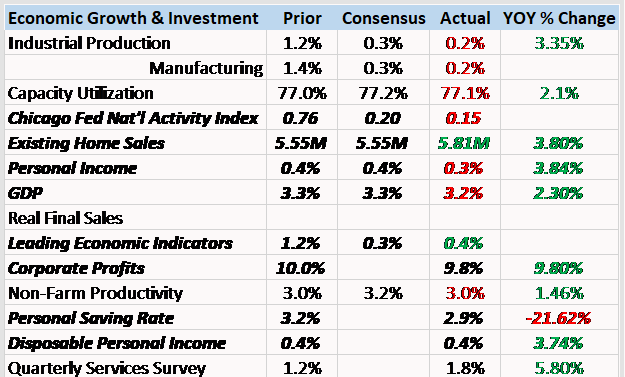
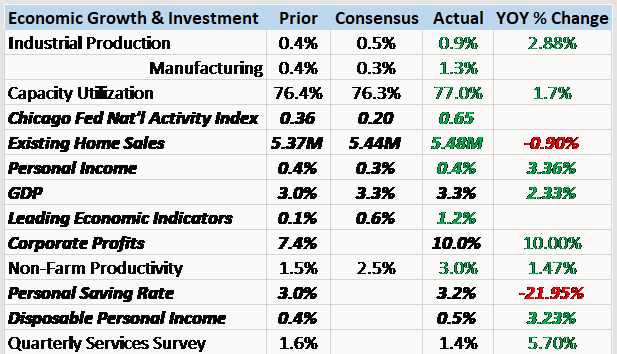
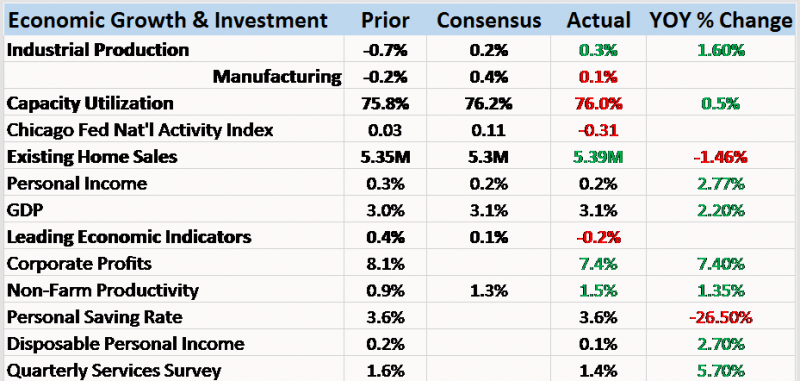
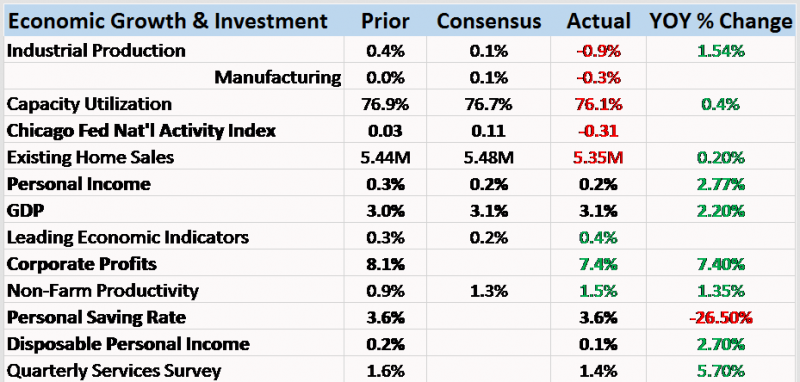
Production ended the year on a strong note but early readings from January are not as positive. The December industrial production report headline was strong at a 0.9% gain but a lot of that strength was in the mining (oil drilling) and utility sectors. Mining has actually led the way the last year as rig count has risen with drilling activity. I’d love to see our economy less dependent on the price of oil but that is what we’ve become over the...
Read More »
Read More »
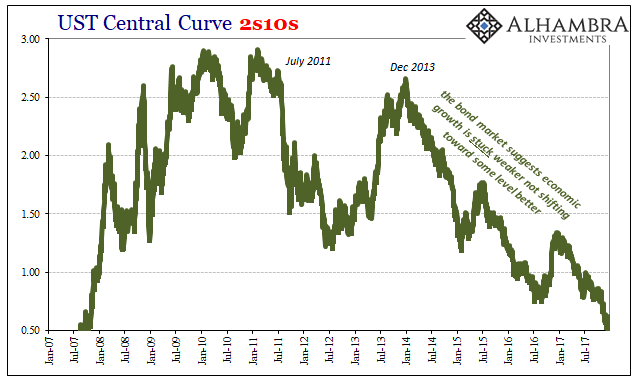
What About 2.62 percent?
There’s nothing especially special about 2.62%. It’s a level pretty much like any other, given significance by only one phrase: the highest since 2014. It sounds impressive, which is the point. But that only lasts until you remember the same thing was said not all that long ago.
Read More »
Read More »
Bi-Weekly Economic Review: A Weak Dollar Stirs A Toxic Stew
We received several employment related reports in the first two weeks of the year. The rate of growth in employment has been slowing for some time – slowly – and these reports continue that trend. The JOLTS report showed a drop in job openings, hires and quits.
Read More »
Read More »
The Great Risk of So Many Dinosaurs
The Treasury Borrowing Advisory Committee (TBAC) was established a long time ago in the maelstrom of World War II budgetary as well as wartime conflagration. That made sense. To fight all over the world, the government required creative help in figuring out how to sell an amount of bonds it hadn’t needed (in proportional terms) since the Civil War. A twenty-person committee made up of money dealer bank professionals and leaders was one of the few...
Read More »
Read More »
Global Asset Allocation Update
There is no change to the risk budget this month. For the moderate risk investor the allocation to bonds is 50%, risk assets 45% and cash 5%. The extreme overbought condition of the US stock market persists so I will continue to hold a modest amount of cash. There are some minor changes within the portfolios but the overall allocation is unchanged.
Read More »
Read More »
Bi-Weekly Economic Review: Housing Market Accelerates
The economy ended 2017 with current growth just slightly above trend. In general the reports of the last two weeks of the year were pretty good with housing a standout performer going into the new year. We are still trying to get past the impact – positive and negative – from the hurricanes a few months ago though so it is probably prudent to wait for more evidence before making any definitive pronouncements about the economy.
Read More »
Read More »
Bi-Weekly Economic Review: Animal Spirits Haunt The Market
The economic data over the last two weeks continued the better than expected trend. Some of the data was quite good and makes one wonder if maybe, just maybe, we are finally ready to break out of the economic doldrums. Is it possible that all that new normal, secular stagnation stuff was just a lack of animal spirits?
Read More »
Read More »
Three Years Ago QE, Last Year It Was China, Now It’s Taxes
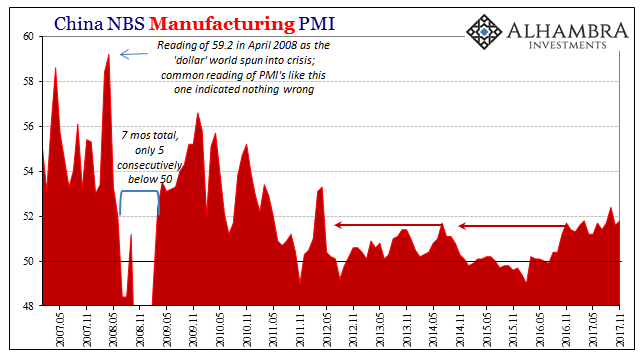
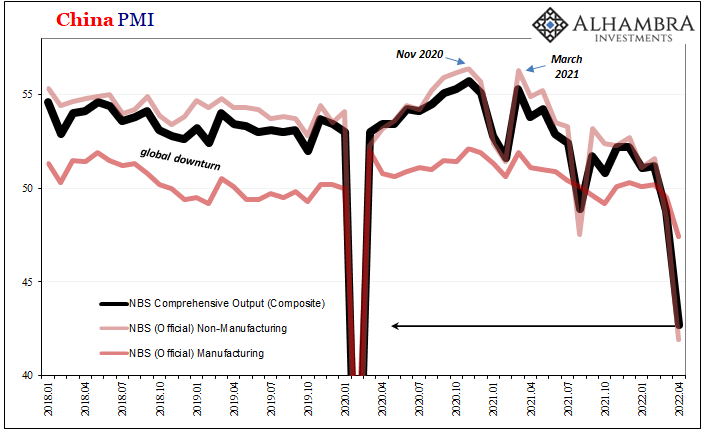
China’s National Bureau of Statistics reported last week that the official manufacturing PMI for that country rose from 51.6 in October to 51.8 in November. Since “analysts” were expecting 51.4 (Reuters poll of Economists) it was taken as a positive sign. The same was largely true for the official non-manufacturing PMI, rising like its counterpart here from 54.3 the month prior to 54.8 last month.
Read More »
Read More »
Bi-Weekly Economic Review: Who You Gonna Believe?
We’ve had a pretty good run of data recently and with the tax bill passing the Senate one would expect to see markets react positively, to reflect renewed optimism about economic growth. We have improving economic data on pretty much a global basis. It isn’t a boom by any stretch of the imagination but there is no doubt that the rate of change has recently been more positive.
Read More »
Read More »
Global Asset Allocation Update
There is no change to the risk budget this month. For the moderate risk investor the allocation to bonds is 50%, risk assets 45% and cash 5%. The extreme overbought condition of the US stock market did not correct since the last update and so I will continue to hold a modest amount of cash.
Read More »
Read More »
Bi-Weekly Economic Review: A Whirlwind of Data
The economic data of the last two weeks was generally better than expected, the Citigroup Economic Surprise index near the highs of the year. Still, as I’ve warned repeatedly over the last few years, better than expected should not be confused with good. We go through mini-cycles all the time, the economy ebbing and flowing through the course of a business cycle.
Read More »
Read More »
Bi-Weekly Economic Review: Gridlock & The Status Quo
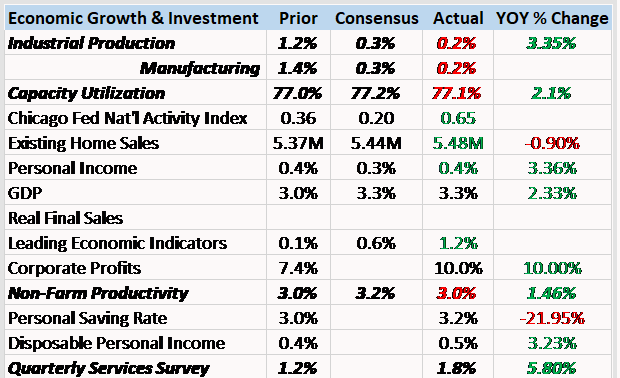
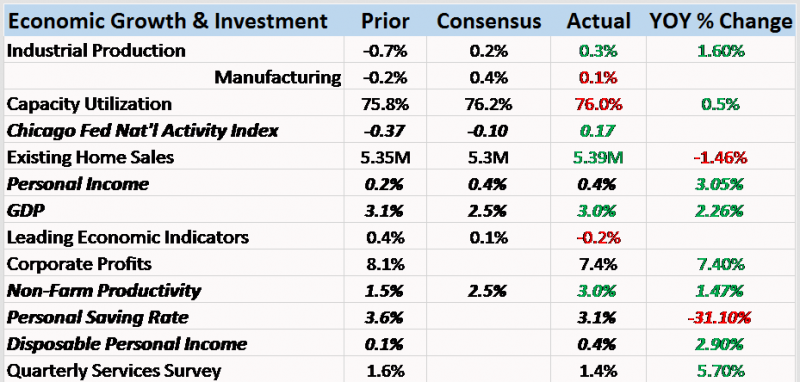
The good news is that the economy just printed its second consecutive quarter of 3% growth, a feat not accomplished since Q2 and Q3 2014. The bad news is that the growth spurt in 2014 was better, quantitatively and qualitatively. Those two quarters produced gains of 4.6% and 5.2% (annualized) in GDP, much better than the most recent 3.1% and 3% prints of Q2 and Q3 2017.
Read More »
Read More »
Global Asset Allocation Update
The risk budget this month shifts slightly as we add cash to the portfolio. For the moderate risk investor the allocation to bonds is unchanged at 50%, risk assets are reduced to 45% and cash is raised to 5%. The changes this month are modest and may prove temporary but I felt a move to reduce risk was prudent given signs of exuberance – rational, irrational or otherwise.
Read More »
Read More »
Bonds And Soft Chinese Data
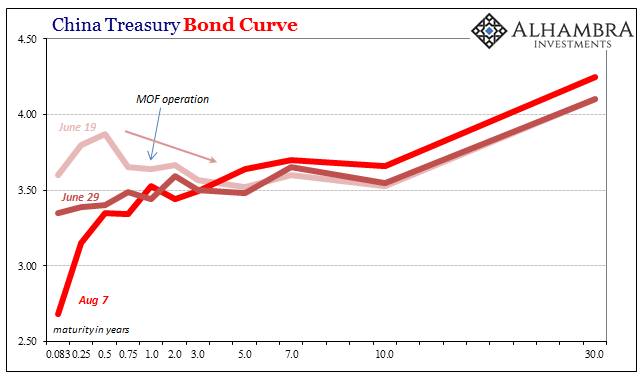
Back in June, China’s federal bond yield curve inverted. Ahead of mid-year bank checks, short-term govvies sold off as longer bonds continued to be bought. It was for some a rotation, for others a reflection of money rates threatening to spiral out of control. On June 19, for example, the 6-month federal security yielded 3.87% compared to a yield of 3.525% for the 10-year.
Read More »
Read More »
Bi-Weekly Economic Review: Yawn
When I wrote the update two weeks ago I said that we might be nearing the point of maximum optimism. Apparently, there is another gear for optimism in this market as stocks have just continued to slowly but surely reach for the sky.
Read More »
Read More »
Is This The Best Way To Bet On The Fed Losing Control Of The Bond Market?
Authored by Kevin Muir via The Macro Tourist blog, Lately, one of my biggest duds of a call has been for the yield curve to steepen. Sure, I have all sorts of fancy reasons why it should steepen, but reality glares back at me in black and white on my P&L run. Sometimes fighting with the market is an exercise in futility.
Read More »
Read More »
Bi-Weekly Economic Review: Maximum Optimism?
The economic reports of the last two weeks were generally of a more positive tone. The majority of reports were better than expected although it must be noted that many of those reports were of the sentiment variety, reflecting optimism about the future that may or may not prove warranted. Markets have certainly responded to the dreams of tax reform dancing in investors’ heads with US stock markets providing a steady stream of all time highs, bond...
Read More »
Read More »
Dollar & Stocks Jump; Bonds & Bullion Dump In Lowest Volatility September Ever
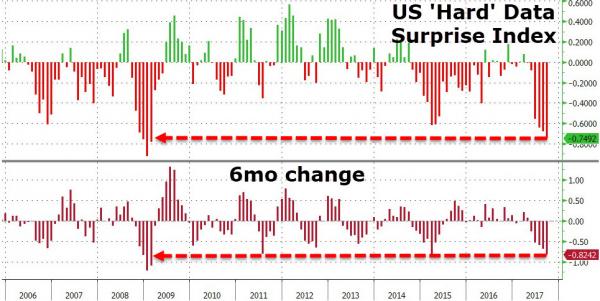
It has now been 318 trading days since the S&P 500 suffered a 5% drawdown - the 4th-longest streak since 1928... So everything is awesome...BUT...US 'hard' economic data has not been this weak (and seen the biggest drop) since Feb 2009...Q3 Was a Roller-Coaster...Q3 was the 8th straight quarterly gain in a row for The Dow - the longest streak since Q3 1997.
Read More »
Read More »


