Joseph Y. Calhoun
My articles My siteAbout meMy videosMy books
Follow on:LinkedINTwitterSeeking AlphaAmazon
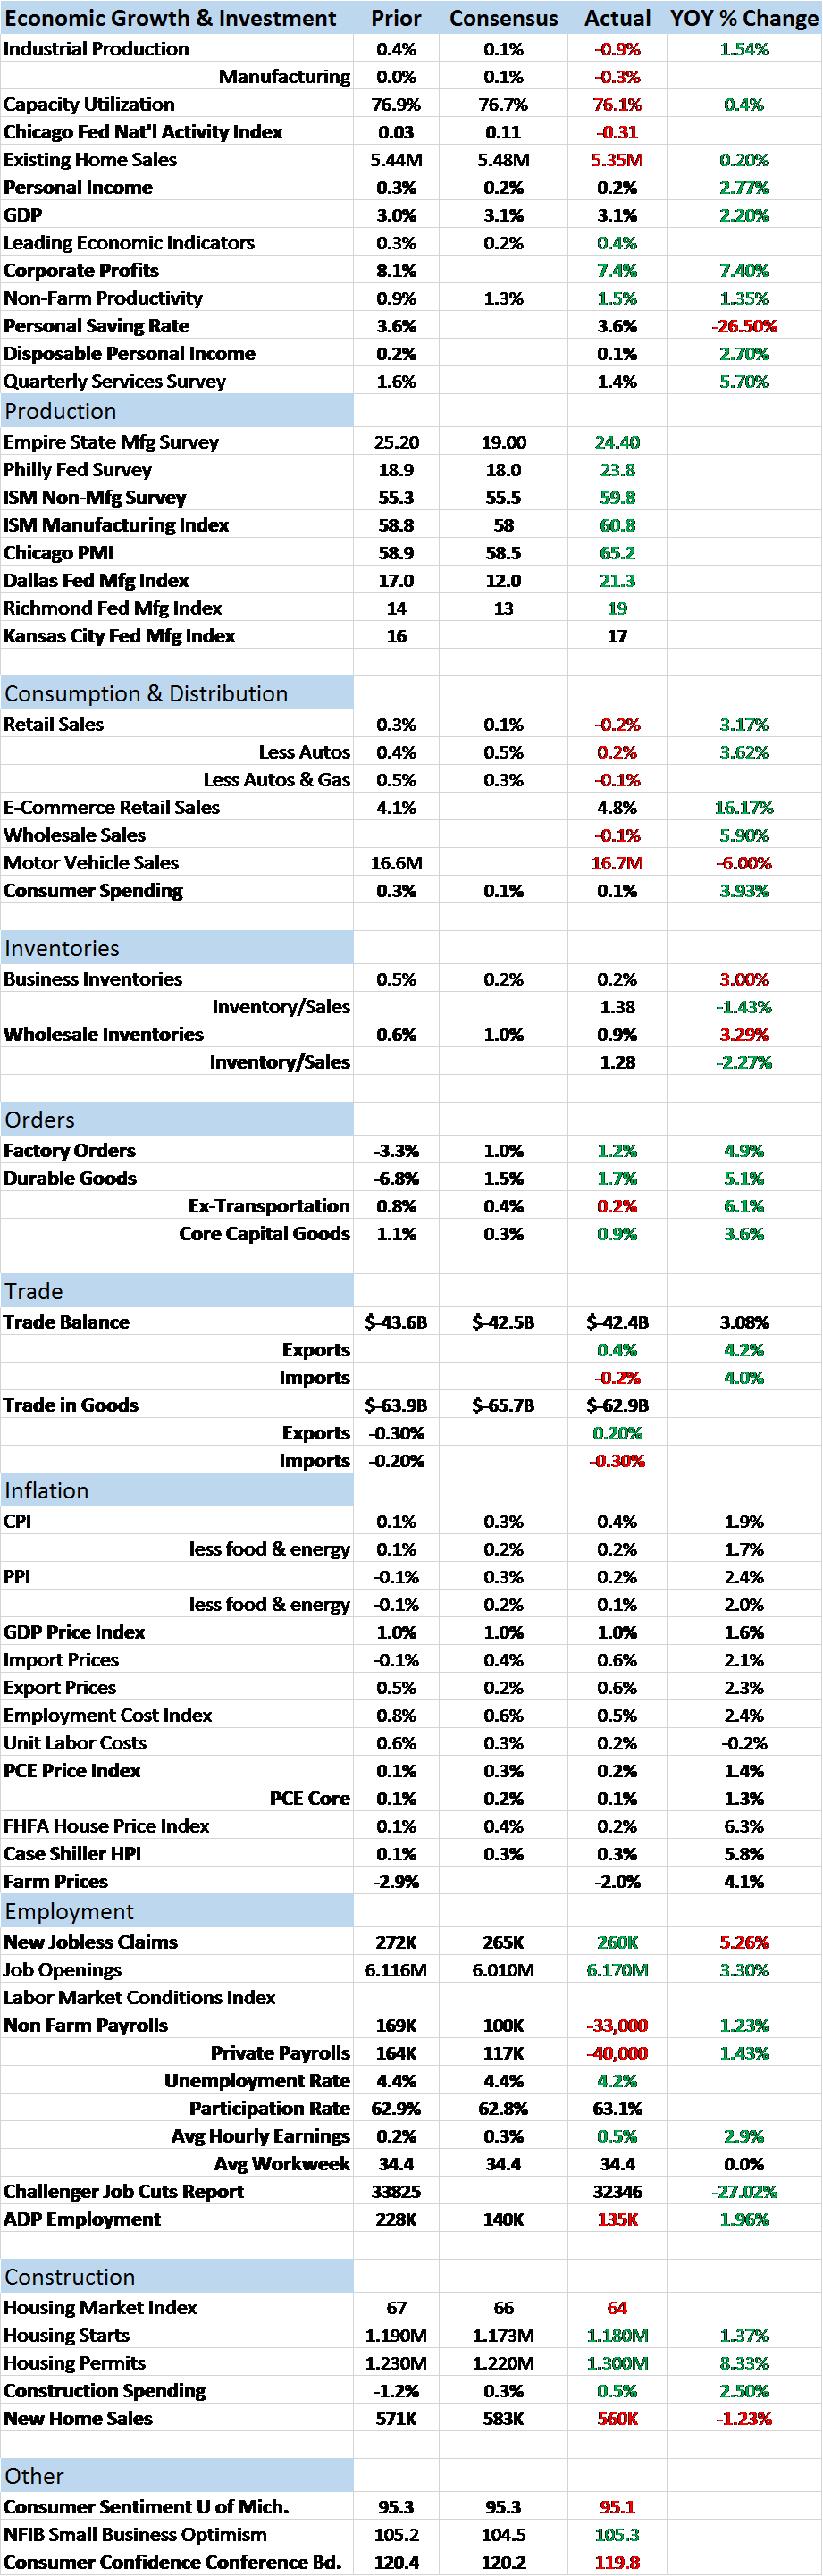
| The economic reports of the last two weeks were generally of a more positive tone. The majority of reports were better than expected although it must be noted that many of those reports were of the sentiment variety, reflecting optimism about the future that may or may not prove warranted. Markets have certainly responded to the dreams of tax reform dancing in investors’ heads with US stock markets providing a steady stream of all time highs, bond yields rising and the dollar coming off the mat.
Over the last month, small cap stocks (Russell 2000) are up nearly 8%, the 10 year TIPS yield has nearly doubled and the 10 year Treasury yield is up 24 basis points. All that sounds very impressive and for small cap stocks it really is. The Russell 2000 is up 22.5% over the last year and sits at an all time high as investors have apparently decided that tax reform will benefit small domestic firms – a lot. One does wonder what rate of growth this market is pricing in with a P/E approaching triple digits. Other markets have moved too as noted above but the movement has been within the same ranges of the last few years and really indicate little change in growth expectations overall. The 10 year TIPS yield is well within the range that has prevailed since 2013 and only rose 6 basis points since the last update two weeks ago. |
US 10 Year Treasury Inflation, Jan 2012 - 2017(see more posts on U.S. Treasuries, ) - Click to enlarge |
| The nominal 10 year Treasury is also well within its recent range and up just about 9 basis points over the last two weeks. |
US 10 Year Treasury Yield, March - Oct 2017(see more posts on U.S. Treasuries, )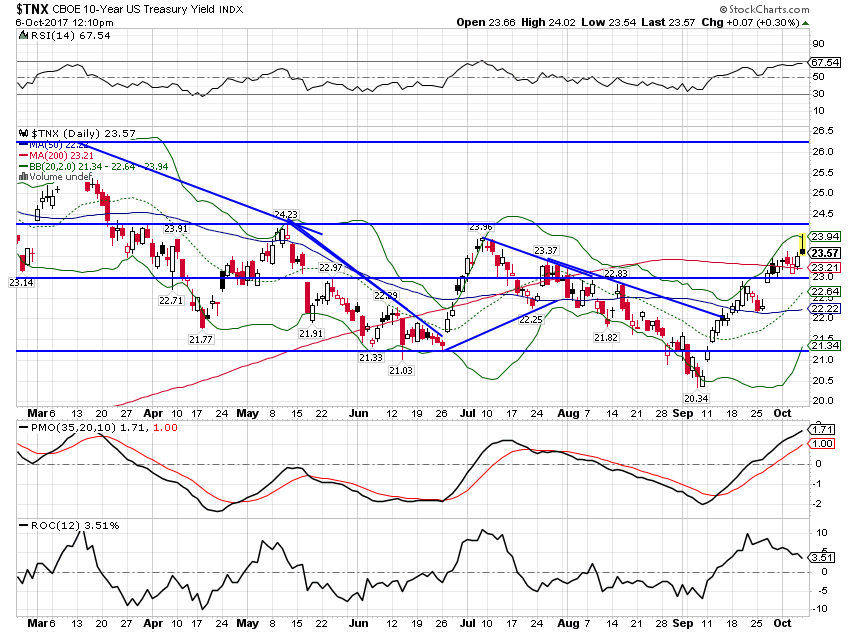 - Click to enlarge |
| The dollar for its part, did manage to stop falling but that is a far cry from anything resembling a sustainable rally. |
US Dollar Index, Feb - Oct 2017(see more posts on U.S. Dollar Index, )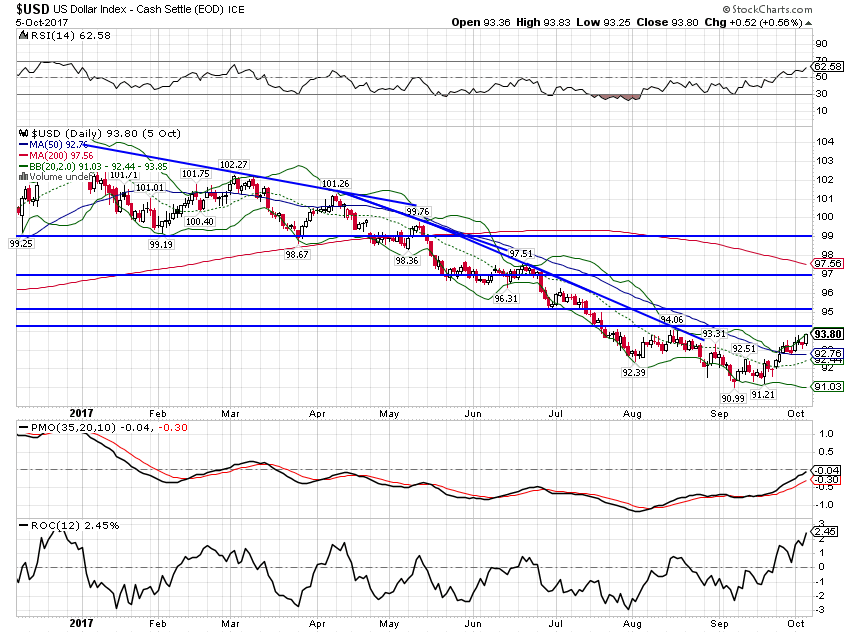 - Click to enlarge |
| I can’t tell you for sure what is driving the stock market exuberance but exuberant it is. Sentiment measures I check regularly are mostly at wildly bullish levels. Puts are cheap and everyone is short the VIX even as it scrapes multi-decade lows. The CNN Greed/Fear index is at 93 with 100 as greedy as it gets. Investor’s Intelligence, Consensus and Market Vane all show a plethora of bulls and near complete lack of bears. If you are bullish here you sure can’t claim to be a contrarian.
And US stocks are far from alone. European high yield bonds trade at yields less than US Treasuries, admittedly not a great comparison but unnerving a bit nonetheless. Bitcoin and other cryptocurrencies are probably beyond exuberant, well into the mania phase, with Paris Hilton and Ghostface Killah recently sponsoring – or backing or pimping or whatever term seems appropriate – Initial Coin Offerings for something little understood by either buyer or seller. One thing the Wu Tang Clan – of which Mr. Killah claims membership – does seem to understand quite well is the impact of limited supply and adoring demand on price. The economic releases of the last two weeks that were sentiment based – regional Fed surveys, ISM surveys, etc. – also show a decided optimism about the future. One assumes – or at least the financial press does – that this optimism is rooted in expectations of imminent tax reform but there is really no way to know what motivates traders and investors as a group. There are some signs of improved economic performance and it may be no more than that that is driving the bond and currency markets. As for stocks, investors urgent desire to buy one of the most expensive markets in history is hard to understand and requires contortions worthy of a circus performer to justify. Earnings have been climbing of late but like a lot of things, just back to levels of a few years ago (2014 for S&P 500 earnings). Stock prices on the other hand are much higher now than they were then, a multiple expansion based on…nothing that I can tell. The non sentiment data was better but still, in most cases, not so much that it changes the outlook for growth significantly. Durable goods and factory orders were both reported up about 5% year over year, not a great reading but better than it has been lately. Of more relevance perhaps is that orders are no higher today than they were in June of 2013, more than four years ago. So yes, growth has picked up but we are still stuck in the same rut we’ve been in for years. Wholesale inventories did offer some hope for the future though, rising 0.9% for the month while sales rose a more robust 1.7%, dropping the inventory/sales ratio to 1.28 (a still elevated level though). Year over year wholesale sales were up 7.2%. Some part of every release the past two weeks though must be attributed to the two hurricanes which recently hit Texas and Florida. The wholesale numbers were no doubt skewed by autos as dealers stock up for replacement of flooded and totaled cars in those areas. Similarly, I suppose, the income and spending numbers were quite punk but having bought nothing but ice for a week after Irma, I can attest to the fact that consumption in South Florida at least was not normal. Likewise the strong ISM numbers, manufacturing and non, that were distorted higher by a lengthening of delivery times that was directly related to disruptions from the hurricanes rather than excess demand. And of course, everyone blames today’s weak employment report on the hurricanes and I’m sure that is true to one degree or another. How much can be blamed on the hurricanes? Hard to say but the effect should be short lived so maybe we’ll find out next month. It is also curious that there was no apparent impact on the Household Survey which was much stronger than the Establishment version. Again, I don’t know which one is giving a true picture – maybe neither – but there’s something for the bears and bulls as there always seems to be in this blah economy. The yield curve offers a more sober view of the economy than the stock market, still stuck near the narrowest of the cycle, but steeper by 6 basis points since the last update. |
US 10 Year Treasury Constant Maturity, 2008 - 2017(see more posts on U.S. Treasuries, )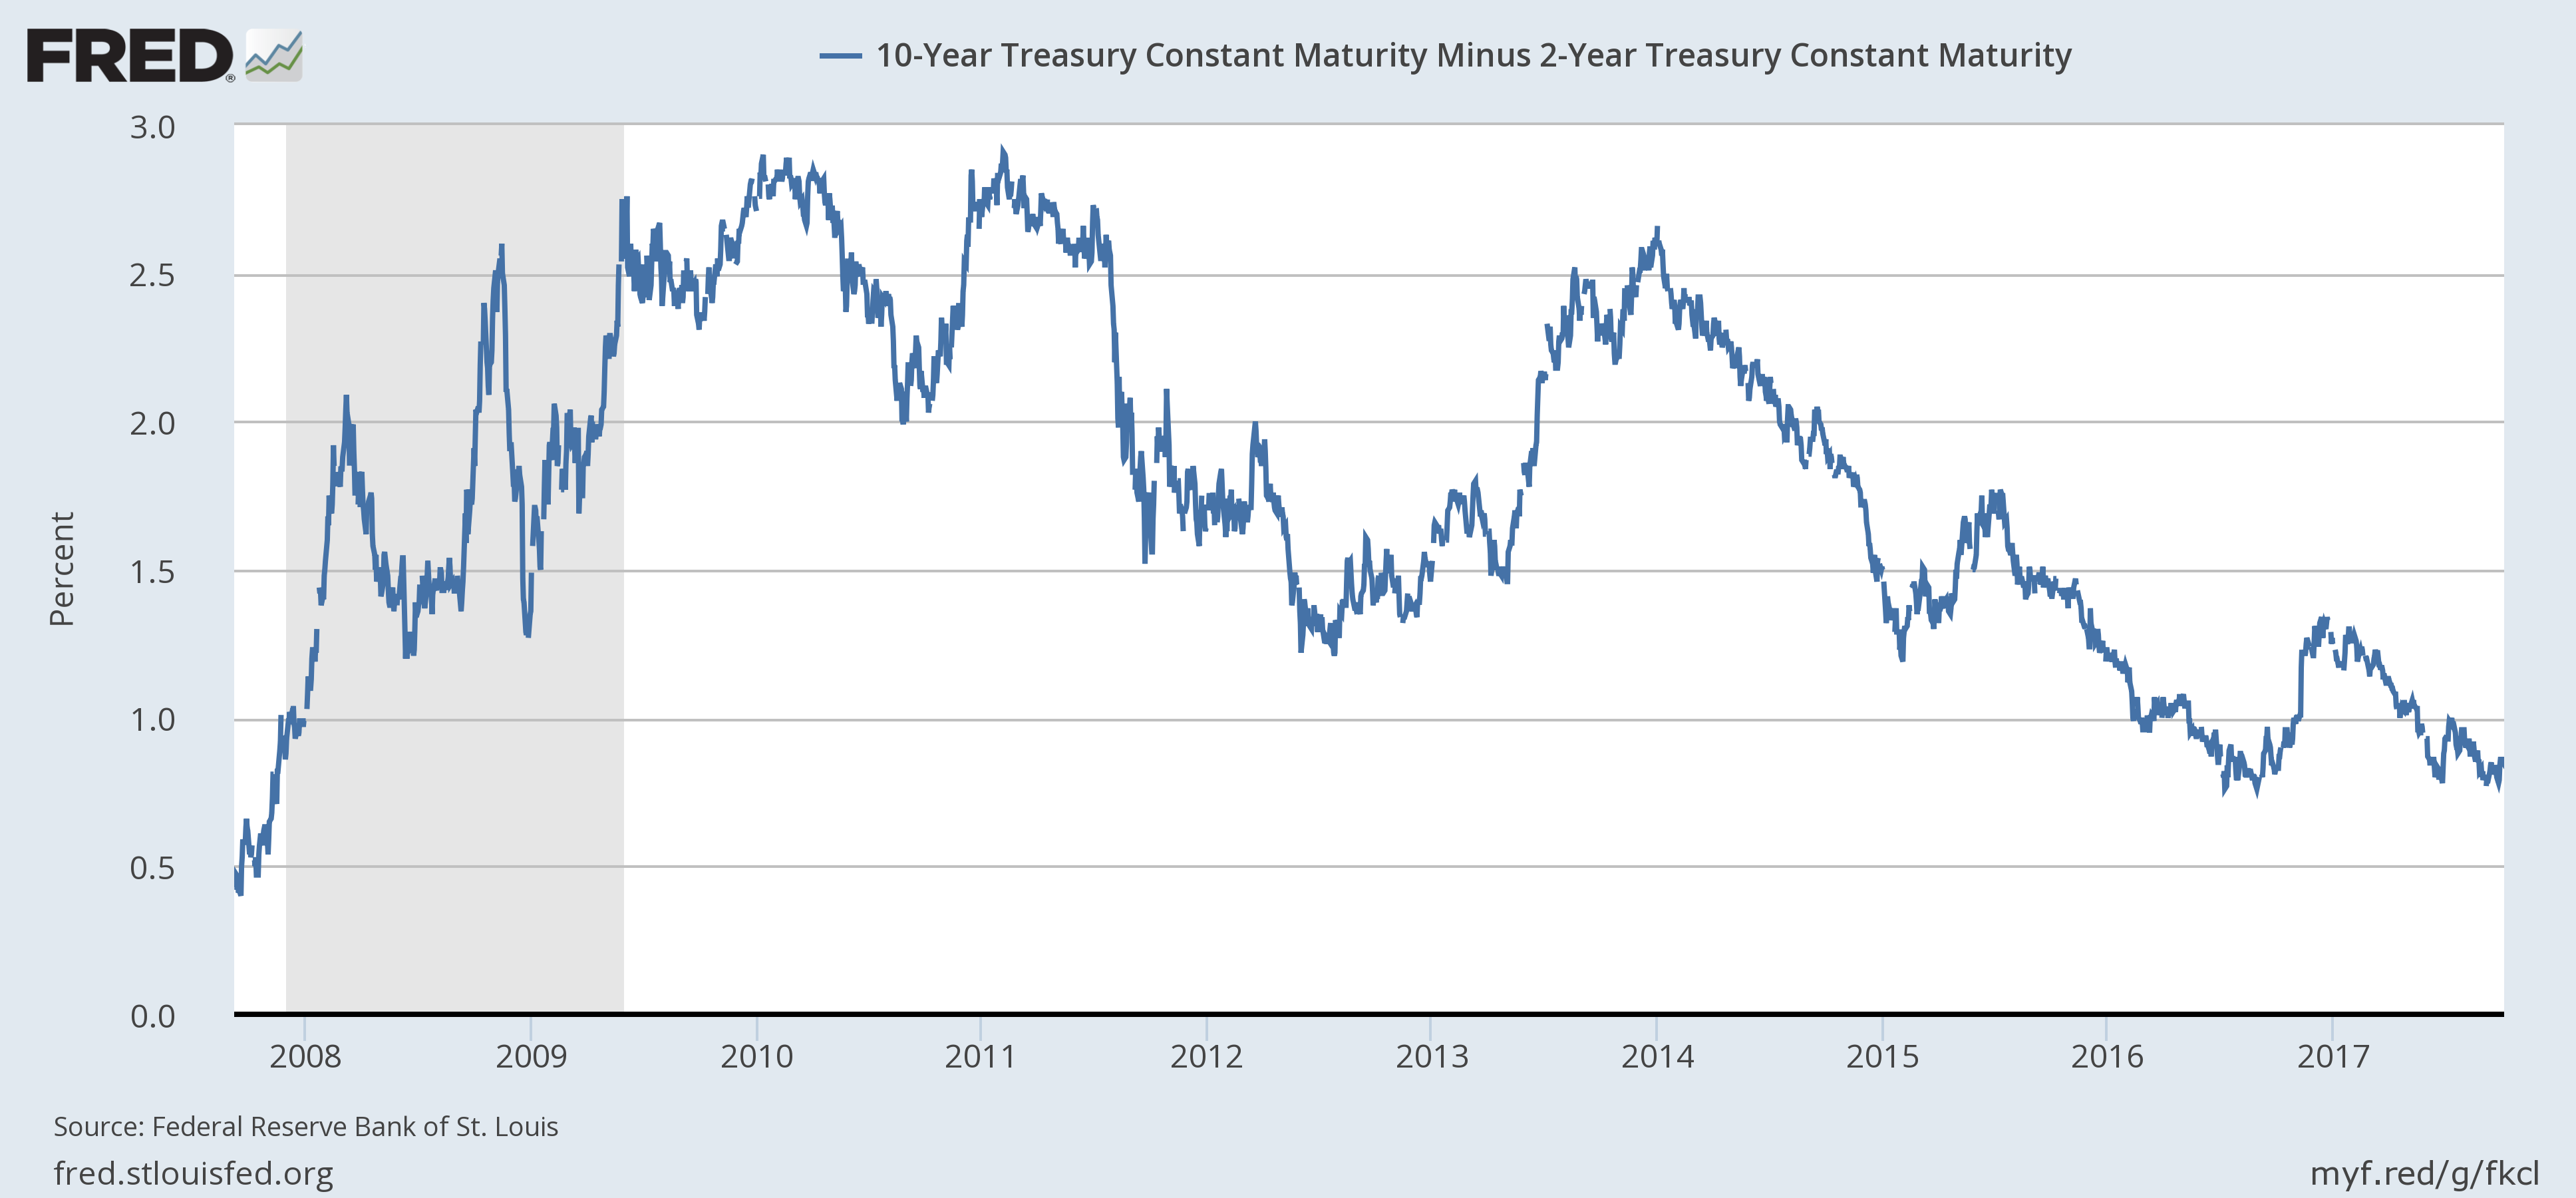 - Click to enlarge |
| The junk bond market is just as exuberant as the stock market with spreads now at their narrowest of this cycle and down another 12 basis points over the last two weeks. |
US BofA Merril Lynch, 1998 - 2016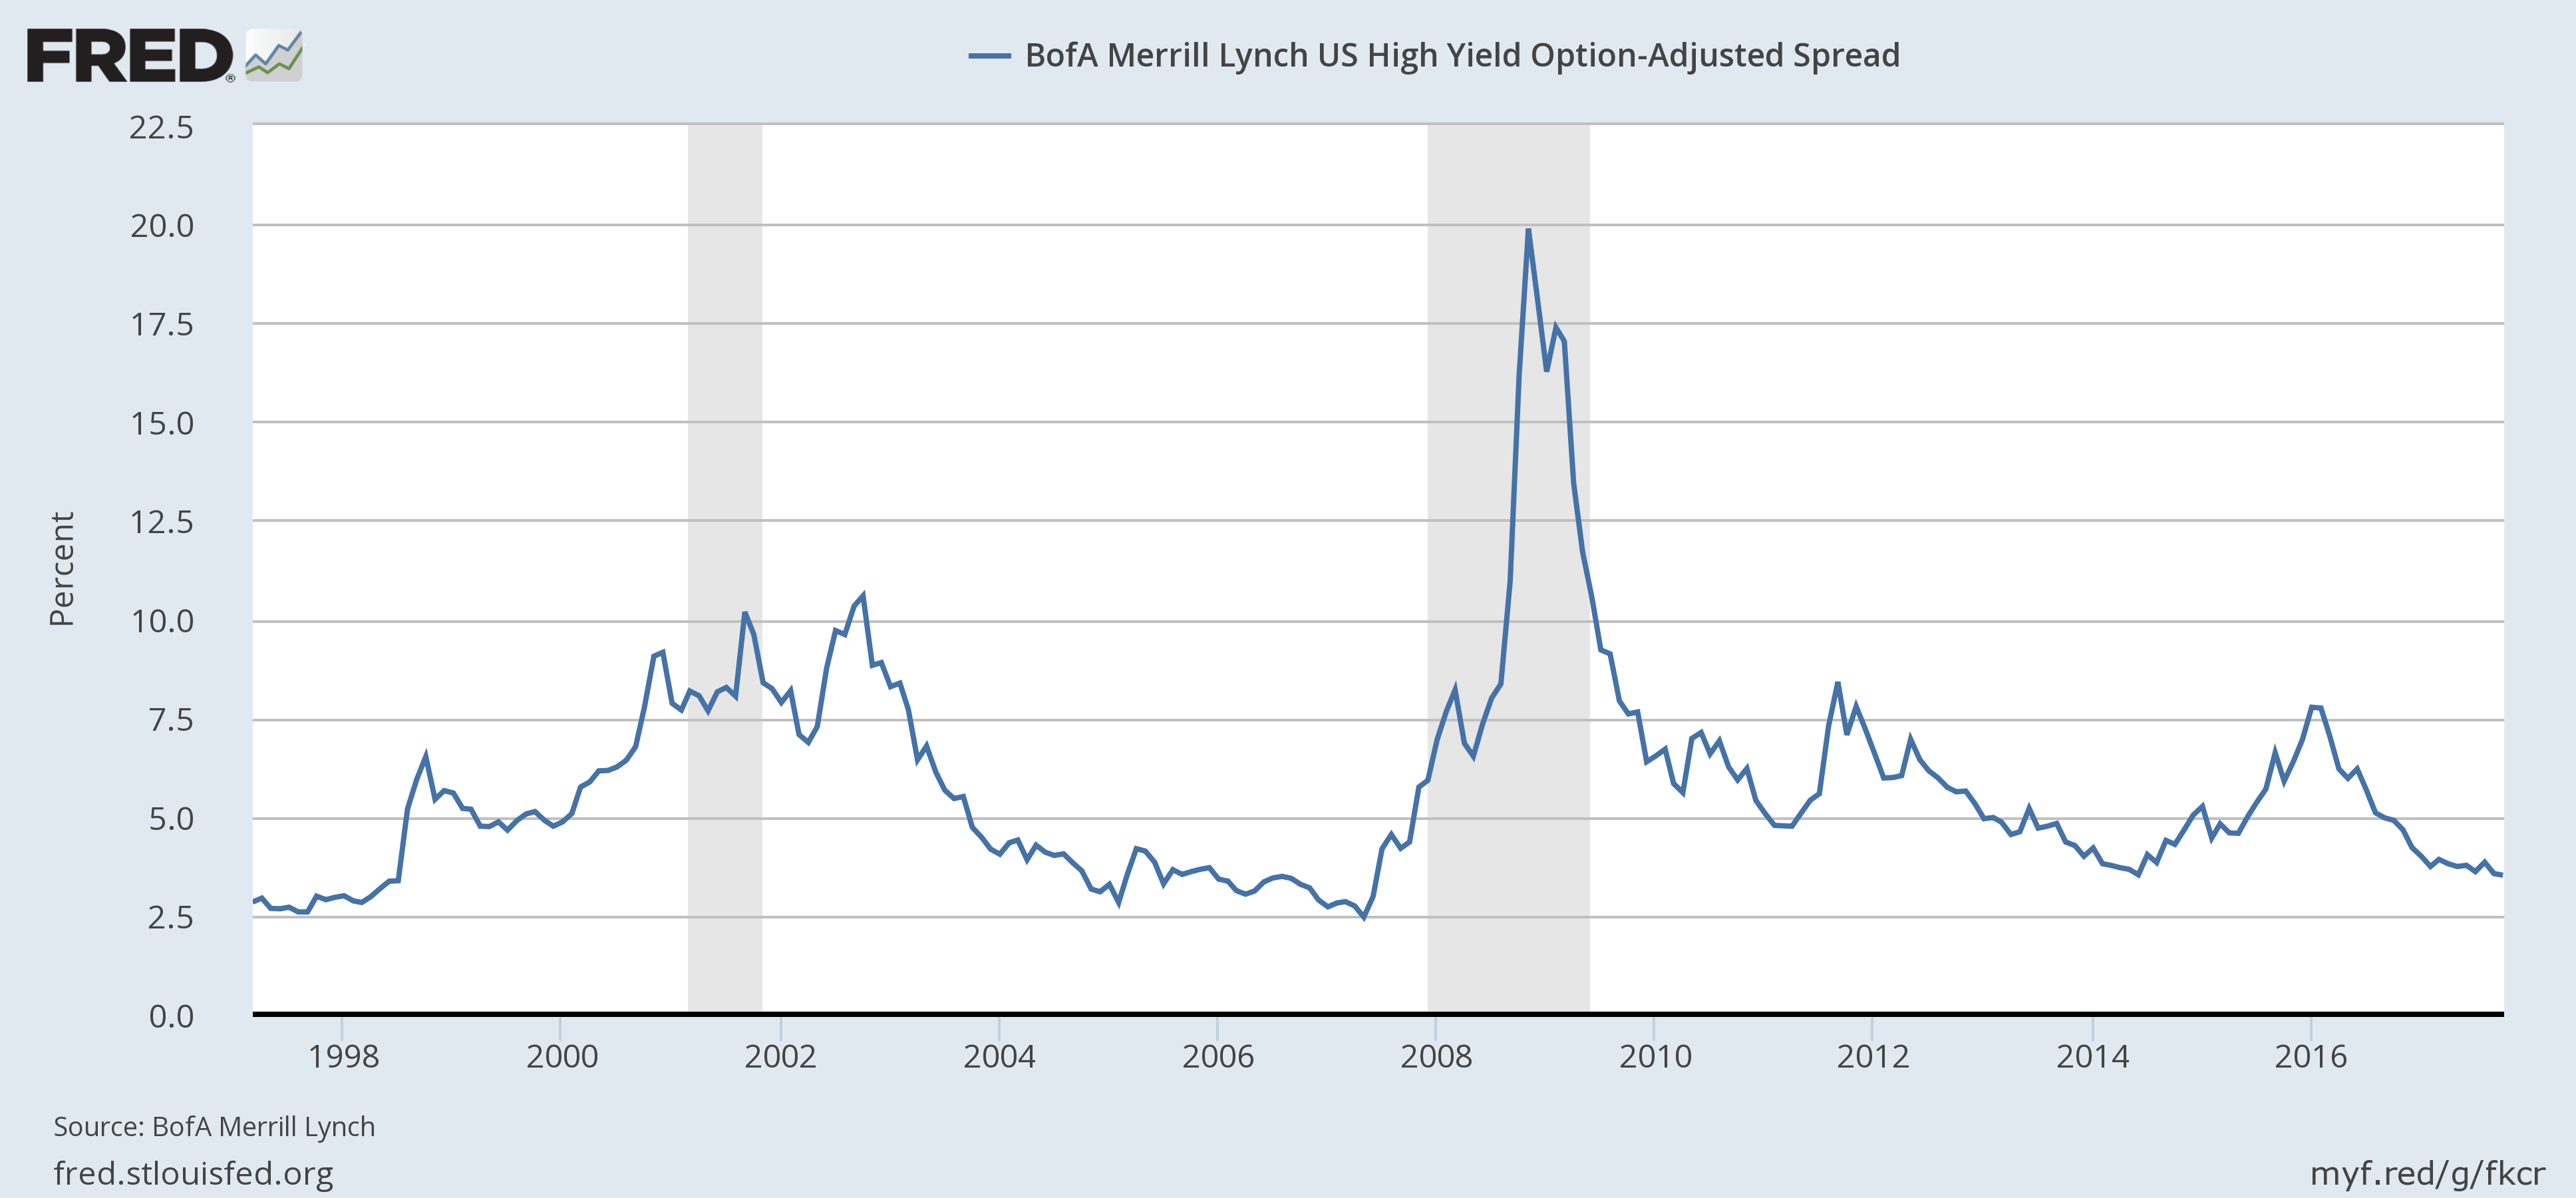 - Click to enlarge |
| Gold, meanwhile, reflecting the improved growth prospects, continue to pull back. It is still up quite nicely on the year however so, yes, growth expectations have improved but not by all that much. |
Gold Daily, Apr - Oct 2017(see more posts on Gold, )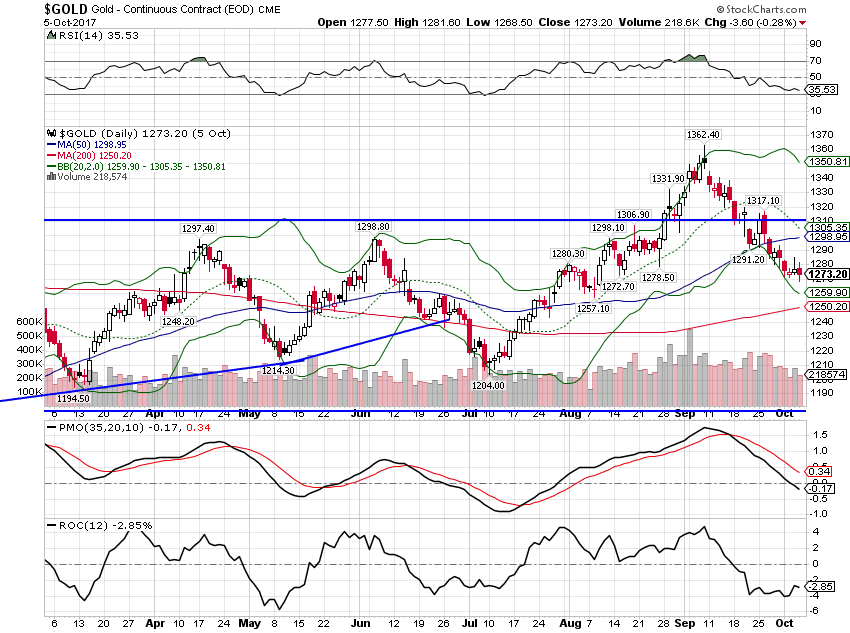 - Click to enlarge |
| More general commodities are holding up quite well considering the recent firming of the dollar index. An indication that maybe global growth is indeed picking up? |
Bloomberg Commodity Index, March - Oct 2017(see more posts on Bloomberg Commodity, )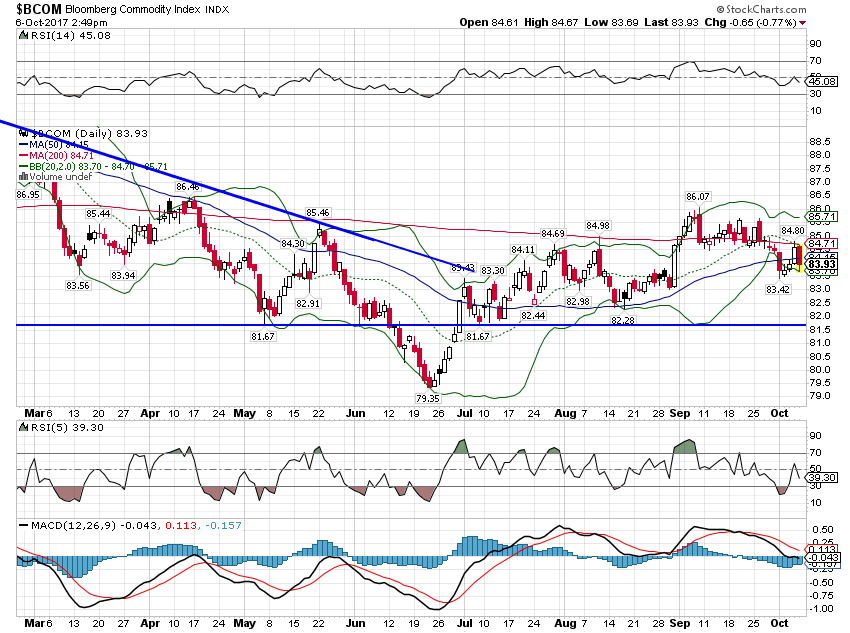 - Click to enlarge |
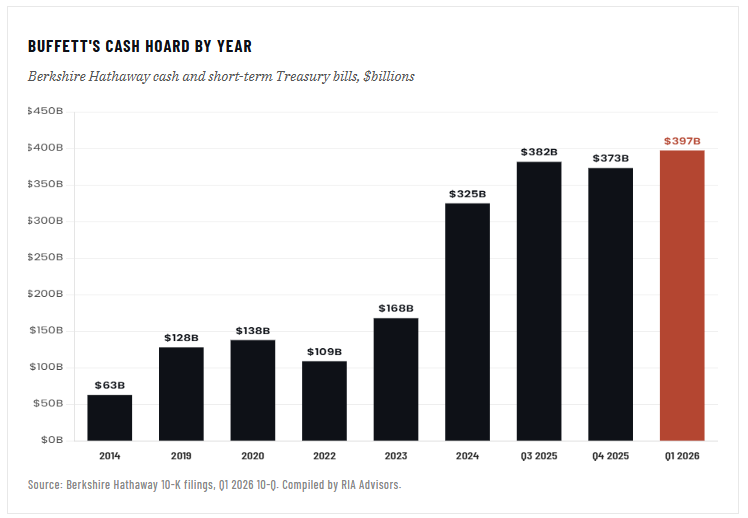
The outlook for the economy has not changed significantly but stock markets – and some other markets – seem to have succumbed to a bout of societal greed. Even some of the staunch bears appear to be throwing in the towel, now looking for a “final” melt-up to put a top on this strangest of bull markets. Warren Buffet, meanwhile, goes on CNBC to talk his book and says stocks are reasonably priced given interest rates. Of course, in the recent past he has called the bond market a bubble so that confuses the issue somewhat. Is he saying that the bond bubble justifies the current level of the stock market? If so, does that mean stocks are in a bubble too? For the answer to that question I would just point you to Berkshire Hathaway’s balance sheet where resides the largest pile of cash Mr. Buffet has ever amassed, a neat $100 billion.
Sir John Templeton, one of the greatest investors of the last century, said that one should buy at the point of maximum pessimism. Like many investors, he struggled though with when to sell. He never said, as far as I know, that one should sell at the point of maximum optimism but Buffet says one should be fearful when everyone is greedy which amounts to the same thing. If that is true, you probably ought to be shivering in your boots right now.
Tags: Alhambra Research,Bi-Weekly Economic Review,Bloomberg Commodity,Bonds,commodities,credit spreads,currencies,dollar,economic growth,economy,Gold,Investing,Market Sentiment,Markets,newslettersent,stocks,TIPS,treasuries,U.S. Dollar Index,U.S. Treasuries,Warren Buffett,Yield Curve