Joseph Y. Calhoun
My articles My siteAbout meMy videosMy books
Follow on:LinkedINTwitterSeeking AlphaAmazon
The economic data of the last two weeks was generally better than expected, the Citigroup Economic Surprise index near the highs of the year. Still, as I’ve warned repeatedly over the last few years, better than expected should not be confused with good. We go through mini-cycles all the time, the economy ebbing and flowing through the course of a business cycle. This being a particularly long half cycle, it has had more than its fair share of ups and downs but these mini up and down cycles within the larger cycle are nothing unusual. We are now in an up cycle and the data reflects that. But context is everything and as I keep saying with every one of these reports, not much has changed.
| This mini up cycle has been extended by the bounce back from the two hurricanes that hit earlier in the fall. How much of the recently better data is due to hurricane effects? I don’t know of any way to quantify it but when in doubt I always fall back on market based indicators. As I discussed in the update two weeks ago, the stock market is anticipating a future so bright we’ll have to all wear rose colored glasses so ignore that for a minute. All the other indicators we watch are not nearly as exuberant about the prospects for a sustained upturn in growth. The Fed may welcome the better data to justify their preferred course of action but evidence of a robust economy is hard to find outside the stock market.
The best indicator of future growth is the yield curve. That is backed up by a plethora of research and historic observation. And today it is telling us the same thing it has been telling us for the last several years. The spread between 10 year and 2 year Treasury note yields continued to fall since the last update, now at 62 basis points. That is a 9 basis point fall in two weeks and the curve is now at its flattest of this cycle. That doesn’t mean we are on the verge of recession, just that we are moving through the business cycle, drawing closer to its inevitable end. It also seems to be saying that either the tax cuts being much debated will not happen or worse that they will have no positive impact. |
US 10 Year Treasury Constant Maturity, 1998 - 2017 - Click to enlarge |
| The driving force behind the flattening curve is the relentless rise in the 2 year note yield. That is a reflection of expectations regarding monetary policy, an acknowledgment that the new Fed chairman is likely to continue the path of the old one. The 10 year note yield, on the other hand, is not rising and is a reflection of market expectations regarding nominal growth. This is what Alan Greenspan referred to as a “conundrum” by which he meant “I’m right and the market is wrong”. Turned out there was something to that wisdom of crowds thing and Greenspan was the one proven wrong by subsequent events. We have the same condition today and I’d suggest that it means exactly the same thing. Will the Fed be right about future growth and inflation? Or will the market prove prescient once again? I know which side I’d bet on.
The 10 year yield was up since the last update but the one basis point rise signifies…nothing. |
US 10 Year Treasury Constant Maturity Rate, 2000 - 2017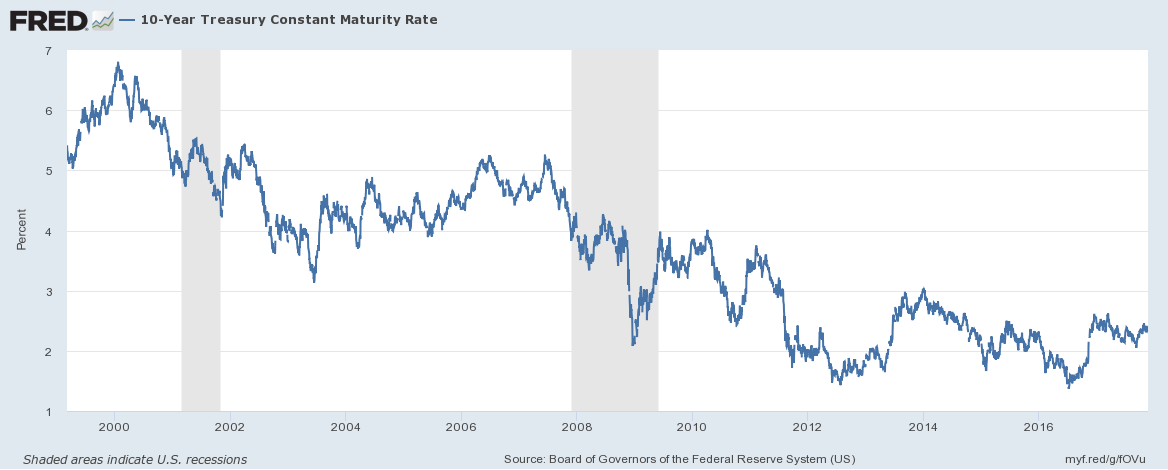 - Click to enlarge |
| Real interest rates – an indication of real growth expectations – were also quiet, up just four basis points since the last update. |
US 10 Year Treasury Inflation, Jan 2013 - Jul 2017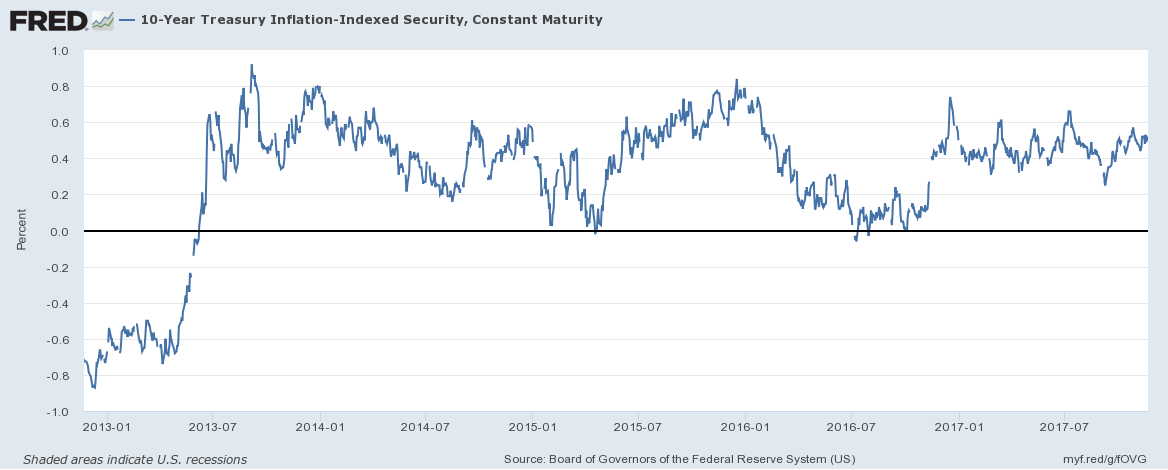 - Click to enlarge |
| The 10 year TIPS yield is slightly closer to the top of the range it has traded in since mid-2013 but the reality is that growth expectations are pretty firmly anchored here in the meh range.
Credit spreads did show some life over the fortnight but not in a positive direction. Spreads widened by 24 basis points, an indication of rising risk aversion. It is nothing severe yet (and spreads narrowed over the last two days) but bears watching. If we end the month with spreads 10% wider, it may well warrant a portfolio change. |
US BofA Merrill Lynch High Yield Option, Jan 2013 - Jul 2017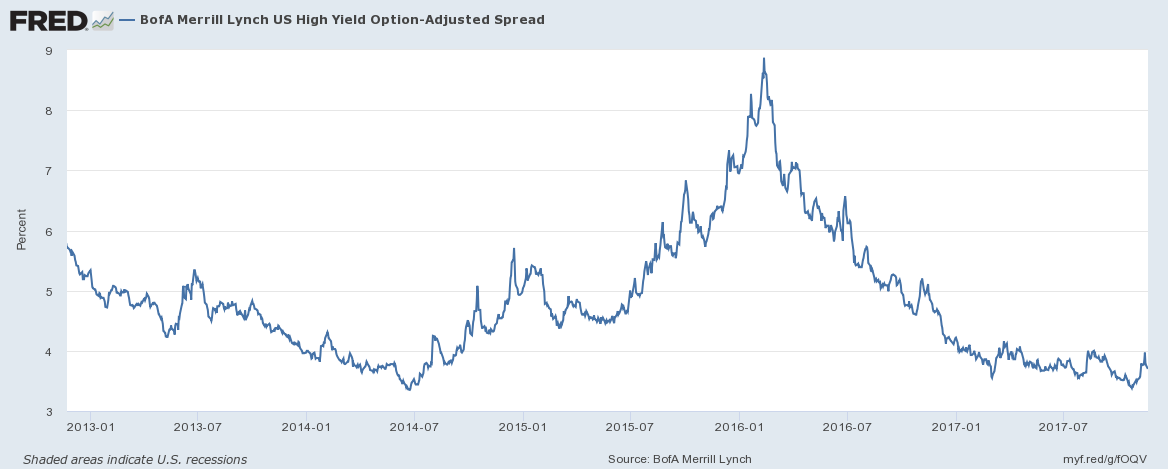 - Click to enlarge |
| The dollar index shows no sign of US growth accelerating relative to the rest of the world. The path of least resistance still seems lower from here. The rest of the global economy is on a different schedule than the US, Europe seemingly earlier in the cycle. Emerging markets are still recovering from the strong dollar episode and Japan continues to surprise to the upside. Obviously, I guess, some of how this turns out depends on the US and China but capital flows are arguably more important and as long as the President prefers a weaker dollar there seems little reason to prefer them over Euros or Yen or EM currencies. |
US Dollar Index, Feb - Nov 2017(see more posts on U.S. Dollar Index, )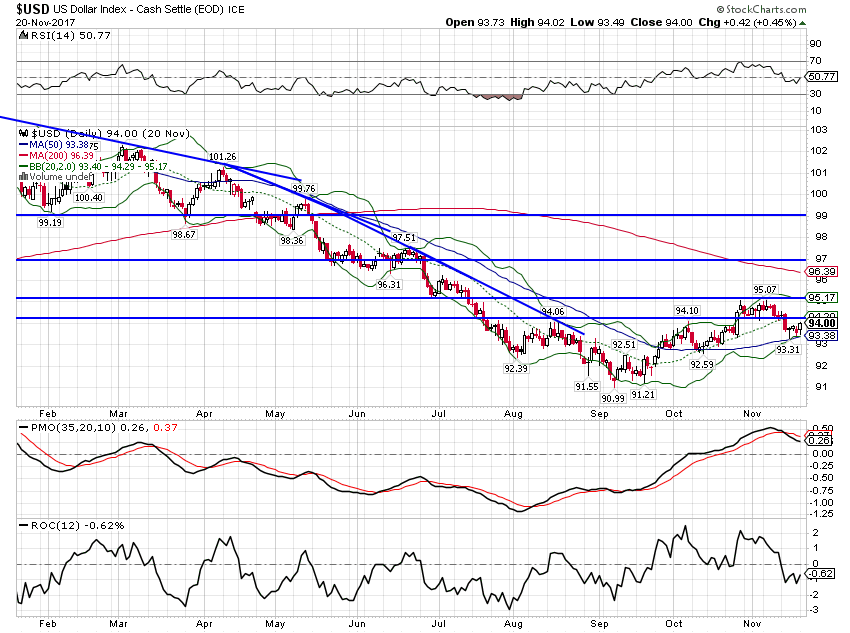 - Click to enlarge |
| Gold was up a bit over $10, continuing to confirm the weaker dollar and weak growth expectations. |
Gold Daily, May - Nov 2017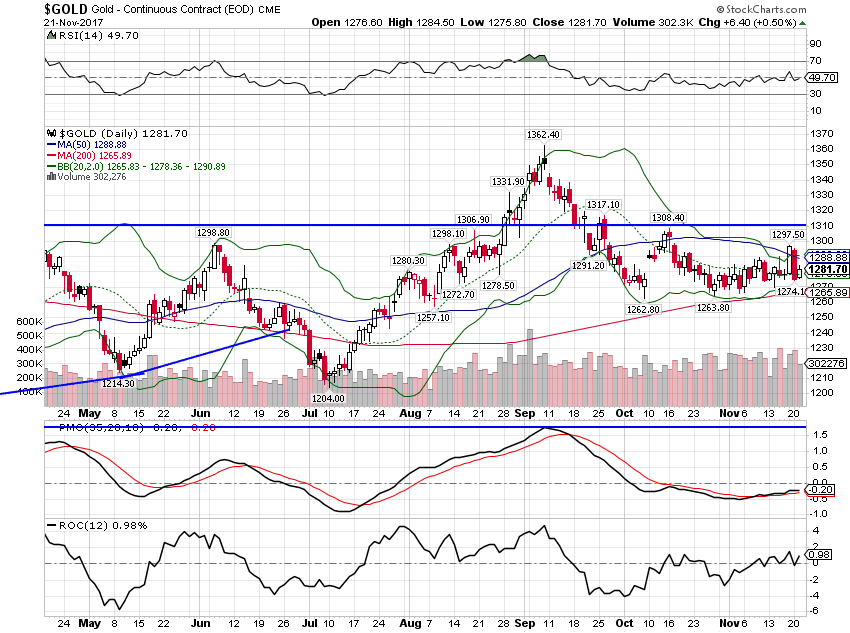 - Click to enlarge |
| The copper to gold ratio has also stalled. This ratio is highly correlated with bond yields and the recent moderation bodes well for bond holders. |
Copper:Gold Daily, May - Nov 2017(see more posts on Copper, Gold, )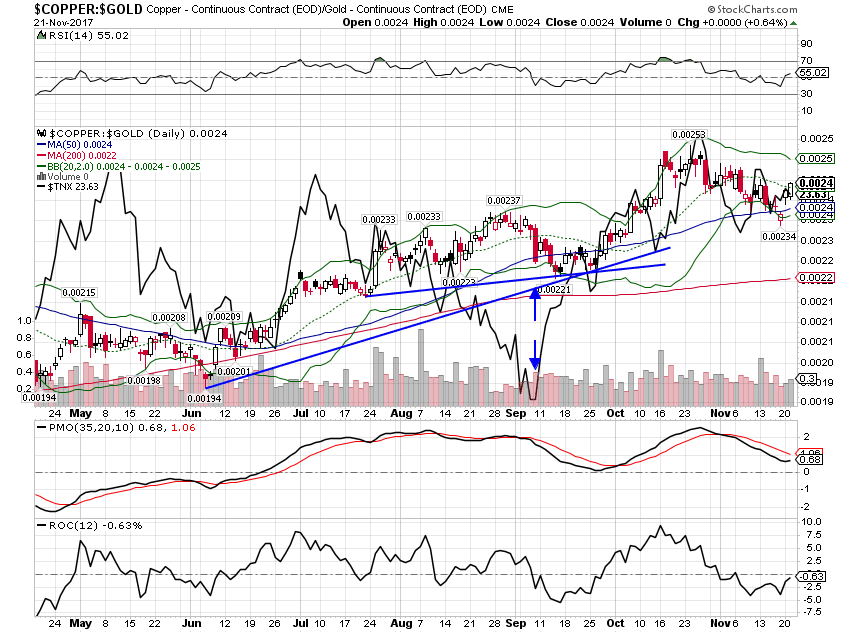 - Click to enlarge |
| The general commodity index pulled back a bit but the trend is still higher. This is primarily a reflection of a weak dollar but also tells us that growth, while not robust, isn’t falling off a cliff either. As I said, status quo on the growth. |
Bloomberg Commodity Index, May - Nov 2017(see more posts on Bloomberg Commodity, )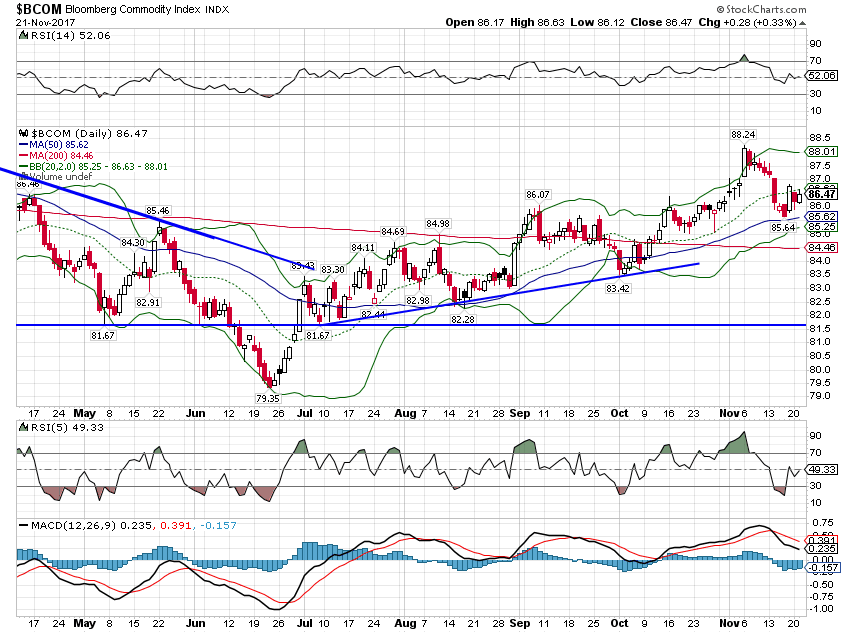 - Click to enlarge |
The US economic data has been somewhat better recently but other than the stock market, there is little market based evidence that it is anything other than a rebound from the hurricanes. It was not unexpected and it will run its course in due time, a whirlwind of hot air. When it does, the bond, currency and commodity markets are saying we’ll be right back where we’ve been for the last several years. I’m sure the Fed sees things differently just as Alan Greenspan did in the last cycle, believing more in their models than the real world. I’m also sure the Trump administration believes they can get growth back up to a sustainable 3 handle. I’d like to believe that but the market doesn’t agree and it has a lot better track record than me or the Fed.
Tags: Alhambra Research,Bi-Weekly Economic Review,Bloomberg Commodity,Bonds,commodities,Copper,copper to gold ratio,credit spreads,currencies,economic growth,economy,Gold,Interest rates,Markets,newslettersent,stock market,stocks,TIPS,U.S. Dollar Index,Yield Curve