Joseph Y. Calhoun
My articles My siteAbout meMy videosMy books
Follow on:LinkedINTwitterSeeking AlphaAmazon
Economic Reports
Employment
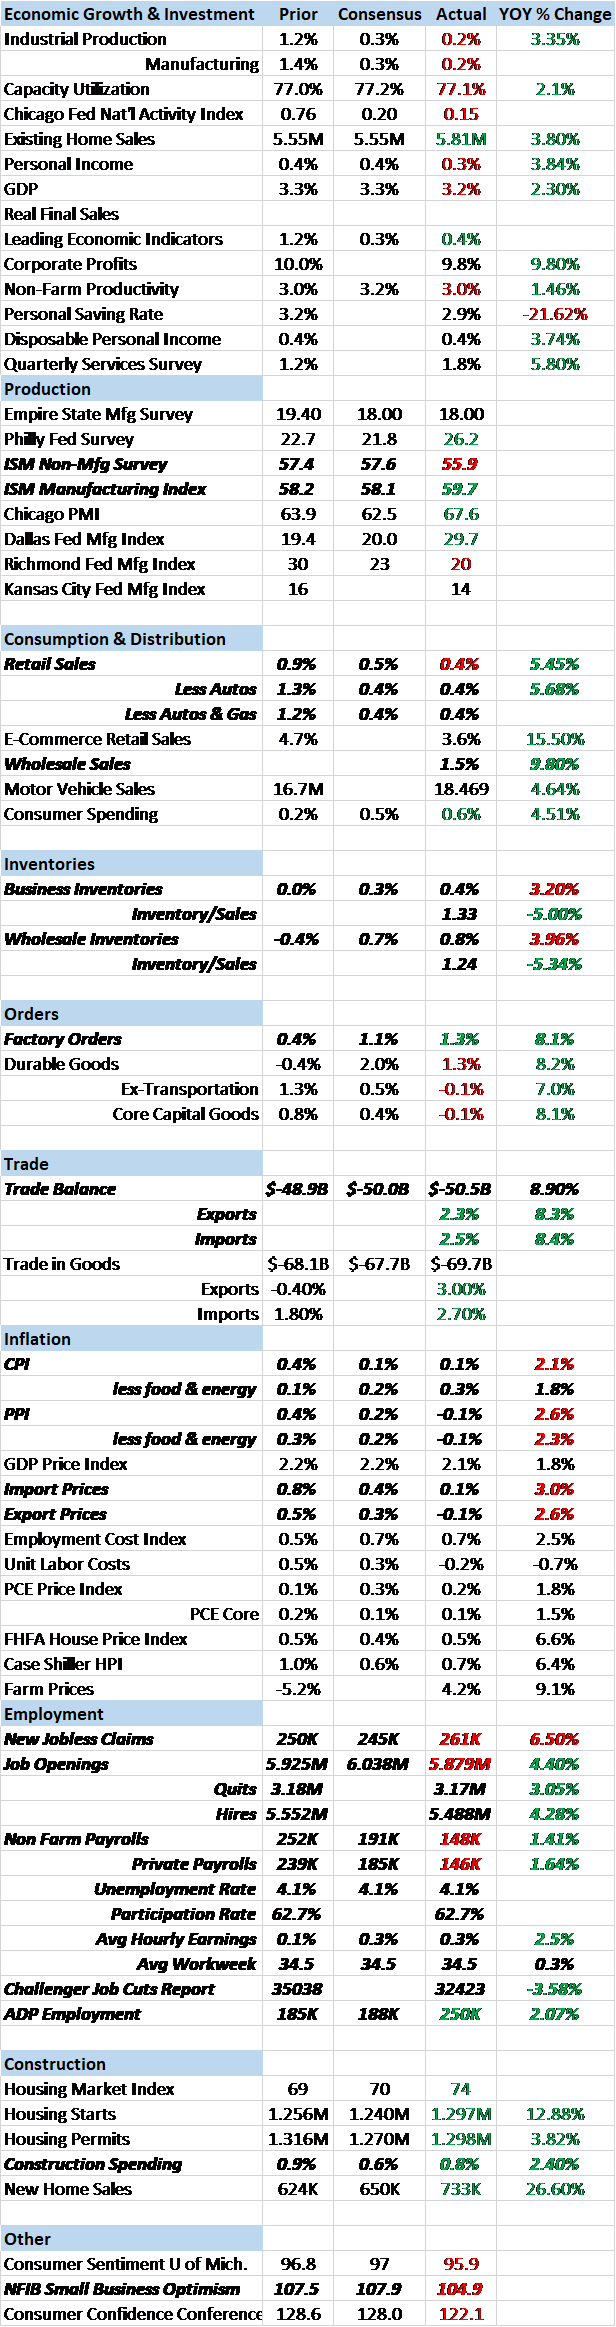
We received several employment related reports in the first two weeks of the year. The rate of growth in employment has been slowing for some time – slowly – and these reports continue that trend. The JOLTS report showed a drop in job openings, hires and quits. The Fed has been talking about a tight labor market but this report peaked last July so that may not be as much a concern as they think. It certainly wouldn’t be the first time the Fed got behind the curve on something.
The employment report was, like the JOLTS report, less than expected but not all that bad. The economy added 148k jobs in December, well less than the 191k expected. But this report is subject to some pretty big revisions so take that with a grain of salt. Revisions to October and November were slightly negative. There were some standout areas such as construction and manufacturing but retail was down 20,000 jobs and other areas showed modest growth. Average hourly earnings were up 0.3%, in line with expectations but up just 2.5% year over year, barely enough to keep up with inflation.
Jobless claims were higher than expected in both the first two weekly reports of the year. I don’t comment much on claims because they don’t tell you much except at turning points. In this case, unfortunately, the reports require a quick comment. Claims in the second week of January were 6.5% higher than a year ago and that is a bit of a warning sign. A more important milestone will be when the 4 week moving average closes higher year over year. That could be soon with that change in the most recent report showing less than a 1% drop year over year.
Trade
The trade deficit expanded in the latest report with both imports and exports rising. Exports were up 2.3% on the month with exports of capital goods – and especially aircraft – very strong. Exports are up 8.3% year over year but are still less than the peak for this cycle in 2014. Imports were up 2.5% and while some of that was due to rising oil prices, the gains were pretty broad-based. Capital goods imports increased but consumer goods were the big winners, up $2.5 billion on the month. Imports are up 8.4% year over year and are at an all time high. Due to the quirks of GDP accounting the bigger deficit will actually reduce Q4 GDP but these are pretty good numbers.
Construction
Construction spending was up a better than expected 0.8% on the month and 2.4% year over year. Residential construction, not surprisingly considering the reports we discussed in the last update, led the way up 1% monthly. Single family homes were up 1.9% monthly and 8.9% year over year offsetting a decline in multi-family construction. Office construction was up a very strong 5.5% on the month. But overall, private non-residential contrasts sharply with residential, down 3.1% year over year.
Sales, Orders & Inventories
Retail sales were about as expected in December, up 0.4% on headline and ex-autos. Non-store retailers – e-tail – had a great holiday season with sales up 1.2% in December after a 4.2% surge in November. Of course, at least some of those sales were cannibalized from brick and mortar locations, notably department stores where sales were almost a mirror image, down 1.1%. There is still, no doubt, some hurricane effect in these numbers but it is starting to fade. How sales look after that spurt will tell us a lot about how things will go in 2018. Right now the year over year change at about 5.5% is consistent with what we saw coming out of the 2001 recession and just before the 2007-8 version.
Of more concern perhaps is that those sub-par sales were driven, at least in November, by a $28 billion surge in consumer credit of which $11.2 billion was revolving (credit cards primarily). The obvious question is whether the surge in credit was due to choice or necessity, something I can’t answer but we’ll find out in coming months.
Inventories continue to improve relative to sales. Wholesale inventories were up 0.8% while wholesale sales outpaced that at 1.5%. That pushed the inventory/sales ratio down to 1.24 which is better but still elevated. A similar trend is seen at the all business level with inventories up 0.4% in November and sales up 1.2% and the inventory/sales ratio down to 1.33. Again, improved but not near the best of the business cycle (1.24 in 2011). BTW, inventories are up this quarter but at a slower pace than Q3 so the build so far is actually a negative for GDP.
Factory orders were up in response to the inventory draw. The good news is that durable goods orders were up 1.3% the same as we saw in the advance report. The bad news? Well, that 1.3% gain includes aircraft orders from the Paris Air Show which of course only happens once a year. Further bad news is that non-durables were up 1.4% but that reflects a pretty good rise in the price of oil and products. More bad news? How about core capital goods orders down a little more than the advance report at -0.2% and vehicle orders up 1.1% but only due to a hurricane replacement push.
Inflation
Inflation generally moderated in December. Import and export prices were up 0.1% and down 0.1% respectively. Year over year numbers are 3.0% and 2.6%. Import prices were actually down on the month excluding petroleum. Producer prices also came in less than expected, -0.1% versus expectations of +0.2%. Ex-food and energy, prices were also down 0.1%. Consumer prices were also well behaved and about as expected, +0.1%. Core prices, ex-food and energy, were up 1.8% year over year in December. The Fed’s search for cost push inflation would appear to be in vain.
Sentiment
The NFIB Small Business Optimism Index fell back a bit last month from 107.5 to 104.9. Leading the decline was an 11 point drop in expected business conditions (still high at 37) and an 8 point drop in plans to increase inventories (not still high at -1). Expectations of real sales and employment were also down but also still positive overall. 104.9 is still a good number and the 107.5 last month was only exceeded by the 108 in July 1983 so this fall is nothing to be concerned about just yet.
The ISM manufacturing index bested expectations at 59.7 with new orders posting a seventh straight reading over 60. This report has been strong for the last year but we have yet to see this level of activity in the actual hard numbers. The non-manufacturing version of the report was less than expected at 55.9 but still at a positive level.
Sentiment about the economy remains strong but that has been mostly due to anticipation of tax reform. Now, though, we are about to find out how the tax reform actually impacts the economy rather than just speculating about it. The forming consensus seems to be that tax reform will be a short term positive and a long term neutral so that is what is baked into the market cake. I could be wrong but I wonder if the consensus has this almost backward. In the short term companies are going to be forced to repatriate earnings and pay taxes. That has a real impact as they have to actually pay the tax; it isn’t just a non-cash writeoff. In addition, 65% of companies say that their first priority for that new cash will be paying down debt. I don’t think either of those items will be stimulative in the short term. Long term, tax reform may provide a boost to growth but short term doesn’t look nearly so positive to me.
Market Indicators
10 Year Treasury Note YieldThe 10 year Treasury yield has risen strongly at the start of the year up about 15 basis points since the last stanza of Auld Lang Syne. This reflects a rise in nominal growth expectations since the beginning of the year. Some of the rise is due to rising inflation expectations but with last week’s PPI and CPI reports both benign, I suspect we’ll see that moderate. Technically, the yield is still below last year’s high of 2.63%, a level above which one can expect a lot of technical selling. |
US Treasuries, Daily(see more posts on U.S. Treasuries, )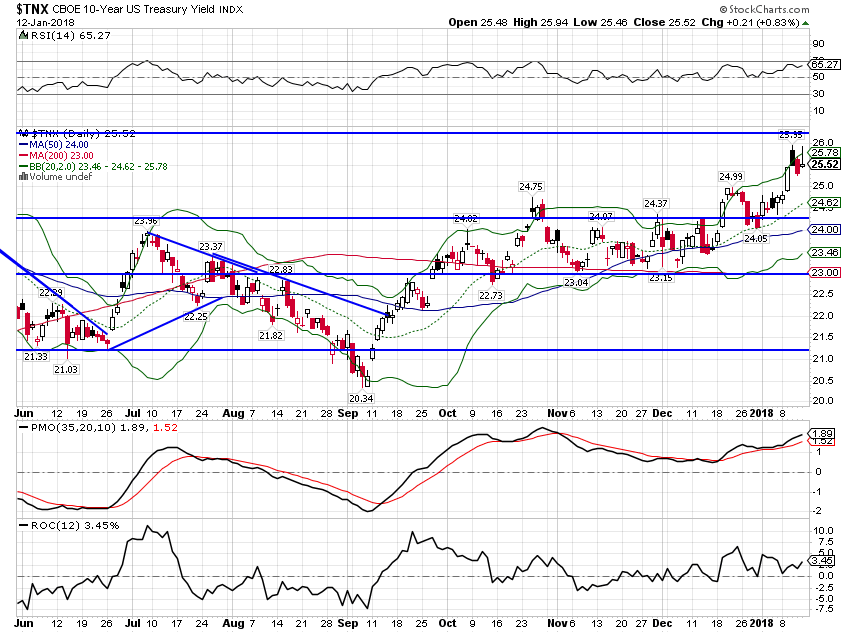 - Click to enlarge |
10 Year TIPS yieldsThe yield on the 10 year TIPS were also higher, up about 10 basis points which reflects a rise in real growth expectations. But at 0.54% the rate is still very low and well within the range that has prevailed since mid-2013. |
US Treasuries Inflation-Indexed Security, Jul 2012 - Jan 2018(see more posts on U.S. Treasuries, )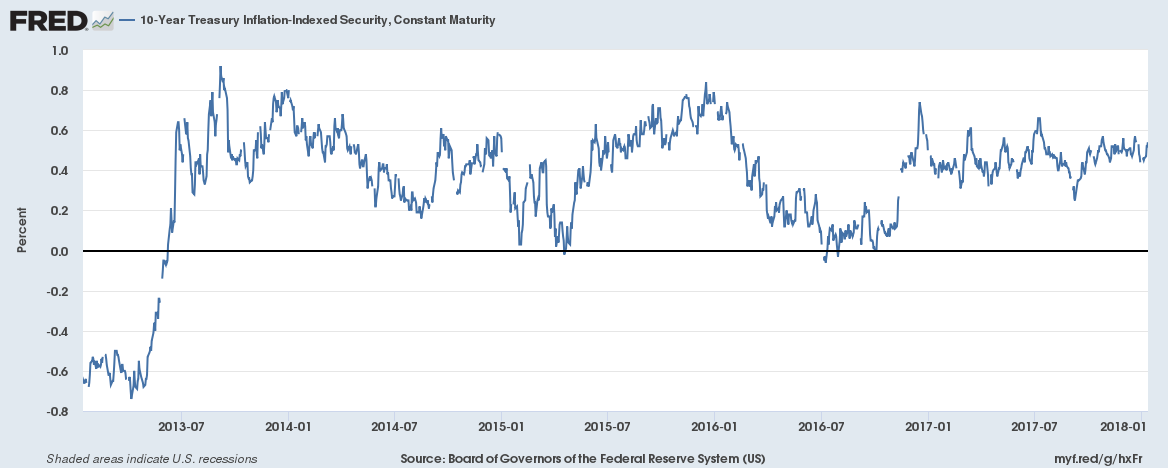 - Click to enlarge |
10/2 Yield CurveThe yield curve steepened ever so slightly (about 5 basis points) but the trend is obvious and intact. The yield curve action is normal and not concerning at this point. We aren’t to flat yet (and maybe won’t get there) and short rates are still rising faster than long rates. History says the odds of recession are still quite low. |
US Treasuries Constant Maturity, 2000 - 2017(see more posts on U.S. Treasuries, )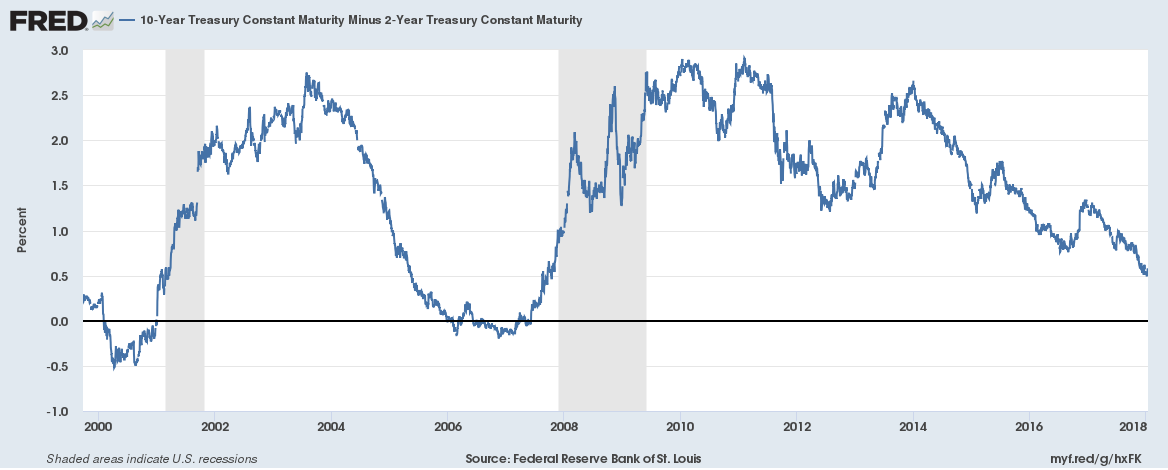 - Click to enlarge |
Credit SpreadsCredit spreads have started the year by resuming the narrowing trend, falling 23 basis points since the turn of the calendar. Spreads are near the lows of the cycle and showing no sign of stress. |
BofA Merrill Lynch US High Yield Option, Jan 2008 - 2018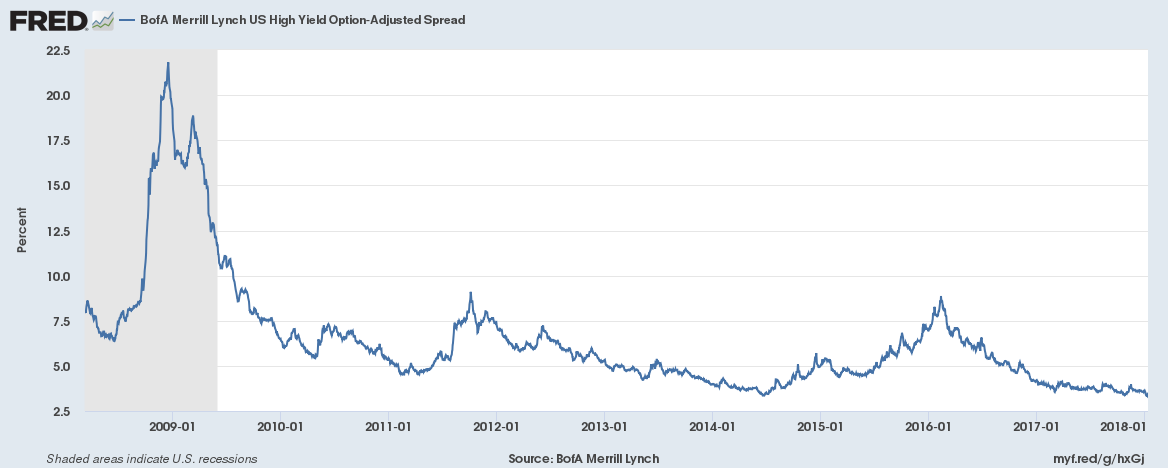 - Click to enlarge |
US DollarThe dollar appears to be starting another downleg, breaking support last week to make a new low for this bear move. Next support is at the rising trend line at about 86 but a countertrend rally seems likely before a test of that level. Sentiment has gotten a bit too negative on the buck in my opinion. Or maybe it is that sentiment regarding the Euro is perhaps overly optimistic. I don’t see that a lot has changed in the European economy although the cyclical upturn has been nice. Structural, secular change? Not so much… |
US Dollar Index, Oct 2016 - Jan 2018(see more posts on U.S. Dollar Index, )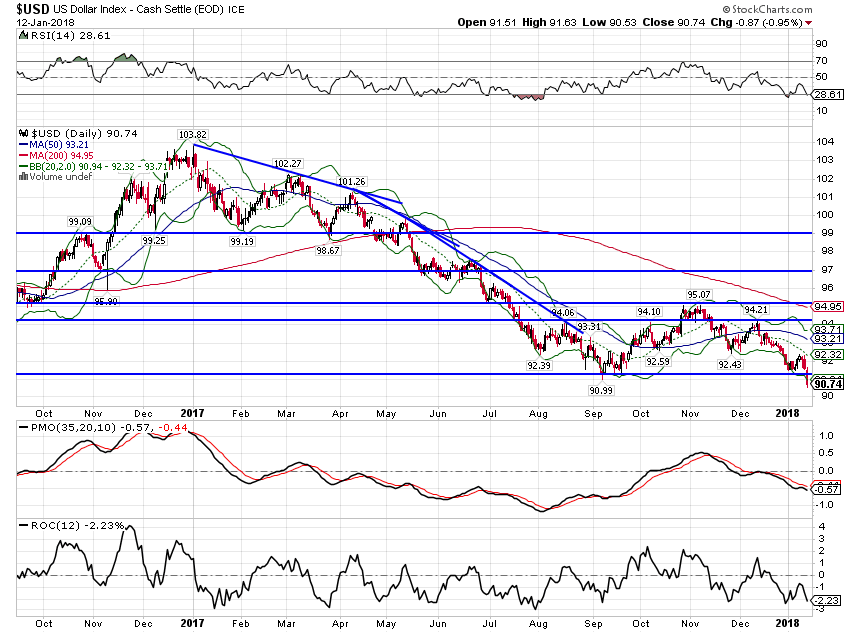 - Click to enlarge |
CommoditiesA weaker dollar generally means stronger commodity prices and that is exactly what we’ve seen since the start of the year. Gold, in particular, has resumed its uptrend, not a particularly positive sign for future US growth. This is the easiest way to see how a weak dollar tends to offset the positives of tax reform. We experienced this before in the George W. Bush administration which paired a tax cut with a weak dollar policy and we know what that got us. Trump and his advisers seem oblivious to the damage done by a weak dollar that drives investment – literally – into the ground. |
Gold Daily(see more posts on Gold, )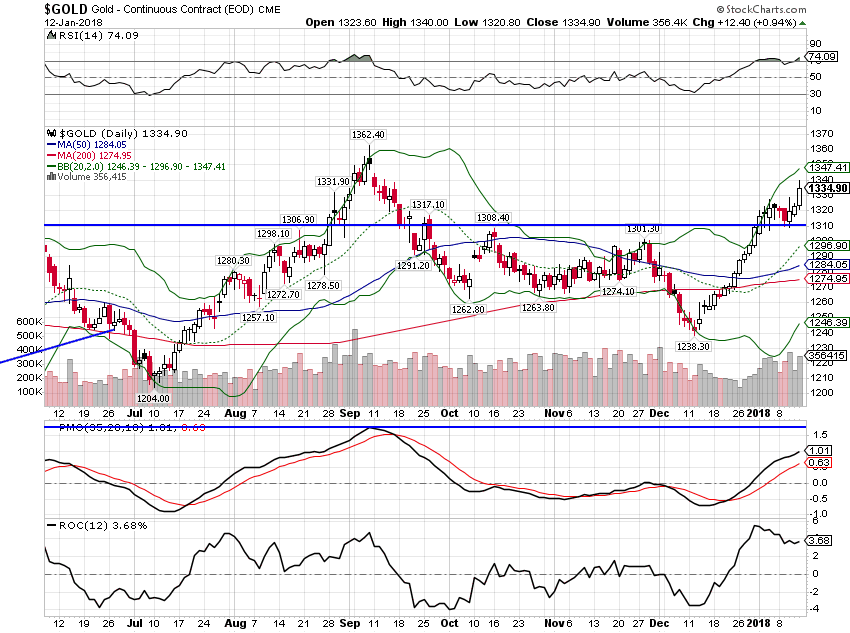 - Click to enlarge |
| The more general Bloomberg Commodity index is also up for the year and in a nice uptrend. |
Bloomberg Commodity Index, Jun 2017 - Jan 2018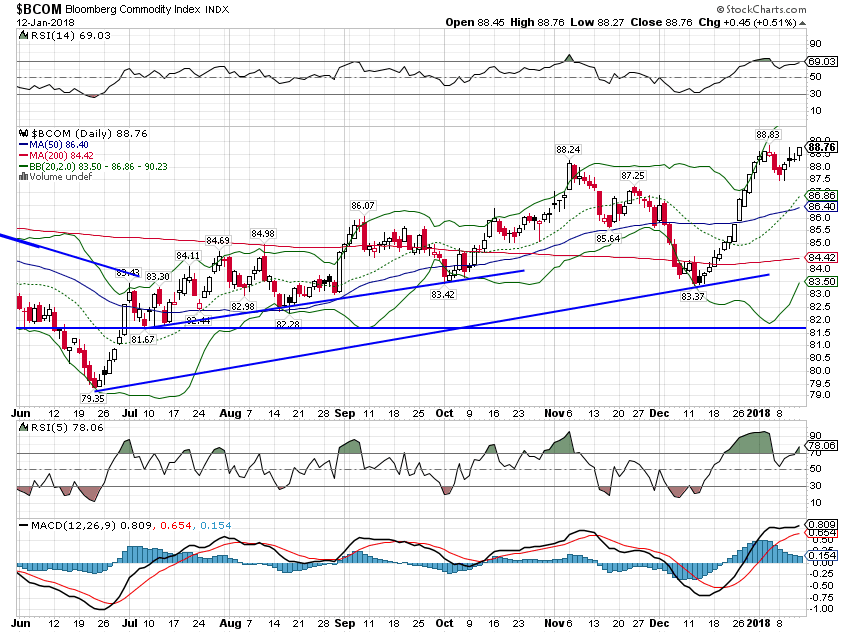 - Click to enlarge |
| The copper/gold ratio has fallen since the beginning of the year even as bond yields have moved higher. If the downtrend continues, bond yields will likely follow. |
Copper Daily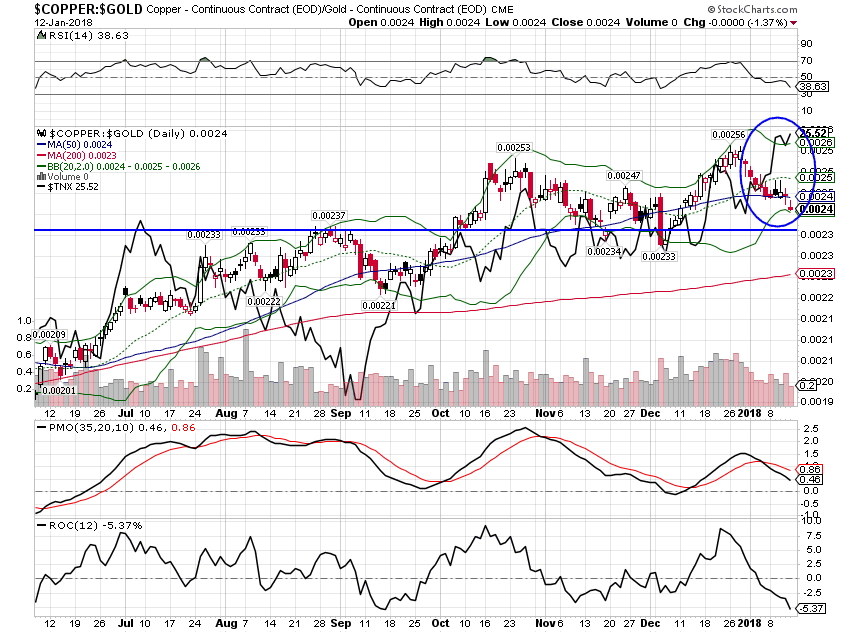 - Click to enlarge |
The new year hasn’t brought much change to the economic landscape. The economic reports were mixed, as usual, and point to a continuation of the 2% growth trend we’ve been on for some time. Tax reform might change that long term but as I said last week, I suspect markets – especially stocks – are in for a bit of a reality check. Expectations for growth are sky high and if I’m right about tax reform being a short tern negative, we are set up for disappointment. In addition, sometime in the next month or so, the data will start to be hurricane effect free and we’ll see where the economy stands absent that distortion. Remember, auto sales were in a pretty decent downtrend until Houston and that seems likely to resume. By the way, that big rise in consumer credit may have been impacted by auto replacement too as most people didn’t get a check big enough to buy a new car outright.
I am increasingly concerned about the impact of the falling dollar. As I said above, we’ve seen this movie before and I don’t like the ending. A falling dollar drives investment to hard assets like gold, real estate and commodities. While the US economy has become – unfortunately – positively correlated to oil prices in recent years, there is a limit to how much energy can be the driver of US growth. Investment in gold and real estate will not improve productivity and and population growth will be limited with the immigration policies of the current administration. Add some tariffs to this economic stew and the end result is not very appetizing.
Tags: Alhambra Research,Bi-Weekly Economic Review,Bonds,commodities,Construction Spending,copper/gold ratio,credit spreads,currencies,economic growth,economy,employment,GDP,Gold,inflation,Interest rates,Inventories,jolts,Market Sentiment,Markets,newslettersent,Real Estate,Retail sales,stocks,tax reform,Taxes/Fiscal Policy,TIPS,trade deficit,U.S. Dollar Index,U.S. Treasuries,US dollar,Yield Curve