


Joseph Y. Calhoun
My articles My siteAbout meMy videosMy books
Follow on:LinkedINTwitterSeeking AlphaAmazon
Economic Reports
Economic Growth & Income
Personal income for December was better than expected at up 0.4% on the month and 4.11% year over year. Wages and salaries were up 0.5%. Unfortunately, that rate of rise is not even up to the lower end of the range we’ve seen in past expansions when 5% income growth was a precursor to recession. Still, it is, sadly, about average for this expansion.
Two items in this category of greater concern are the savings rate and productivity. The savings rage has been falling steadily since late 2015, now down 25% year over year. At 2.5% the savings rate is now down to the level that prevailed just prior to the last recession. I suppose it could be that people are so confident in the economy they don’t feel the need to save but that has never been the case in the past.
Productivity growth for the 4th quarter turned out to be not growth at all but rather a negative 0.1%. And productivity growth is related to investment which is a function of savings which as we just saw is not that great. And don’t even get me started on the giant dissavings that is the recent budget deal. Trumponomics, like the man responsible for it, is full of contradictions.
Production
All the sentiment based production reports of the last two weeks were positive. The ISM reports were both near 60 with new orders even higher, the manufacturing version at a 10 year high. The Chicago PMI and Dallas Fed manufacturing survey were also better than expected with the Chicago report showing a 6 year high for the employment component.
Consumption & Distribution
Consumer spending, up 0.4%, was slightly less than expected in December but November was revised higher from 0.6% to 0.8%. Still at roughly 4.5% year over year, the rate is at the low end of what we’ve seen in previous expansions. More disconcerting to me is that it took a huge surge in consumer credit to make it happen. November and December together saw a nearly $50 billion rise in consumer credit, a stunning number. Some of that is due to new car loans for hurricane replacement vehicles but credit cards saw a significant rise too.
Inventories
Wholesale inventories rose 0.4% in December and nearly 4% year over year. Still, wholesale sales were also better than expected, up 9% year over year as the inventory/sales ratio fell again to 1.22. That is still somewhat elevated though and I’d like to see it continue to come down. With a big chunk of the inventory build in autos though I wonder if this will continue as auto sales appear to have peaked after the Houston surge. But for now, this was a good report.
Orders
Factory orders were better than expected, up 1.7% month to month and 8.4% year over year. Core capital goods orders were, however, revised lower.
Trade
In bad news for the Q4 GDP report, the trade deficit was reported to have risen in December. Imports and exports were both up, the former led by consumer goods and the latter by capital goods. Again, as I’ve pointed out before, a bigger trade deficit reduces GDP but it isn’t actually a sign of economic slowdown. The only time we’ve had a near balanced trade account in recent decades is during recession when imports fall. Somehow I don’t think that’s what President Trump has in mind when he talks about reducing the trade deficit.
Inflation
The most popular explanation for the recent stock market selloff is that the wage component of the recent employment report engendered inflation fears. I suppose that could have been a contributing factor but I don’t really subscribe to that theory. I’ll discuss the employment report below but the bottom line is that there were too many distortions in that report to take the threat of wage push inflation seriously. Besides, there is no evidence – despite decades of trying to prove a link by economists like Janet Yellen – that wage inflation is connected to general inflation.
And there is little evidence of even wage pressure with unit labor costs up just 1.3% year over year. The employment cost index is rising at a more rapid rate (2.6%) but that is due primarily to rising benefits cost – healthcare costs.
More general inflation is among the missing as well with the PCE deflator up just 1.7% year over year with the core up 1.5%. Official farm prices show a recovery of 4.4% but farmers are still hurting from previous deflation and inventories remain fairly high.
One area we do have inflation, and have for some time, is in housing. The Case Shiller home price index continued its steady march higher up 0.7% month to month and 6.4% year over year in November. With interest rates also up, it would be logical to see a slowdown soon.
Employment
The employment report did show an increase of 200k jobs in December and those notorious average hourly earnings were up 2.9% year over year, supposedly the trigger for stock market selling. But with fewer hours worked, weekly earnings were actually down so I don’t really see much of a problem. Despite the better than expected 200k jobs the general trend for employment growth is still down although it remains positive for now. On the other hand the JOLTS report showed another drop in job openings the 3rd such drop in the last 5 months, a disturbing trend for anyone bullish on the economy. Challenger also reported a month to month rise in layoffs at 44653 but that was less than the same month last year so maybe not that concerning just yet. Jobless claims – probably more important for investors as a canary in the coalmine – continue to track at levels not seen since the 1970s. I am beginning to wonder though if that might not be partially due to what has been called the gig economy. You can’t file for unemployment benefits if you aren’t an employee. It may be that unemployment claims are no longer a good early indicator for the economy.
Construction
Construction spending was up 0.7% in December and 2.6% for the full year. The increase over the last year is entirely due to residential construction with non-residential down 2.5% year over year.
Sentiment
Both Consumer Sentiment and Consumer Confidence were better than expected and continue to print near the highs for this cycle.

Market Indicators
10 Year Treasury Note YieldThe 10 Treasury note yield was just resting when I wrote the update two weeks ago. Almost immediately after I wrote that report, the yield started to rise again and is now threatening the 3% level last seen at the beginning of 2014. Will it break out? I don’t know obviously but we get a CPI report Wednesday that would seem to be fairly important. With speculators holding large short positions in the futures market I’d probably wager on lower yields in the immediate future. But you never know; the crowd can be right longer than you think. One thing that stands out about this move is that it was driven by a rise in real interest rates, as you’ll see below. That is, contrary to the narrative about wages, the selloff in bonds was driven by changes in real growth expectations, not inflation. Of the 150 basis point rise in the 10 year Treasury yield since the bottom in July 2016, the majority is now due to the change in real rates. |
CBOE 10 Year US Treasury Yield Index, Apr 2013 - Feb 2018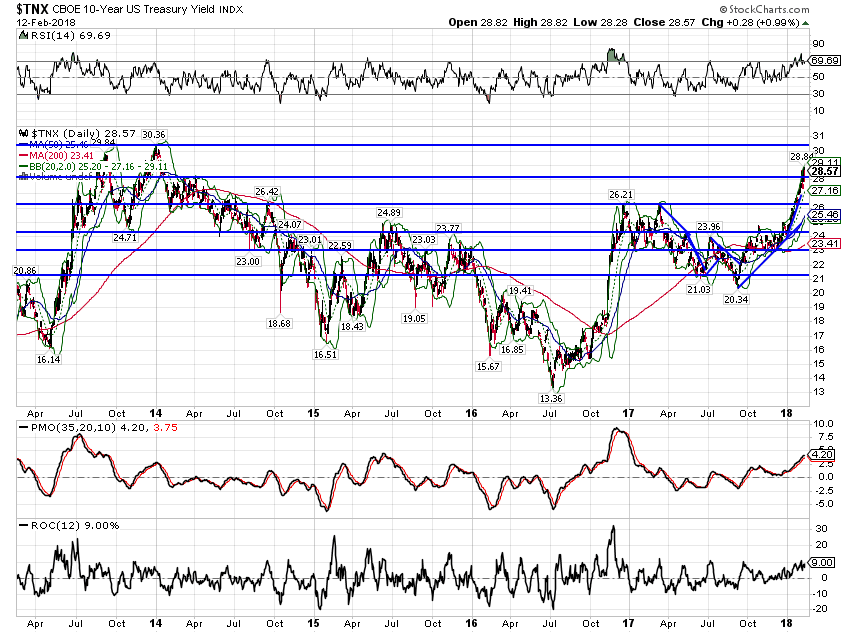 - Click to enlarge |
10 Year TIPS Yield10 Year TIPS yields rose 21 basis points in just the last two weeks. Real rates are now threatening to break out of the range that has prevailed since mid-2013. Are we on the verge of shifting to a higher range of real rates and real growth? What is interesting to me is that it is better growth expectations that are pulling down stocks. I think this falls in the category of be careful what you wish for. Real interest rates are the intersection of savings and investment. Rising real rates indicates a demand for funds to invest in the real economy. If you have lamented the fact that companies have been doing financial engineering – stock buybacks – rather than investing in their company – and that includes us – you may be about to get your wish. Of course, if companies really do start investing in the real economy the money for that is going to have to come from somewhere. If companies reduce buybacks to invest, the stock market loses a major source of demand for shares. |
10 Year Treasury Inflation - Indexed Security, Jan 2013 - 2018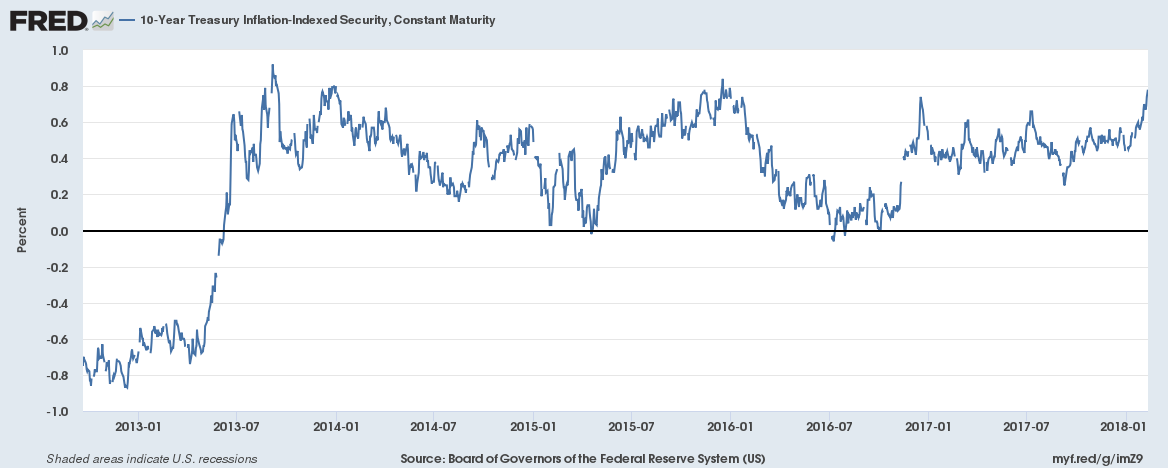 - Click to enlarge |
10/2 Yield CurveThe most interesting development of the last two weeks is the rapid steepening of the yield curve. The 10/2 curve steepened by 25 basis points since the last update. Most of the change was driven by the rise in the 10 year note yield, although the 2 year actually fell by 8 basis points as well. This movement can be interpreted as mostly about a rise in growth expectations, although some of the change was driven by what appears to be a safe haven bid on the 2 year. I do not think the slight pull back in the 2 year note yield is a change in monetary policy expectations. If anything, the events of the last two weeks would seem to point to a more aggressive Fed not one reluctant to raise rates. I suppose there is an element of uncertainty with a new Chairman but I don’t think that played a large role. However, the changing yield curve warrants increased scrutiny in coming weeks. A continued fall in the 2 year note yield would be fairly ominous and point to recession. Right now, I don’t see that as a a likely outcome. |
Yield Curve - 2 Year Bonds, Jul 2017 - Feb 2018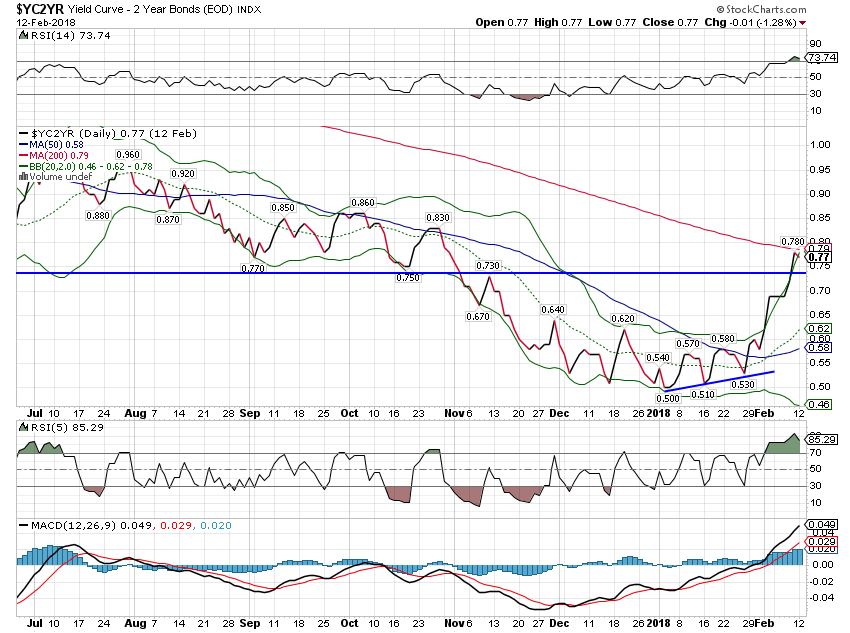 - Click to enlarge |
Credit SpreadsOne sign that may point to a more negative interpretation of the yield curve movement is credit spreads. Spreads widened 48 basis points since the last update two weeks ago, a fairly large move for such a short period of time. It isn’t sufficient – yet – to trigger a move in asset allocation based on our process but it is close and if it continues will require us to reduce risk in our portfolios. For now, the year over year change is still negative (narrower spreads) but only slightly so and the month to month change is too short in duration to make a change. |
ICE BofAML US High Yield Master, 2002 - 2018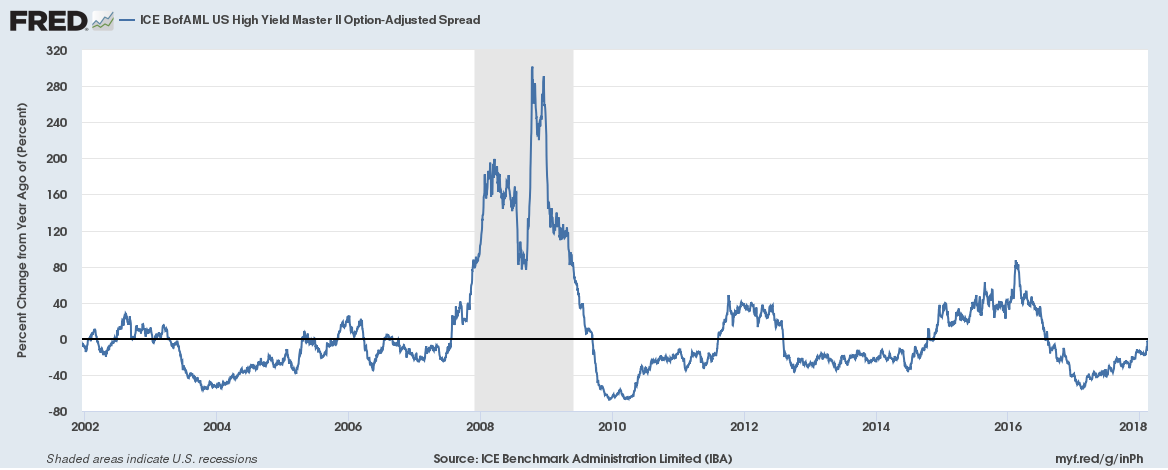 - Click to enlarge |
US DollarThe dollar moved off its lows over the last two weeks but the longer term trend is still down. Considering the recent market turmoil, I am somewhat surprised that we didn’t see a better bid to the dollar. But as I’ve said many times, the President and Treasury Secretary have made it clear that they want a cheaper dollar and they are likely to get it. That isn’t just a matter of sentiment by the way. The popular belief is that currency movements are a function of interest rate differentials but that is only partially true. What really drives currency movements are changes in growth expectations. And growth expectations can be mostly easily assessed through yield curves. With the US yield curve flattening and the European curve steepening, it is not surprising to see the Euro rally (dollar fall). If the recent steepening of the US curve continues, the dollar will likely follow higher. It’s a bit of a circular argument but Presidents who pursue a cheap dollar get it because their policy choices lead to weak growth. |
US Dollar Index, May 2017 - Feb 2018(see more posts on U.S. Dollar Index, )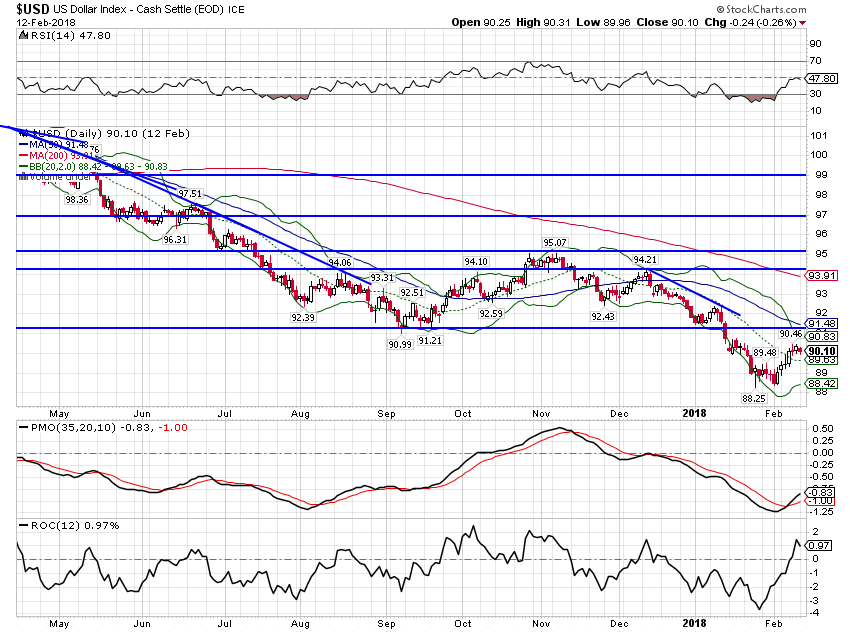 - Click to enlarge |
| This chart shows the dollar and yield curve together. The dark solid line is the dollar index. I have serious doubts about the rally continuing though. The most direct consequence of the President’s increasing budget deficits is an increase in the trade deficit which is negative for GDP growth. That will likely be reflected in the yield curve and therefore the dollar. |
Yield Curve - 2 Year Bonds, Mar 2015 - Feb 2018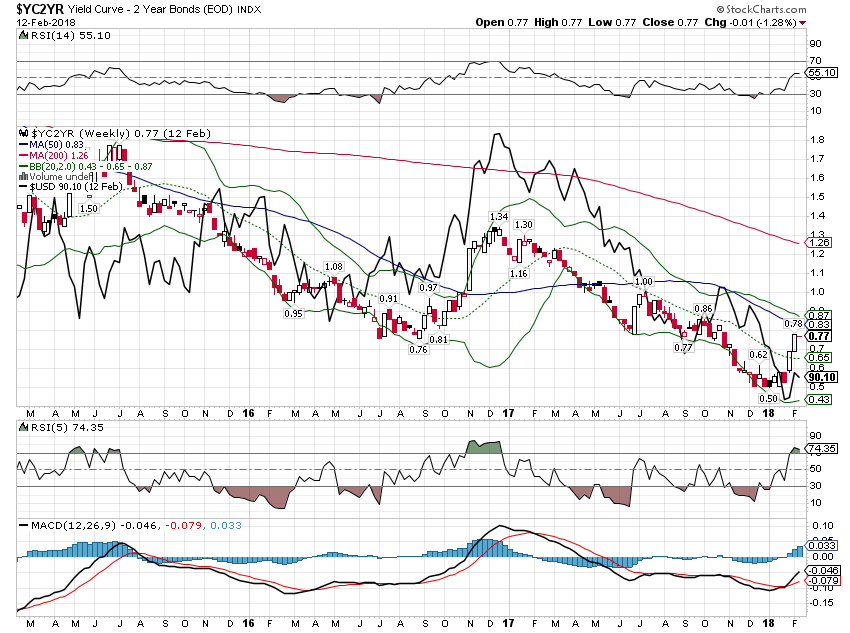 - Click to enlarge |
CommoditiesWith the dollar strengthening we would expect gold to fall and it did but the fall was minor. Gold outperformed stocks over the two week period, not exactly a ringing endorsement of the better growth/steepening yield curve narrative. |
Gold Daily, Aug 2017 - Feb 2018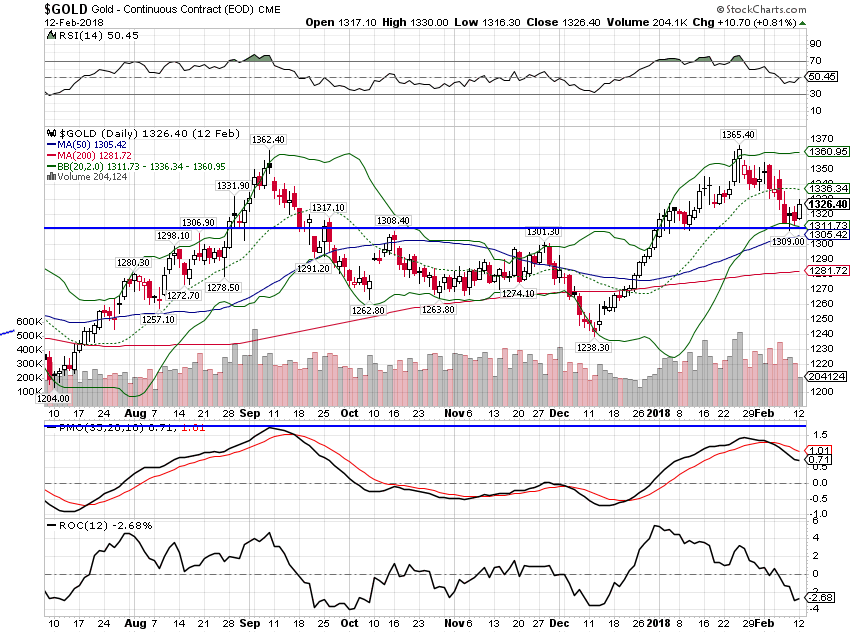 - Click to enlarge |
| The general commodity index fared poorly but also outperformed the S&P 500. |
Bloomberg Commodity Index, Jul 2017 - Feb 2018 - Click to enlarge |
| The copper/gold ratio also fell over the last two weeks, pointing to weaker growth and a bond rally. The inflation report tomorrow may well be the most important inflation report in years. If it shows building inflation pressure, the 10 year note is probably headed to 3% in a hurry. With speculators largely on the short side of the bond market, a benign report would probably trigger short covering and big bond rally. |
Copper:Gold Continuous Contract, Aug 2017 - Feb 2018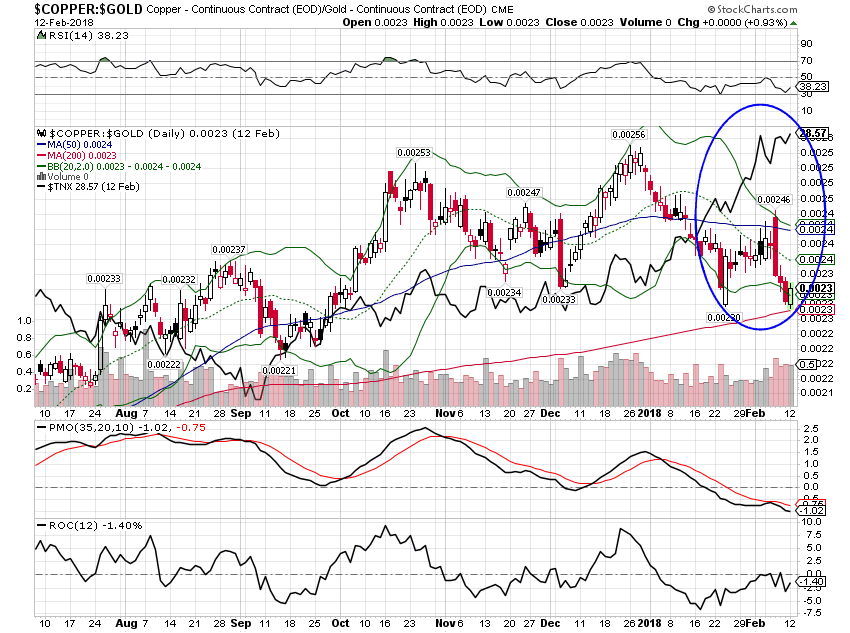 - Click to enlarge |
The markets are adjusting, changing perceptions about growth and inflation. I don’t really think all that much has changed though and am quite skeptical of the emerging inflation narrative. Over the long term a weaker dollar will certainly lead to general inflation. In fact, I tend to define inflation in terms of the dollar rather than an arbitrary index like the PCE deflator or CPI. Inflation indexes are themselves just attempts at measuring the purchasing power of the dollar. I just prefer more direct methods of measuring the value of the dollar. And while the dollar has fallen over the last year, it doesn’t seem so large a drop that inflation should be a problem yet.
On the growth front I am watching the yield curve and real interest rates closely to see if they are able to break out to new, higher levels. The yield curve is our best indicator of future nominal growth but real interest rates are about as good as one can get for predicting future real growth and investment. Higher real rates may be negative for stocks in the short term but higher real growth will eventually be positive, likely after a further correction. And I think more importantly from a societal standpoint, higher real interest rates will be positive for savers and therefore investment and productivity.
Right now, as I said in the last update, real growth is tracking at the high end of the range that has persisted since mid-2013. It may be that growth and inflation are about to break higher and if that is true then markets will adjust and so will our portfolios. But right now, nothing has changed sufficiently to do anything but watch. There is always an urge to do something when markets turn volatile but that doesn’t make it right. That’s why we have a robust investment process that makes tactical changes only when markets tell us a change is warranted. Volatility by itself just isn’t a sufficient condition for a change.
Everyone seems to think they know that inflation is becoming a problem. Everyone seems to think they know that the recent tax reform will raise real growth. I don’t presume to know anything about the future except that it will likely surprise a lot of people. I do these regular reviews to make sure I’m acting on real data and not based on my own internal biases. That is the constant battle that all investors must fight and I’m no different in that regard. What everyone thinks they know and what everyone thinks everyone else knows may turn out to be right. But so far markets have not validated those expectations.
Tags: 10 year treasury yield,Alhambra Research,Bi-Weekly Economic Review,Bonds,commodities,copper to gold ratio,credit spreads,currencies,economic data,economic growth,economy,Gold,inflation,Markets,newslettersent,TIPS,U.S. Dollar Index,US dollar,Yield Curve


