


Jeffrey P. Snider
My articles My offerMy siteAbout meMy videosMy books
Follow on:LinkedINTwitterSeeking Alpha
|
Unlike some sentiment indicators, the ISM Non-manufacturing, in particular, actual trade in goods continued to contract in May 2020. Both exports and imports fell further, though the rate of descent has improved. In fact, that’s all the other, more subdued PMI’s like Markit’s have been suggesting. Getting closer to a bottom. Unlike any of the sentiment numbers, however, these trade figures better demonstrate just how far from a rebound let alone recovery the world might be. The hole is enormous, a very long road ahead. The problem with a long road ahead is that it’s been a very long one already. Unadjusted, US exports to the rest of the world tallied $90.7 billion during May – the lowest for that particular month since May of 2009. Even though the global economy had begun to reopen in its earliest weeks, exports were still 36% below where they had been in May 2019; which wasn’t exactly a great month, either, exports already shrunken from May 2018. |
US Trade in Goods, SA 2010-2020 - Click to enlarge |
| On the import side, inbound trade totaled $163.9 billion. That was the worst May since May 2010 and down just about 26% year-over-year. Using seasonally-adjusted figures, the annual decline somehow works out to just 18%, more importantly still a quarter less than the peak which was set all the way back in October of 2018.
At this stage, determining the exact size of the contraction is like splitting hairs even when competing views might be eight percentage points apart. While the scale of the downside matters, it means as much that trade has been going in reverse for more than a year and a half. It’s a lot to ask hurting economies and the businesses within them to hang on for some resolution to “trade wars” that weren’t the real cause while the system reversed for longer than a year up to February 2020. And then only to suffer a massive shortfall on top, this sets up the global economy for more than disappointment moving forward. |
US Trade in Goods, SA 2010-2020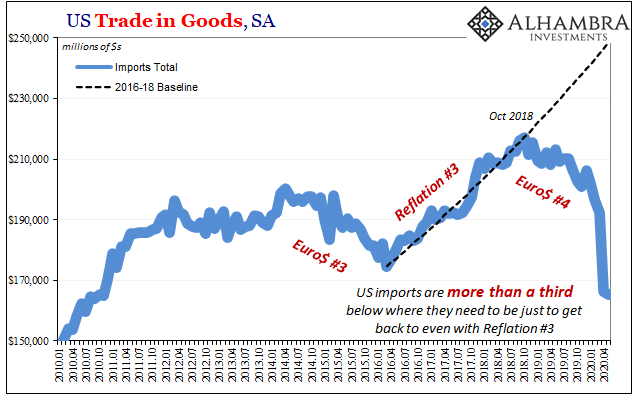 - Click to enlarge |
| In other words, while imports may be a quarter less than the October 2018 high point, because of the amount of time stuck in reverse they are now a third less than what businesses and economies around the world were expecting from all the happy talk out of Jay Powell’s mouth throughout 2019. Rate cuts, repo ops, and the like were meant to push the US (and global) economy back up to its prior trajectory.
And while none of those things were having much of any real effect on the real economy, US imports a proxy for broad US economic demand, they did have some effect of holding out hopes for a pre-COVID turnaround. |
US Trade in Goods, NSA 1989-2020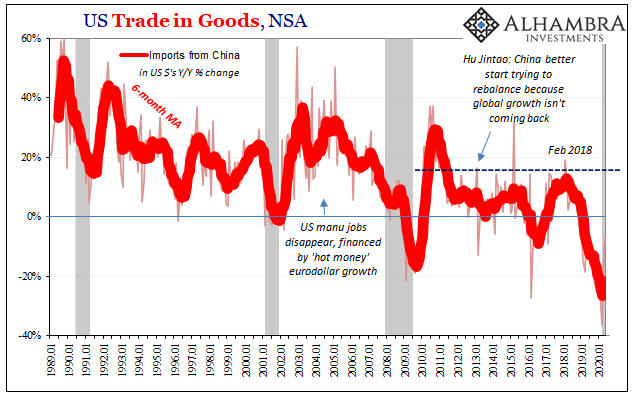 - Click to enlarge |
| But what about now? The US economy, in trade terms, has to first climb out of a 25%-sized hole before it then must finish off the rest of the substantial deficit thereafter. The first part of that is already uncertain, at best, so how long can everyone wait before really getting back to even (the Reflation #3 baseline) again?
Time is against everyone. The longer it takes to make our way back up, and the less it looks like we’ll make it even close to all the way, the more that sets up the second wave of GFC2 and economic retrenchment. Not even the optimistic mainstream models assume that we finish off the first task (getting back to even with February 2020) before some time in 2022 or later. |
US Trade in Goods, NSA 1989-2020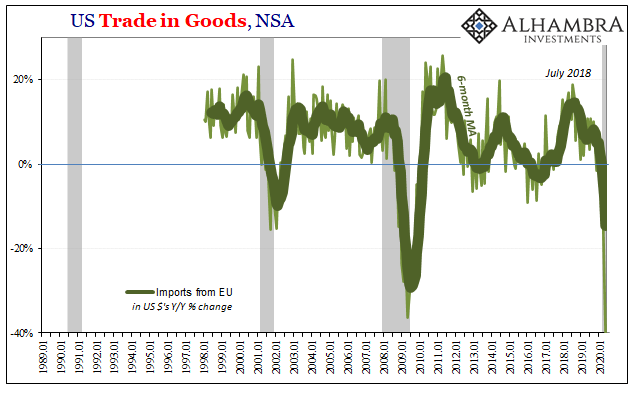 - Click to enlarge |
| Like the various labor market numbers, you can see the difference between reopening and demand destruction by comparing among the various sets. Imports from Europe, for example, were more than 40% less in May 2020 than in May 2019, a bigger drop than during April (-30.2%). That’s not all shutdown. Same for Mexico where US imports from our Southern neighbor were less than half (-53.5%) during May than what they were the year before. |
US Trade in Goods, NSA 1989-2020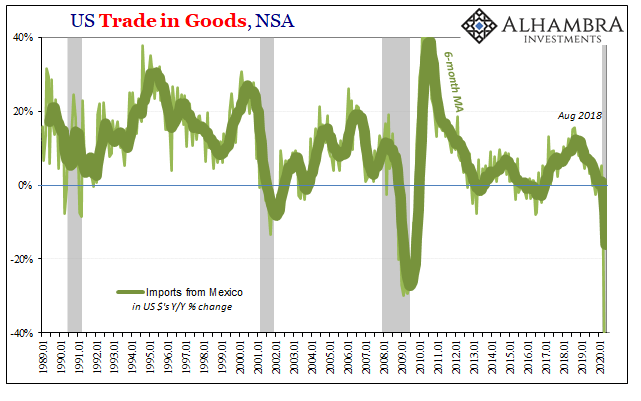 - Click to enlarge |
During May.
Imports from China, where the economy has been opened back up for several months, they still dropped by 7% year-over-year. While clearly better than the Europe-sized -36.5% during March 2020, even with Chinese production back up and running, imports catching back up remained significantly below May 2019 when they were already more than 10% lower than May 2018. They caught up, only to a significantly lower level.
The shutdowns are masking deep deficiencies that the global economy had already been wrestling with for a very long time. Thus, the potential for the second leg down; more purely economic in nature than the first one in March and April.
How long can anyone go on hoping for the badly-needed full recovery, paying marginal workers and maintaining only slightly lower production levels before recognizing there’s no quick fix here with one deep economic hole dug inside another?
Not to mention the already large deficit of “dollars” globally.
At some point, companies have to throw in the towel and turn minor (economic) adjustments into massive ones. I think we’ve already seen that to some extent inside the US (jobless claims that have kept up at double record levels through June) and have to wonder just how much it’s likewise taking place, or potentially going to take place, around the rest of the world. Maybe that’s why China all of a sudden has weirdly pointed the world’s attention in the direction of its stock market (desperation, not confidence).
Lost in the fascination yesterday over the ISM’s upward bias, Markit’s chief Economist, no slouch when it comes to putting a positive spin on numbers, felt it necessary to qualify his latest such spin looking ahead:
With business confidence in the outlook picking up again in June, a return to growth for the economy in the third quarter looks likely, though this will very much depend on the extent to which demand continues to strengthen. There remains a strong possibility that growth could tail off after the initial rebound due to weak demand and persistent virus containment measures. emphasis added
It’s not that “growth” will “tail off”, more accurately when appropriately separating non-economic from economic factors the positive numbers of late are almost entirely the former and almost none of the latter.
Once the reopening trend has exhausted itself, and the gigantic positives dissipate, what does the economy look like then? Where the very important trade numbers are concerned, there’s already reason to suspect it’s not anywhere like a “V.” It has been trade which has led the global economy’s direction in each and every one of these ups and downs, Euro$ #4 the emphatic exclamation on the process
Trade began to fall long before “trade wars” all the while the mainstream bias was solidly globally synchronized growth. And it was merchandise exchange which converted that into the globally synchronized downturn predating COVID by more than a year (almost two, in some instances).
A persistently large drag here portends ill for not just V-shaped hopes, but also raises the risks for the economy’s second wave.
Full story here Are you the author?Tags: China,currencies,dollar shortage,economy,eurodollar system,Europe,exports,Featured,Federal Reserve/Monetary Policy,global dollar shortage,global trade,imports,Markets,Mexico,newsletter


