Swiss FrancThe Euro has fallen by 0.38% to 1.0545 |
EUR/CHF and USD/CHF, April 30(see more posts on EUR/CHF, USD/CHF, )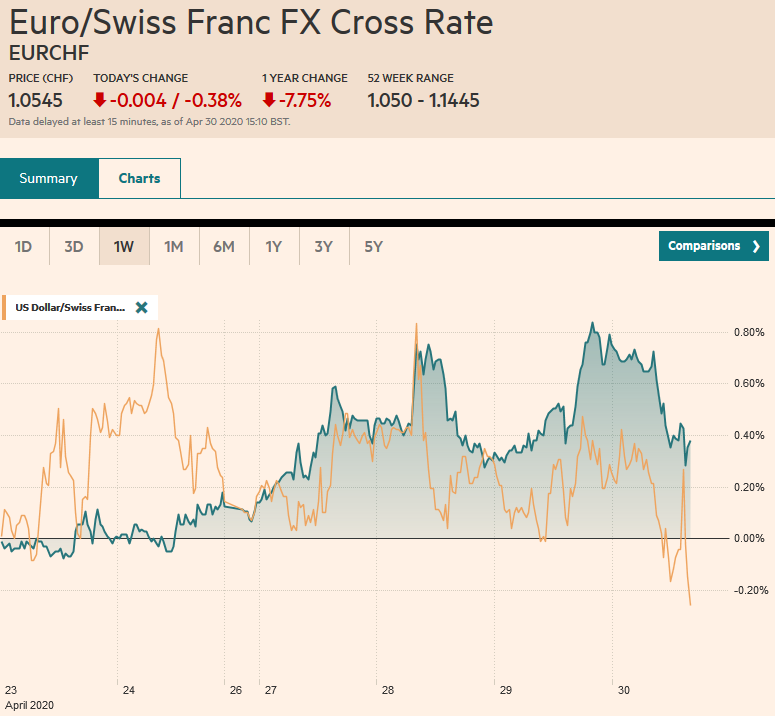 Source: markets.ft.com - Click to enlarge |
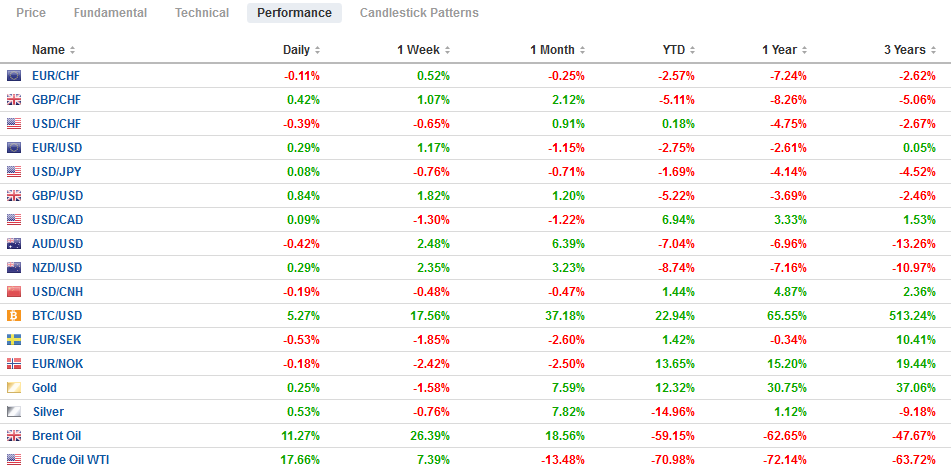
FX RatesOverview: Equities continue to recover even as deep economic contractions are reported. Yesterday, the US said Q1 GDP contracted at an annualized pace of 4.8%, while the eurozone reported today that output fell 3.8% quarter-over-quarter in Q1. Hong Kong and South Korea were closed, but the rest of the Asia Pacific bourses rallied strongly with several, including Australia and India, rising more than 2%. European shares opened higher before stalling, and US shares are firm after the S&P rose nearly 2.7% yesterday. Benchmark bond yields are mostly lower, though Italian bonds are underperforming. The 10-year US Treasury yield is softer at 61 bp. The US dollar is mostly softer, though the Antipodean currencies are paring recent gains. Emerging market currencies are mostly higher, and the JP Morgan Emerging Market Currency Index is pushing higher after gaining more than 1% in each of the past two sessions. Even the South African rand has rallied after having been downgraded by S&P late yesterday to BB- (three notches below investment grade). Gold is consolidating above $1700, while oil is extending its recovery. June WTI hit almost $10 two days ago and is now above $17 as Norway joins the output cuts (-250k barrels a day in June and -134k barrels a day in H2) amid a smaller than expected US build. |
FX Performance, April 30 |
Asia PacificChina’s April PMI was mixed. Manufacturing disappointed. The manufacturing PMI slipped to 50.8 from 52.0, and the Caixin measure, which has smaller companies than the official PMI, fell back to 49.4 from 50.1. The service sector, which speaks more to the domestic economy than the export sector, beat estimates with a 53.2 reading, up from 52.3 in March. The PBOC is expected to ease policy further in May to solidify the recovery. |
China Non-Manufacturing Purchasing Managers Index (PMI), April 2020(see more posts on China Non-Manufacturing PMI, )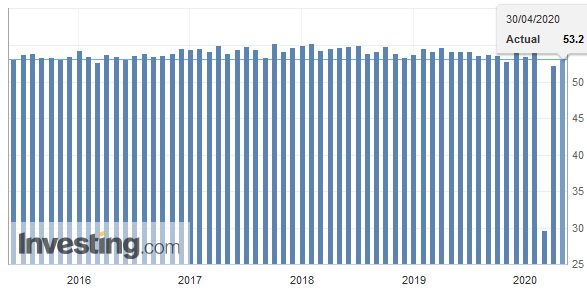 Source: investing.com - Click to enlarge |
Japan reported March industrial output fell 3.7%. Economists had expected a 5% decline, according to the median forecast in the Bloomberg survey. It slipped by 0.3% in February. Retail sales fell 4.5% in March after rising 0.5% in February. Japan has not reported Q1 20 GDP, but the BOJ’s forecast for FY19 projects a contraction of no more than 2.75% in the last three months of the fiscal year. The official report is due May 17.
The dollar is trading just inside yesterday’s range against the yen (~JPY106.35-JPY106.90). There is a set of options between JPY106.60-JPY106.65 for around $1.1 bln that expires today. Another set for about $1.6 bln between JPY107.00 and JPY107.15 also are set to expire today. The US dollar has closed lower against the yen for six consecutive sessions coming into today. When the streak began, the dollar had been turned back from JPY108. The greenback had fallen for the past six sessions against the Australian dollar, but profit-taking is threatening to end that streak today. The Aussie approached $0.6570, its highest level since March 10. Initial support is seen in the $0.6520-$0.6530 area. An option for A$2.7 bln that expires today is struck at $0.6570. The US dollar fell against the Chinese yuan for the third day. The more than 0.3% decline was the largest dollar fall in three weeks. The greenback slipped below CNY7.05, which with few exceptions, has been the lower end of the range since mid-March.
EuropeEurope’s data was dismal. The French economy contracted by 5.8% in Q1, and Spanish output fell by 5.2%. Italy’s economy shrank by 4.7%. The eurozone has a whole reported a 3.8% contraction, though Germany, the biggest economy, does not report Q1 GDP until May 15. |
Eurozone Unemployment Rate, March 2020(see more posts on Eurozone Unemployment Rate, )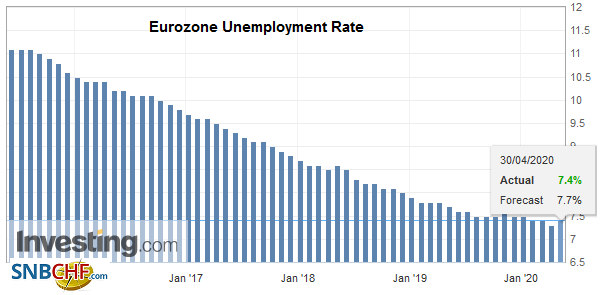 Source: investing.com - Click to enlarge |
| Still, Germany reported a 373k jump in unemployment in April, roughly five times more than the median forecast in the Bloomberg survey. |
Germany Unemployment Rate, April 2020(see more posts on Germany Unemployment Rate, )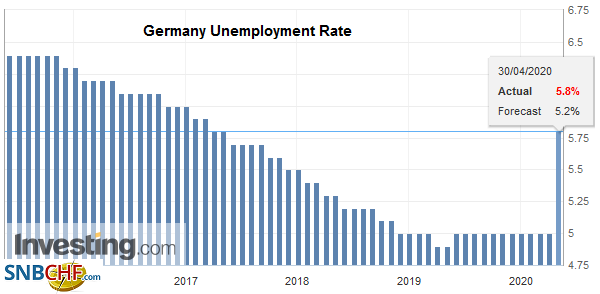 Source: investing.com - Click to enlarge |
| The ECB meets on the heels of the poor data. They are unlikely to have surprised officials. The question is, what else can the ECB do? A couple of ideas have been circulating. One is to increase the amount of bonds it is buying under the Pandemic Emergency Purchase Program currently at 750 bln euros. This seems an issue of timing as at the current pace, it will run out of runway probably in late Q3, which incidentally is when some of the Fed’s programs are anticipated to wind down. Given the expected supply, the ECB will likely want to buy more bonds. However, six weeks after it announced, PEPP might not be the best time to seek a change. Moreover, it does not appear clear whether it needs another 250 bln euros, 500 bln, or 750 bln. It might be able to achieve the desired impact by saying that it anticipates buying more. |
Italy Gross Domestic Product (GDP) YoY, Q1 2020(see more posts on Italy Gross Domestic Product, )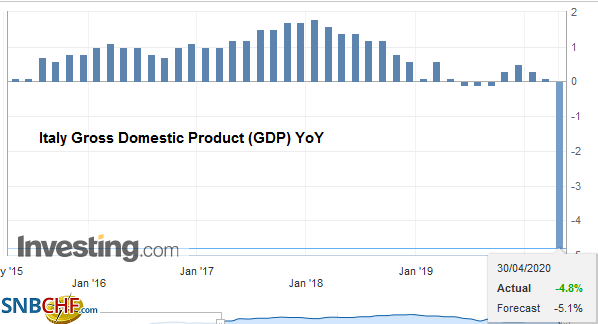 Source: investing.com - Click to enlarge |
| Another idea is to lower the rate on the June TLTRO, which is now set at minus 75 bp. This is seen as innovative because it is below the deposit rate. In essence, banks can take a three-year loan from the ECB at minus 75 bp and deposit the funds with the ECB and pay 50 bp, for a 25 bp subsidy. Italian banks are seen as the most eager users of the facility and bigger subsidy, say 50 bp, would obviously be even more attractive. We suspect that the ECB was sufficiently creative with the dual rate and that a wider gap may be difficult to justify. A third measure that some suggest is for the ECB to indicate it would buy “fallen angels” (until recently investment-grade credit) as part of its asset purchases. The central bank has taken two steps in this direction. It gave sub-investment grade Greek sovereign bonds a waiver, and it indicated it would accept some below investment grade bonds as collateral for loans. Taking junk as collateral means one is willing to own it, but that is still different than buying it outright. Crossing this Rubicon does not seem particularly urgent. As capital distribution is bank-centric in Europe, the focus is likely to remain on encouraging bank lending. |
Eurozone Consumer Price Index (CPI) YoY, April 2020(see more posts on Eurozone Consumer Price Index, )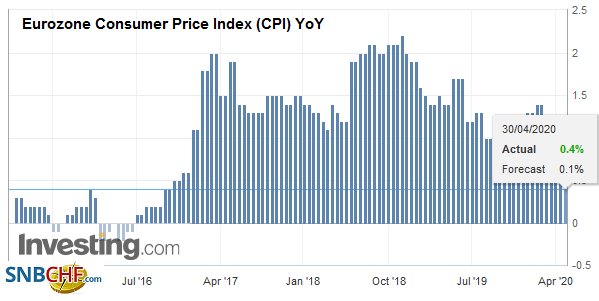 Source: investing.com - Click to enlarge |
The euro approached $1.09 but was turned back. It has not traded above that level since April 16. The risk seems to be on the downside on the ECB day. Initial support is seen in the $1.0840-$1.0850 area, but may not be particularly strong. Better support is likely in the $1.0800-$1.0820 area. Sterling is firm and continues to push against the $1.25 level, which it has not closed above since April 15. A convincing close above it would likely negate the bearish topping pattern is emerging. The high for the week is $1.2520.
AmericaThe Federal Reserve did not surprise. Policy was maintained, and the somber outlook and medium-term risks. Rates would remain near-zero until the central bank was confident that jobs and prices were moving toward their targets. While we had suggested that with key rates below the interest the Fed pays on reserves and the rate at which it conducts reverse repos, there was scope for a technical tweak, The FOMC chose not to make address this issue now, but it is unlikely to go away. Powell warned that the economy may require more support to ensure a robust recovery, and he explicitly played down concerns that the government was spending too much. By underscoring that the Fed was interested in ensuring markets were working, which ironically requires its assistance, rather than asset prices, Powell’s seemingly innocuous comment has far-reaching implications. Contrary to speculation spurred in part by the recent op-ed piece by the former president of the Minneapolis Federal Reserve, Powell showed little inclination to adopt negative interest rates or introduce yield curve control, for that matter. This assessment also seems to imply the Fed interested in buying equities, which would require an act by Congress. |
U.S. Personal Spending MoM, March 2020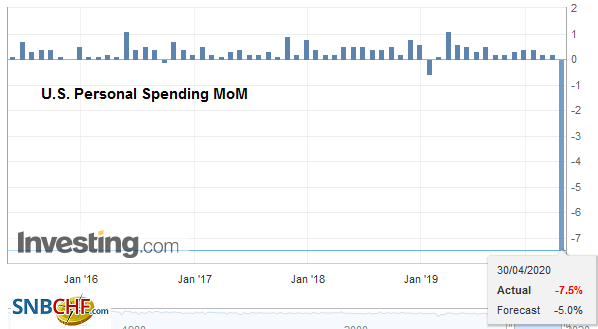 Source: investing.com - Click to enlarge |
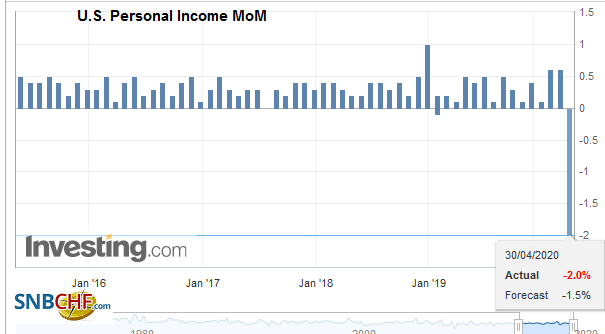
| Yesterday’s Q1 GDP (-4.8% annualized pace) report steals the thunder from today’s release of March’s personal income and consumption data. Income fell sharply and consumption even more. Instead, the weekly jobless claims with command attention. The weekly surge peaked in the last week of March and the first week of April at about 6.9 mln and 6.6 mln, respectively. Last week was likely the third consecutive decline, but around 4.4 mln, the deterioration of the labor market continues. |
U.S. Chicago Purchasing Managers Index (PMI), April 2020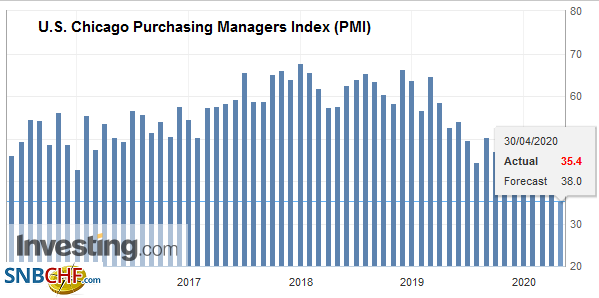 Source: investing.com - Click to enlarge |
| It would bring the cumulative filings over the past six weeks to about 30 mln. Continuing claims (reported with an extra week lag) are approaching 20 mln. On May 8, the April employment report is published, and the early call is non-farm payrolls to have fallen something on the magnitude of 22 mln, with the household survey showing a jump in the unemployment rate toward around 16.5% from 4.4% in March. |
U.S. Personal Income MoM, March 2020(see more posts on U.S. Personal Income, ) |
Canada reports February GDP. It is too dated to be of much interest, but it is expected to have expanded by 0.1%. It would lift the year-over-year rate to 2.2% from 1.8%. Mexico reports Q1 GDP. It is expected to have fallen by a little more than 1%. It would be the fifth consecutive quarter without growth. Meanwhile, the US appears to be getting ready to announce support for the oil sector. It may include bridge loans from Treasury (in exchange for equity?) and possibly an SPV program from the Federal Reserve.
The US dollar is on its lows for the month against the Canadian dollar around CAD1.3855. The next target is near CAD1.3800, the (50%) retracement of this year’s greenback rally. The dollar-bloc currencies have led the move against the US dollar this month, but the Canadian dollar is the clear laggard with a roughly 1.4% gain. The New Zealand dollar is up nearly twice as much and the Australian dollar, almost five times the advance. The Mexican peso is also extending its recovery and is now roughly flat on the month. The US dollar poked above MXN25 last Friday and is now near MXN23.68. Chart support is seen MXN23.25-MXN23.30.
Graphs and additional information on Swiss Franc by the snbchf team.
Full story here Are you the author? Previous post See more for Next postTags: #USD,China,China Non-Manufacturing PMI,ECB,EUR/CHF,Eurozone Consumer Price Index,Eurozone Unemployment Rate,federal-reserve,FX Daily,Germany Unemployment Rate,Italy Gross Domestic Product,newsletter,Norway,South Africa,U.S. Personal Income,USD/CHF


