


Jeffrey P. Snider
My articles My offerMy siteAbout meMy videosMy books
Follow on:LinkedINTwitterSeeking Alpha
|
We certainly don’t have a crystal ball at the ready, and we can’t predict the future. The best we might hope is to entertain reasonable probabilities for it oftentimes derived from how we see the past. Which is just what statistics and econometrics attempt. Except, wherein they go wrong we don’t have to make their mistakes. For example, in the Fed’s main model ferbus there’s no way to input a global dollar shortage. Even if there was, to this statistical construction it would be erased by the improper association of QE with its remedy. Therefore, these eurodollar squeezes we can easily, obviously observe every few years to the model they are “tail risks”, akin to some random unforeseeable event. Repeated tail risks; which can only mean they aren’t really them. No study for kurtosis needs to be applied. We are free to see and recognize the repetition as well as what it might say about what the future might hold. I’m specifically talking about the possibility of another midpoint. I wrote about them back in October when the idea of a global rebound was gaining supporters (and some modest support in sentiment). They are, and had been each of the three eurodollar events before, a fool’s paradise. Very much akin to a dead cat bounce, there seems to be this repeating underlying pattern which by the convention of random statistics just shouldn’t happen. I won’t get all fractal here, but there are legitimate reasons why a complex system would be so…predictable. |
Benchmark 10-year UST, 2010-2013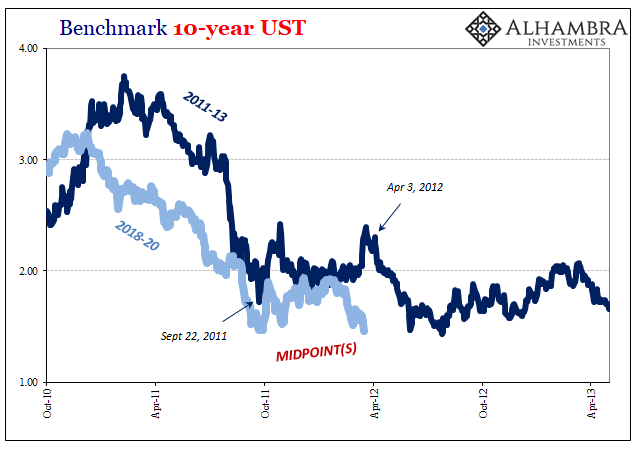 - Click to enlarge |
The question for October 2019 was if it had; for a fourth time. I wrote then:
Again recognizing that we don’t have that crystal ball, it would likewise have been a mistake not to recognize all the signposts advertising the high degree of probability. If the last several months were not Euro$ #4’s midpoint than they did one hell of job faking it. |
Benchmark 10-year UST, 2014-2016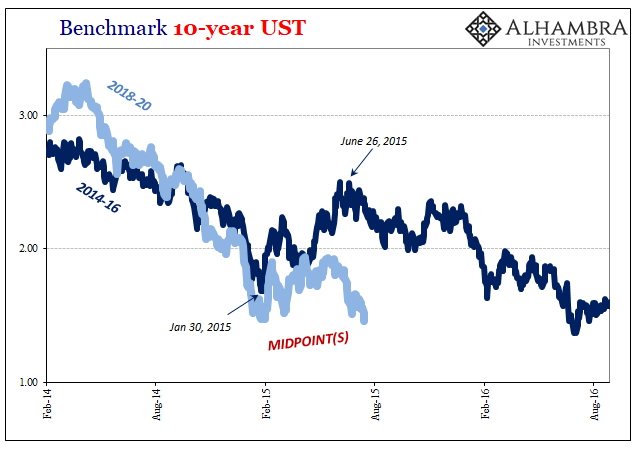 - Click to enlarge |
| Near enough to everything about them was consistent with another great Euro$ headfake (as Richard Fisher once said, perhaps the only thing about money he’s ever gotten right in his career). The midpoint is more like a pause, very distinct from a rebound. There was too much of a pause late in 2019 and almost nothing of a rebound (a real one, anyway).
And since the midpoint is the point in between two phases of the same eurodollar squeeze, then what might be happening now could be consistent with the typical second part. In the last three, that’s been the stage when the real economic and financial damage comes out. |
US PMI's & GDP, 2012-2020 - Click to enlarge |
| Like a boxer who is initially stunned by a good punch, phase one, he might retreat at first, the midpoint, taking stock before then going back for more not realizing his rough shape has left him less prepared and able to absorb the next one – while at the same time increasing his chances that he’ll get clobbered again, phase two.
And when that second one comes, the fight’s over. What we can’t know at the midpoint is whether that means a TKO (near recession) like in Euro$ #2 and #3, or something closer to a full-on KO if maybe not as bad as Euro$ #1. In any case, the more time passes the more it sure looks like the midpoint – and it’s starting to look like the midpoint has now passed, too. If so, then it’s on to Phase 2. With the UST and eurodollar curves back at where they were at the end of August when the R-word was everywhere, and |
US Treasury Curve, 2018-2020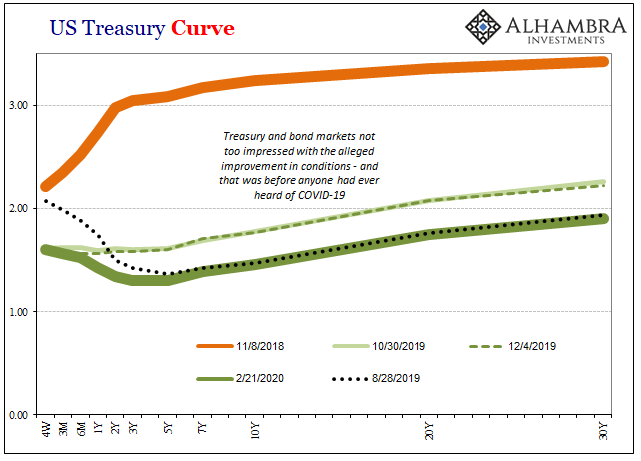 - Click to enlarge |
| with Markit’s PMI data, it sure seemed today like we’ve moved on to Phase two. |
Eurodollar Futures Curve, 2019-2024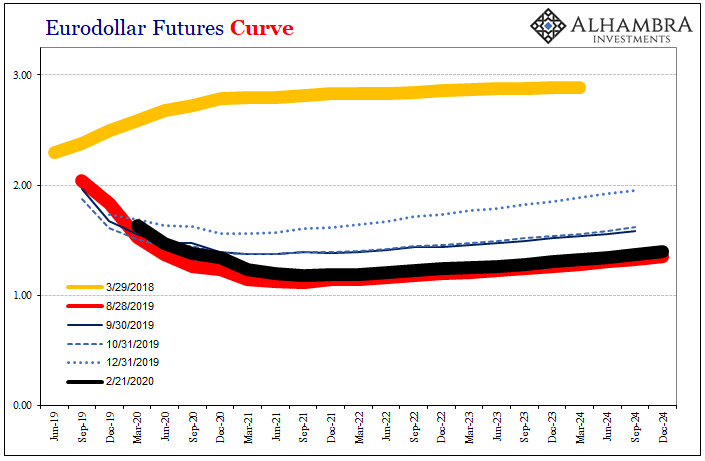 - Click to enlarge |
Full story here Are you the author?
Tags: bond yields,Bonds,currencies,economy,Euro$ #4,eurodollar futures,eurodollar futures curve,Federal Reserve/Monetary Policy,Interest rates,Markets,newsletter,U.S. Treasuries,Yield Curve


