These things are actually quite related, though I understand how it might not appear to be that way at first. As noted earlier today, the Fed (yet again) proves it has no idea how global money markets work. They can’t even get federal funds right after two technical adjustments to IOER (the joke).
But as esoteric as all that may be, recent corporate statements leave much less doubt at least as to the primary effect. Before the FOMC gave up on the boom, company bellwethers like FedEx beat them to it.
Corporate giants doing business abroad are painting a dreary picture of the world’s economy…This week, top executives at FedEx, BMW, UBS and others described bleak global business conditions while discussing quarterly results. Fitch Ratings also “aggressively” cut its forecast for the year.
The head of UBS was among the latest to blame the world’s backdrop for weaker-than-expected results. CEO Ermotti told a conference in London on Wednesday that it “one of the worst first-quarter environments in recent history,” Reuters reported.
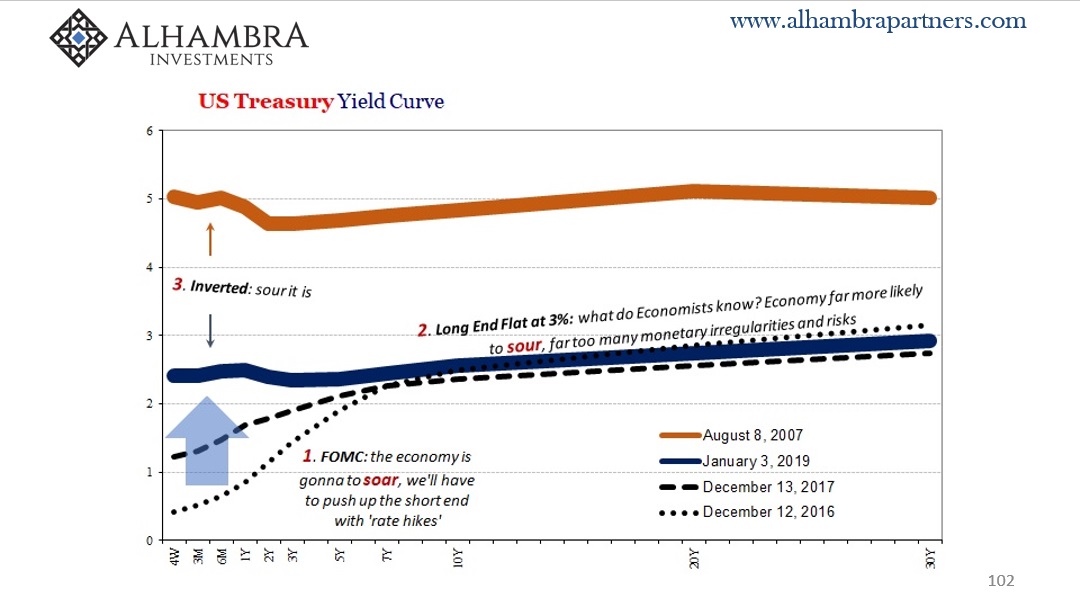
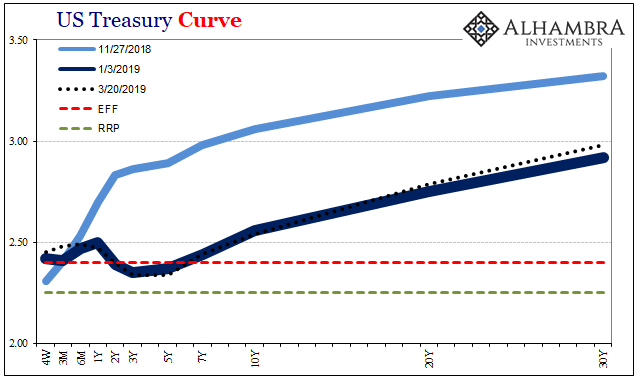
| Economists would do well if they would ever learn to curve (stop it with the ridiculous one-year forwards and term premiums nonsense). The bond markets have been saying all along that this was the way it was going to turn out. The reason: liquidity risks. These are high, unusually high because of that one thing. The Federal Reserve has no idea what it takes to fix the broken monetary system (they can’t even get the simplest part right).
QE’s and bank reserves didn’t accomplish a thing. In light of recent EFF and repo events, officials are turning to more bank reserves. Brilliant. |
US Treasury Yield Curve |
| If you thought that was bad enough, things are still taking a turn for the worse. Having more and more considered a downside scenario and the growing probability for it, attention is now focused on depth and duration.
There are a couple things worth noting along those lines, in addition to the yield or eurodollar futures curves. TIPS yields, for example, are a composite of inflation perceptions balanced against the nominal environment. In other words, the 5-year TIPS yield is the 5-year UST nominal minus what the market assumes is average inflation over the duration of the instrument (since you get compensated by the US Treasury for the CPI). |
US Treasury Curve(see more posts on US Treasury, ) |
| That remainder can be thought of as “real” growth expectations. My interests tend toward the monetary and therefore inflationary side of TIPS. My colleague Joe Calhoun (correctly, as usual) takes the broader approach when assessing those “real” yields, too. Guess what they’ve been doing all during this Fed “pause.” |
TIPS Yields & Breaks 2016-2019 |
| Growth expectations in the bond market have been collapsing, pretty much what the CEO of UBS as well as the earnings report from FedEx have been talking about. Inflation expectations must therefore rise to offset them; because nominal UST yields have run into a roadblock of sorts: |
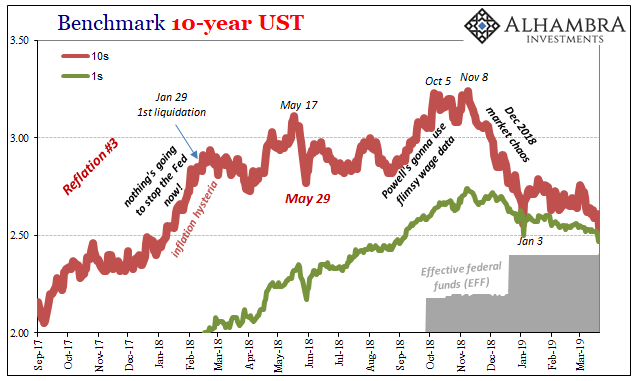
Benchmark 10-year UST 2017-2019 |
| As noted before, I believe UST rates would be falling faster and farther (like in Germany or Japan) if Jay Powell had been more honest (or capable, really) in reading the economic situation. The short end is in the way, to put it mildly. More and more, however, that is proving to be less of a problem.
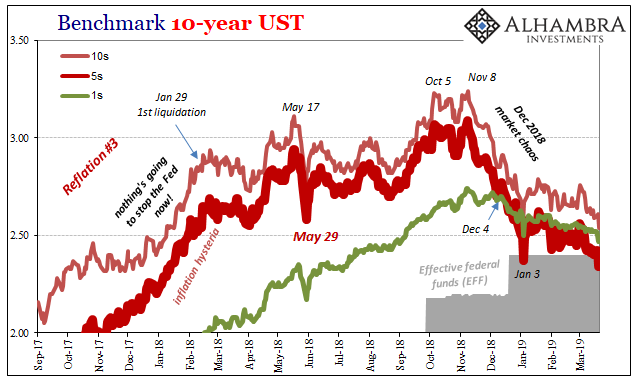
With the belly of the UST curve now regularly falling below EFF, the market is becoming comfortable, for lack of a better term, with this upside down situation. Risks, in other words, are being perceived as still rising and therefore overwhelming the natural tension/shape of the yield curve keeping it from whole-hearted collapse. |
Benchmark 10-year UST 2017-2019 |
| If, rather when UST yields push through the ST “boundary” then you’ll likely see both inflation breakevens as well as “real” TIPS yields decline in concert. For now, the short end is holding up the nominal topside, leaving inflation breakevens to follow along with oil.
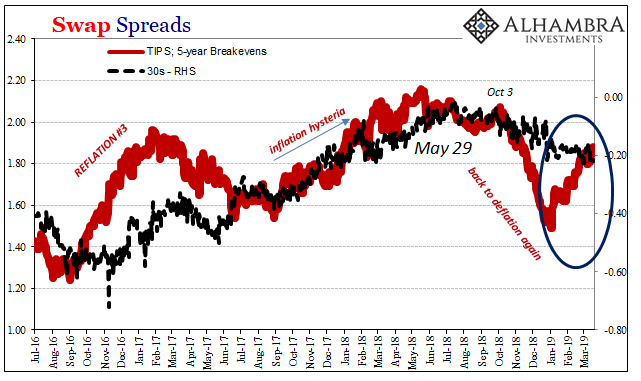
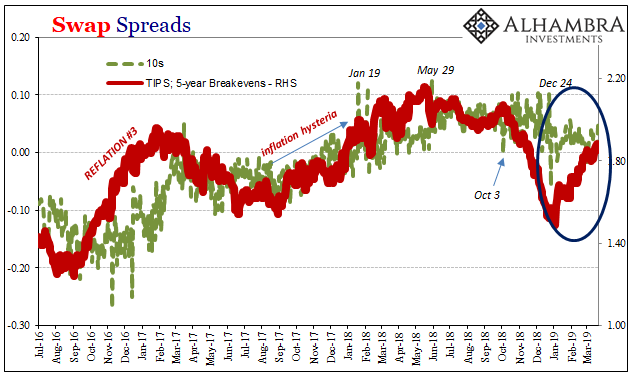
This view is corroborated by indications like swap spreads. The Fed pause never once registered in them, only the falling growth expectations. Swap spreads are, essentially, an indirect measure of balance sheet capacity especially when they are negative. The 10s are right on the boundary from falling below zero again (even the 5s were edging closer to the netherworld this week). |
Swap Spreads 2016-2019 |
| Economists and central bankers the world over misinterpreted Reflation #3; they really did, and a lot on purpose. They specifically talked up “globally synchronized growth” trying more so to make it happen rather than out of an honest assessment of the shape of the global economy as it really was. If this was a game of poker, the flat curve in 2017 was the bond market calling their bluff. |
Swap Spreads 2016-2019 |
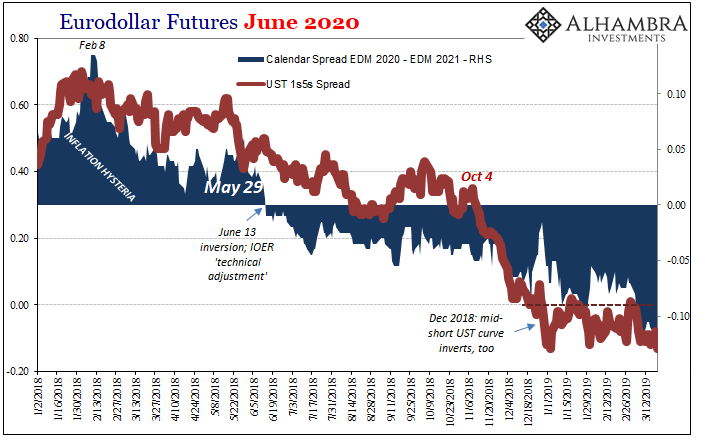
| The FOMC meeting this week was Jay Powell showing his weak hand (again, he can’t even get EFF right). What comes next is markets assessing what it means with the Fed totally out of the game. The initial inclination, falling real yields, obviously isn’t a good one. And as recent corporate news projects, it’s not limited to being a market-driven curiosity.
Monetary breakdown to financial chaos to economic downturn. |
Eurodollar Futures June 2020(see more posts on EUR/USD, ) |
Tags: Bonds,currencies,economy,EFF,EUR/USD,eurodollar futures,Federal Reserve/Monetary Policy,inflation breakevens,inflation expectations,interest rate swaps,Markets,newsletter,TIPS,U.S. Treasuries,US Treasury,Yield Curve


