


Joseph Y. Calhoun
My articles My siteAbout meMy videosMy books
Follow on:LinkedINTwitterSeeking AlphaAmazon
The secret of health for both mind and body is not to mourn for the past, nor to worry about the future, but to live in the present moment wisely and earnestly.
Buddha
Review
It’s that time of year again, time to cast the runes, consult the iChing, shake the Magic Eight Ball and read the tea leaves. What will happen in 2019? Will it be as bad as 2018 when positive returns were hard to come by, as rare as affordable health care or Miami Dolphin playoff games? Will China’s economy succumb to the pressure of US tariffs and make a deal? Will the Fed keep hiking rates? Or will they be forced to cut to stave off a recession? Will the Dow keep jumping in 1000 point increments? Will Europe hold together a while longer or will Italy blow the whole project? And who will dare to coach the Dolphins next year?
All interesting questions and ones that can only be answered truthfully with the three hardest words in investing (and life): I Don’t Know. I didn’t know what was going to happen in 2018 and I have no more clarity about 2019. Luckily for me no one else saw the Mack truck of volatility that hit markets last year either. Who predicted that almost every major asset would be down on the year, some by bear market proportions, despite 3% GDP growth? Who predicted that gold would outperform all the major stock indexes except the NASDAQ – but still be down for the year? Did anyone predict the 25% drop in crude oil and the 13% rise in natural gas prices?
Predict the future? We can’t even agree on the present. Is this a bear market? The S&P 500 fell 19.8% peak to trough on a closing basis but the usual marker for a bear is -20% and the market only breached that level on an intra-day basis. So, does that qualify? Did the S&P already have a bear market? Close enough if you ask me and besides there were plenty of markets that breached the -20% level at some point in the year. US small cap stocks, emerging market stocks, crude oil, Japanese stocks, the EAFE index of foreign developed markets, Hong Kong stocks, European stocks, timber, the Goldman Sachs commodity index and Chinese stocks all entered bear market territory at some point during 2018. And that is a partial list for sure. So, let’s just say that it wasn’t a good year no matter where you parked your cash unless it was all in CDs or short term bonds of some type.
Further clouding the outlook for 2019 is the basic fact that we can’t even say for sure why all these assets fell last year. In some cases we can point to things that seem obvious – Chinese stocks fell because of tariffs – but even in those cases the accepted explanation often comes up wanting. The most widely cited explanation for US stock weakness has been a slowing US economy but actual evidence of that is pretty hard to find. Politics is also often cited as an explanation but the divided government ushered in by the mid-term elections has in the past been pretty bullish for stocks. Gridlock is good.
The Fed’s rate hiking campaign has also been cited frequently as a cause but the pace of hikes has been leisurely to say the least. Is the economy really so fragile that it can’t handle a 2.5% Fed Funds rate? For that matter, with almost no volume in the Fed Funds market, does it really even matter? Isn’t the positive of higher interest rates for savers potentially an offset to higher rates for borrowers? The Fed’s balance sheet reduction has also been cited but if anyone can draw a direct connection between the balance sheet and the stock market I’d like to hear it. Charts showing the balance sheet superimposed over the S&P 500 don’t count. Correlation isn’t causation.
So, why do we waste so much time trying to predict the future? Why do we read all these outlook pieces year after year? It sure isn’t because they’ve been so accurate in the past. Of the 19 Wall Street strategists tracked by Bloomberg last year exactly none of them predicted the right direction for the US stock market much less the magnitude of the move. As a group they predicted the S&P 500 would be up 8% in 2018, a miss of double digit proportions. As a group, these strategists haven’t predicted a down year this entire century. And they aren’t any less bullish on 2019 with a median predicted gain of 19%. If they turn out to be right it will be sheer luck.
It is this obsession we have with trying to predict the future that gets us off track, convinces us that there is some magic strategy or strategist who will tell us where exactly we should be investing TODAY. Adjusting your portfolio based on what someone thinks will happen in the future is a recipe for failure. Your investment strategy shouldn’t change because some crystal ball gazer on Wall Street puts out a bullish – or bearish – outlook. Tactical changes – alterations based on short term considerations – are different but even then, you need to make changes based on evidence. The latest report from a brokerage firm doesn’t qualify.
If the market gyrations last year caused you angst, you probably need to reassess your strategy. That doesn’t mean you need to change your strategy completely. If you held a diversified portfolio of different assets – global stocks, bonds, real estate and commodities – you might need to put more in bonds and less in risk assets but you still need to stay diversified. Despite owning most of those things that went down last year – that was kind of hard to avoid if you owned a diversified portfolio – Alhambra’s moderate portfolios were only down low to mid single digits last year (results vary depending on various factors). That is true because our moderate portfolios had 50% in bonds, a position that everyone hated until bonds rallied and stocks tanked in the fourth quarter.
You should also probably consider that this selloff in risk assets was actually pretty mild. A 20% correction is just that, a correction. Corrections – a drop of more than 10% but less than 20% – happen roughly every 18 months or so. Real big bear markets are usually – but not always – associated with recessions. Just in case you’ve forgotten the S&P 500 fell by roughly half in the last two recessions and I have no doubt the next one will produce a similar result. So, if this correction caused you to lose sleep, imagine how a drop of double or even triple this one would make you feel. Your strategy needs to take into account worst case scenarios and this wasn’t it.
At Alhambra we don’t waste our time trying to predict the future. We can’t do it and neither can anyone else. We do make tactical changes to our portfolio but they are infrequent and rely on market based indicators. In other words, instead of trying to predict markets, we observe and interpret. What we see right now isn’t the stuff big, bad bear markets are made of.
Tactical Considerations
If tactical changes are to be part of your investment approach, you need to make sure you are making changes that are rooted in reality rather than just an emotional shift. Has the market selloff since October been driven by real changes in economic variables or is it just another one of those periodic spasms of fear or greed that seem to grab the market every so often? Crowds can have wisdom but all of them aren’t endowed with the same IQ. The stock market tends to be driven much more by emotion than the bond market and it can be wildly off base at times, pricing in a future that is unlikely at best and impossible at worst. What’s been happening over the last three months, in my opinion, is a repricing of stocks to match a more sober future than the one anticipated by stocks a year ago.
Stock investors last year and early this year seemed to be pricing in a permanent return to 3%+ real growth in the US. Bond investors also priced in some extra growth, but not nearly to the same degree as stock punters. Reality it seems is now setting in with the equity crowd. What looked like a sure thing earlier this year, when Q2 GDP growth punched in over 4% and Q3 around 3%, is now looking a little iffier. I have warned all year that some of that Q2 and Q3 growth was just front running of future tariffs but the bulls didn’t want to hear it. Now, with US companies renting truck trailers to store inventory (see here), they are starting to pay attention. The recent stock market selloff is merely a repricing of stocks to reflect a return to the pre-Trump new normal rate of growth.
EconomicsThe bond market never bought into the Trump new normal, the idea that the US can and will grow at over 3% given the right policies. Bond yields rose early in the year as inflation looked a little hot but now oil prices have given back all their early year gains and then some; inflation expectations have collapsed. What is interesting though is that real growth expectations haven’t come down that much. Real interest rates (TIPS) have barely budged even as the nominal 10 year Treasury note has rallied over 50 basis points since the beginning of October. We use TIPS and nominal 10 year yields to judge real growth and inflation expectations. The direction and magnitude of change provide information about how the market’s expectations are changing. Expectations for growth and inflation both peaked in early October but since then the drop in inflation expectations has been quite a bit greater than the drop in growth expectations. The nominal bond yield has dropped over 50 basis points while TIPS yields only dropped about half that. For the full year the 10 year TIPS yield rose 54 basis points while the nominal 10 year Treasury note yield rose just 29 basis points. Those are both fairly minor changes but the context is that growth expectations rose while inflation expectations fell. If you think about that for a minute you’ll start to wonder what all the fuss is about. Lower inflation and higher growth are kind of what we’re after isn’t it? Throughout 2018 I wrote repeatedly that the economy wasn’t changing that much and I think that has proved pretty accurate. Stock investors overreacted to the tax cuts for most of this year and the recent sell off was just a return to reality. The 10 year yield is barely changed from where it was 2 years ago. The move down in 2017 and the move up in 2018 were both just so much noise. The economy wasn’t as bad as it appeared when rates were testing 2% nor as good as hoped when rates were 3.25%. I’ve said consistently, the entire time, that the economy’s growth profile hasn’t changed. |
10-Year US Treasury Yield 2016-2018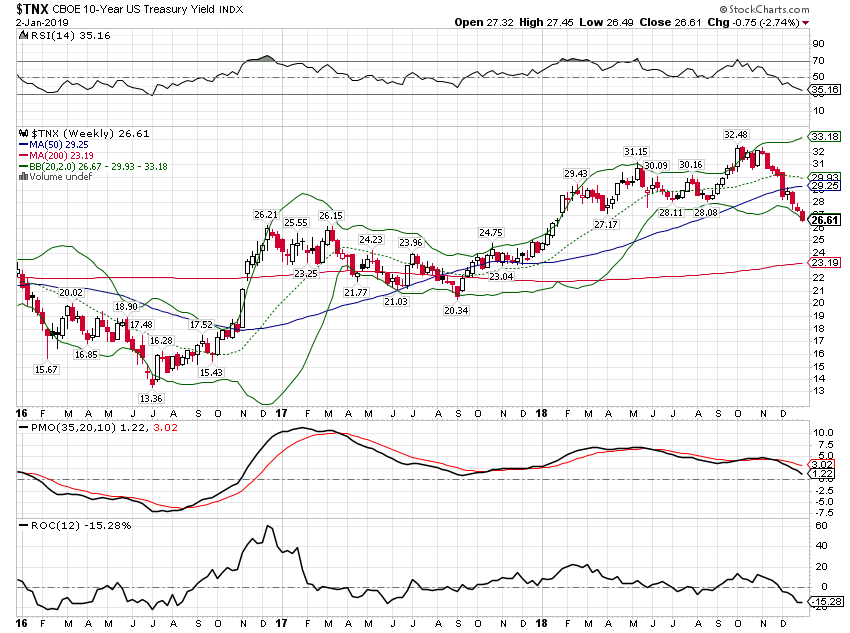 - Click to enlarge |
| Real interest rates (10 year TIPS) haven’t dropped as much as nominal rates recently. That means inflation expectations have collapsed but real growth expectations have only fallen modestly. |
10-Year Treasury Inflation-Indexed Security 2014-2018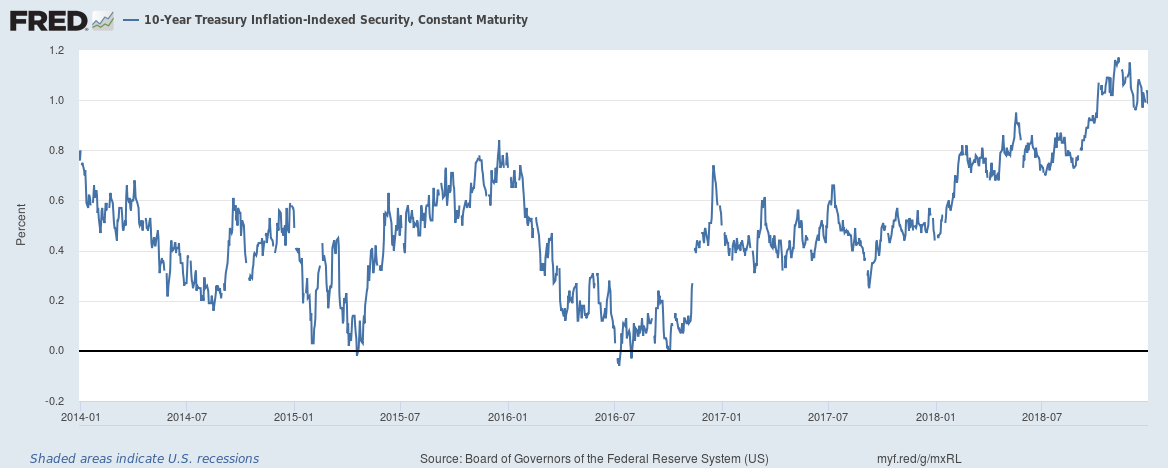 - Click to enlarge |
| While real growth expectations have risen slightly, real rates are still below the bottom of the range in the previous cycle. The Fed has done a lot since the great financial crisis of 2008 but when it comes to the real economy their efforts have largely gone for naught. |
10-Year Treasury Inflation-Indexed Security 2004-2018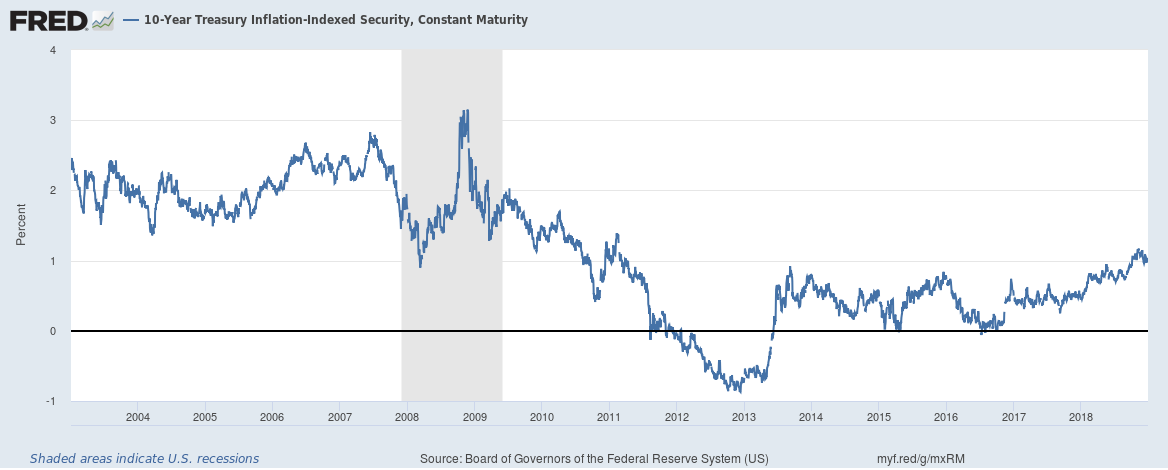 - Click to enlarge |
| Inflation expectations have fallen rather precipitously recently with investors now expecting annual inflation to average just 1.7% for the next decade. Again, not much has changed. That isn’t significantly different than expectations at the end of 2014. |
10-Year Breakeven Inflation Rate 2013-2018 - Click to enlarge |
|
The yield curve also got a lot of attention this year. Everyone seems to have latched onto the yield curve as the definitive recession indicator, absolutely certain they know what it means and that even with everyone watching it will act as it always has and conveniently invert before the next recession. Here’s a news flash for you – there are no definitive recession indicators and the yield curve does not have to invert prior to recession. In fact, I’d bet that one of two things is about to happen. Either the curve will invert and we won’t get a recession – at least not before we see numerous articles about how the yield curve is no longer a good recession indicator – or we’ll get a recession without the yield curve inverting at all. The yield curve has steepened slightly recently but the trend is still toward flattening. That is nothing more than normal behavior that we see in every business cycle. The curve hasn’t inverted but that isn’t the recession signal anyway. As usual, people are watching the wrong thing like a hawk. Recession will be signaled by a rapid steepening as the market anticipates Fed easing. We aren’t there yet. |
Yield Curve - 2 Year Bonds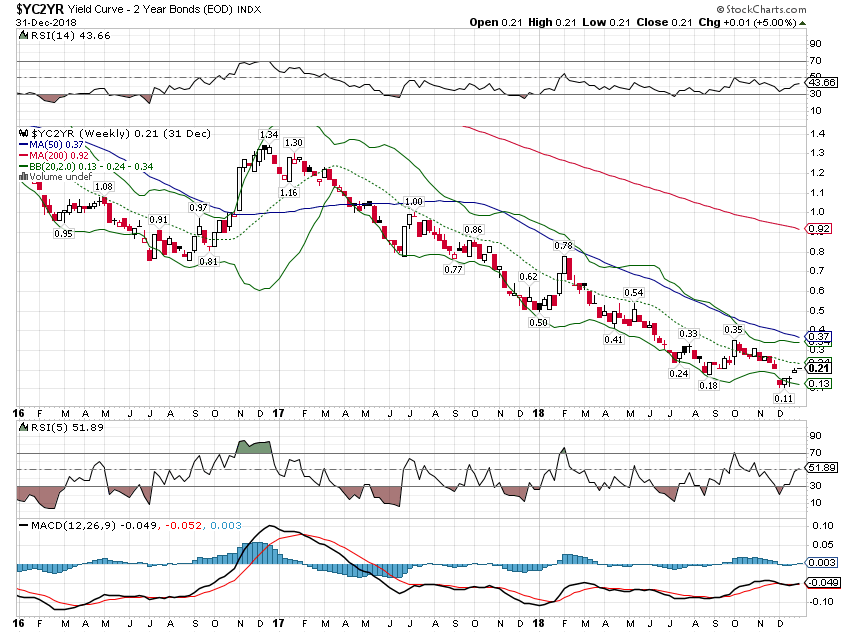 - Click to enlarge |
| The recent steepening was due to a drop in the 2 year note yield but the market is still expecting another hike later in 2019. I have my doubts but we’ll see. For now the steepening is minor and recession isn’t a concern. |
2 year US Treasury Yield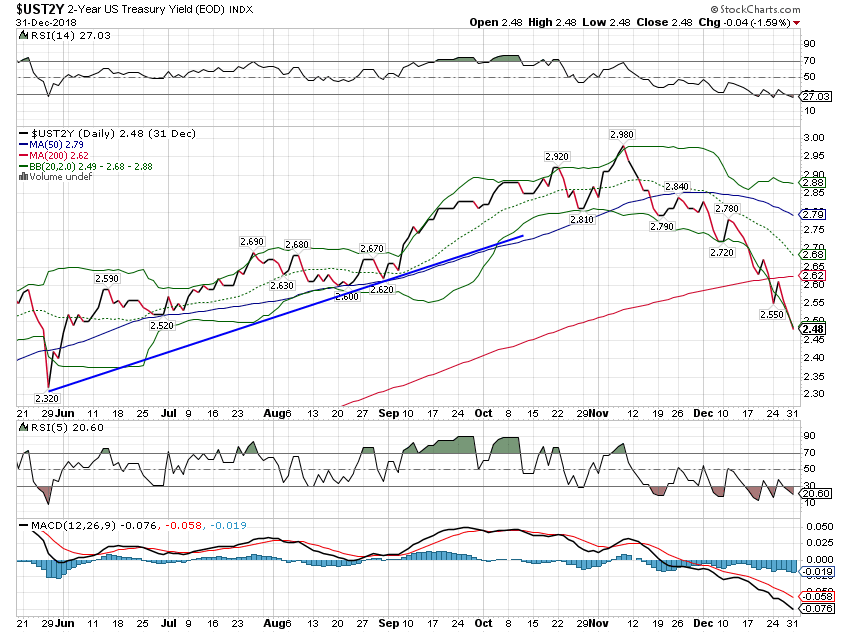 - Click to enlarge |
| Another major economic indicator we use is credit spreads, the difference between junk bond and Treasury yields. As often happens during stock market corrections, spreads have been widening recently. But the widening is minor so far compared to what we just experienced in 2015-16 – which didn’t develop into a recession. The worst performing sector of the bond market then was energy and that hasn’t changed. Low oil prices are now a negative for the US economy.
Credit spreads have moved wider but so far it is fairly contained. Further widening may require a further drop in oil prices. Overall the corporate bond market – investment grade and junk – is a source of considerable concern for us. US consumers may have deleveraged some since 2008 but corporations have gone the other direction in a big, big way. |
US High Yield Master II Option-Adjusted Spread 2012-2018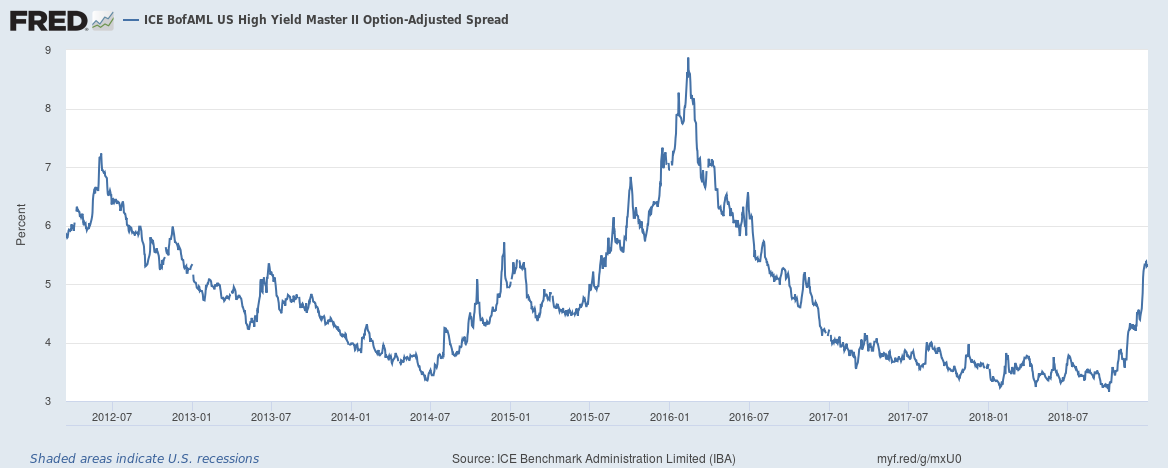 - Click to enlarge |
| The link between crude oil and the economy can be seen in the above chart that shows the 10 year Treasury note yield in blue. When crude falls so do growth and inflation expectations; yields fall.
A very broad based indicator of economic growth is the Chicago Fed National Activity index. The CFNAI is a weighted average of 85 separate economic indicators. It is constructed to have an average value of zero which is meant to indicate an economy growing at trend. The indicator fluctuates between 1 and -1 with a positive read indicating growth above trend and a negative read indicating growth below trend. To smooth out month to month fluctuations we use a 3 month average. A 3 month average of -0.75 is a warning of imminent recession. The value today is 0.12 or growth just above trend. |
Light Crude Oil 2017-2018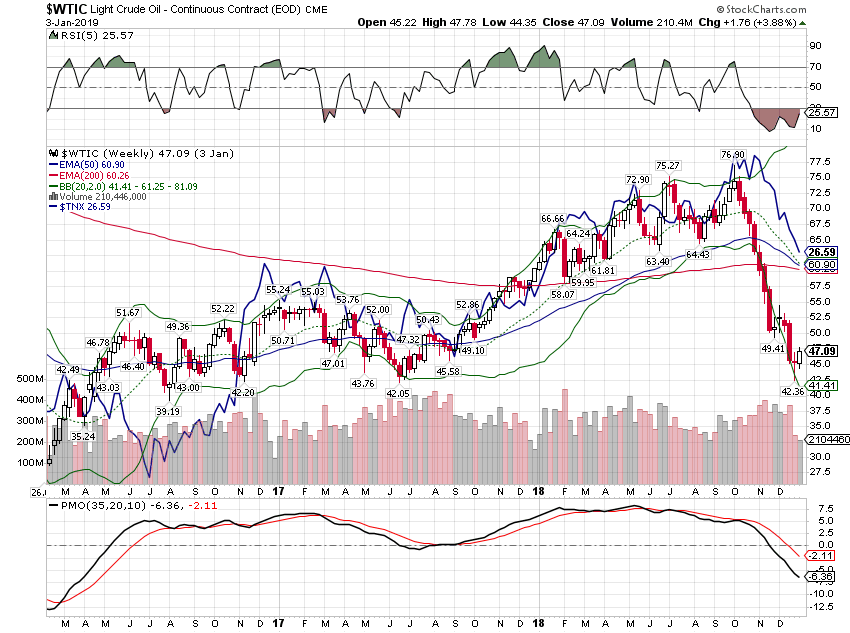 - Click to enlarge |
| The 3 month average of the CFNAI was at 0.08 in January and ended the year at 0.12. The highs were up around 0.4 but the lows never dipped into negative territory. Again, like credit spreads, the current reading shows an economy that has slowed much less than in 2015-16.
The US economy appears to be slowing some but so far the slowdown is very mild, not even as bad as a couple of years ago – which was not a recession. If investors have been selling stocks because they fear a recession, there is nothing in our indicators right now to support that belief. The economy, as I’ve said through this entire period, is still growing right around trend which is closer to 2% than 3%. Investors who pushed stock prices and interest rates higher in anticipation of an extended period of higher growth are now correcting that mistake. |
Chicago Fed National Activity Index 2014-2018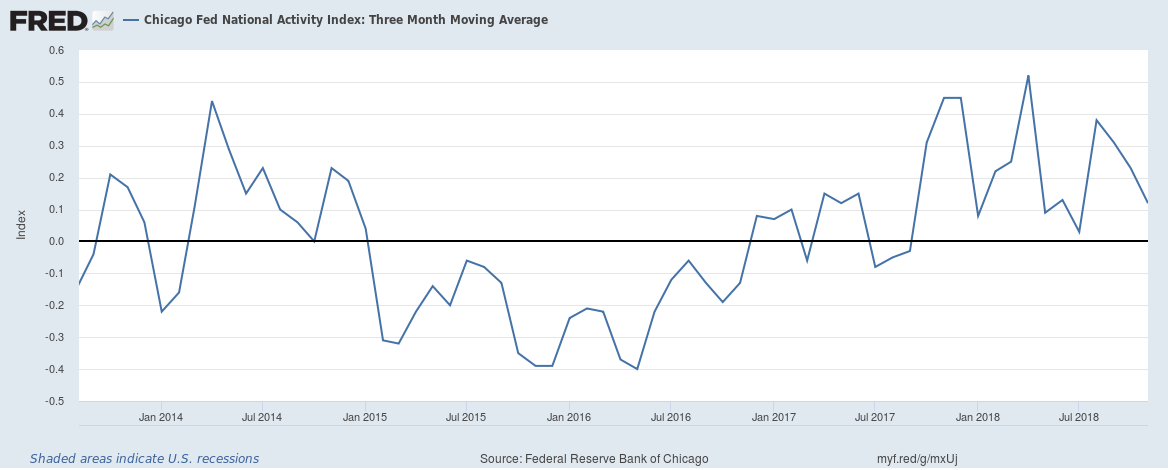 - Click to enlarge |
MomentumLong term momentum for stocks has turned negative. That might sound like a statement of the obvious but our long term momentum signals don’t change very often and in this case not until the end of November. From my Global Asset Allocation update on November 19th:
The closing low for the S&P 500 in December was 2351 so markets have fulfilled that expectation. We don’t pay a lot of attention to technical analysis per se but we do pay a lot of attention to long term momentum shifts. After the early February correction US stocks subsequently made new highs. But momentum didn’t and that divergence was a warning that we noted in that November report. I don’t know whether this is the beginning of a larger bear market. I don’t think recession is imminent but that can change quickly and as I said above we can get a bear market without a recession. And there are other reasons to be concerned about US stocks. First on that list is valuations which are still quite dear even after the correction. There are some earnings measures that make stocks seem cheap but those are notoriously unreliable at turning points. Price/sales ratios are more reliable indicators and are still near all time highs; price/earnings ratios only appear low because profit margins remain at all time highs. If that changes – due to rising wages or, ahem, tariffs – then stocks will not look so cheap anymore. For now, stocks are very oversold and a bounce is likely but with long term momentum turning lower, caution is still warranted. Don’t assume a rally means all clear and hew highs here we come. After the recent sell off, the S&P 500 is back to where it was about 18 months ago. Weekly momentum never confirmed the return to new highs in September, making a lower high after peaking in late January. Stocks are very oversold and I expect a rebound. Whether that is a rally in a developing bear market or a run to new highs is yet to be determined. |
S&P 500 Large Cap Index 2017-2018(see more posts on S&P 500 Large Cap Index, )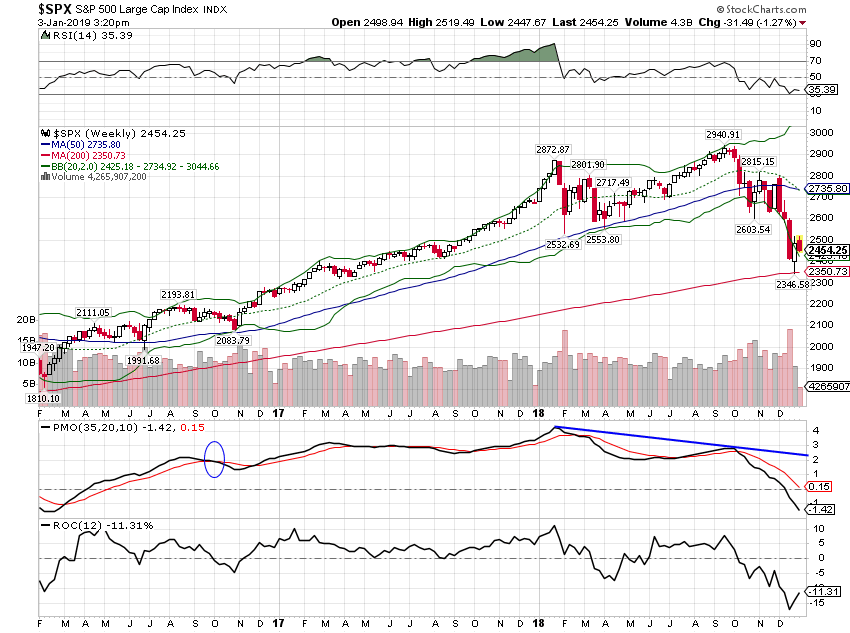 - Click to enlarge |
| Monthly RSI made an all time high in late January, an epic overbought reading. Monthly momentum is now fully negative but we are also at the 50 month moving average which has acted as a trend line for the entire bull market. I should point out that monthly momentum sell signals, such as we got at the end of December, are pretty rare. This is only the fourth sell signal since 1994: late 1999, late 2007, early 2015 and today. Not very comforting. |
S&P 500 Large Cap Index 2007-2019(see more posts on S&P 500 Large Cap Index, )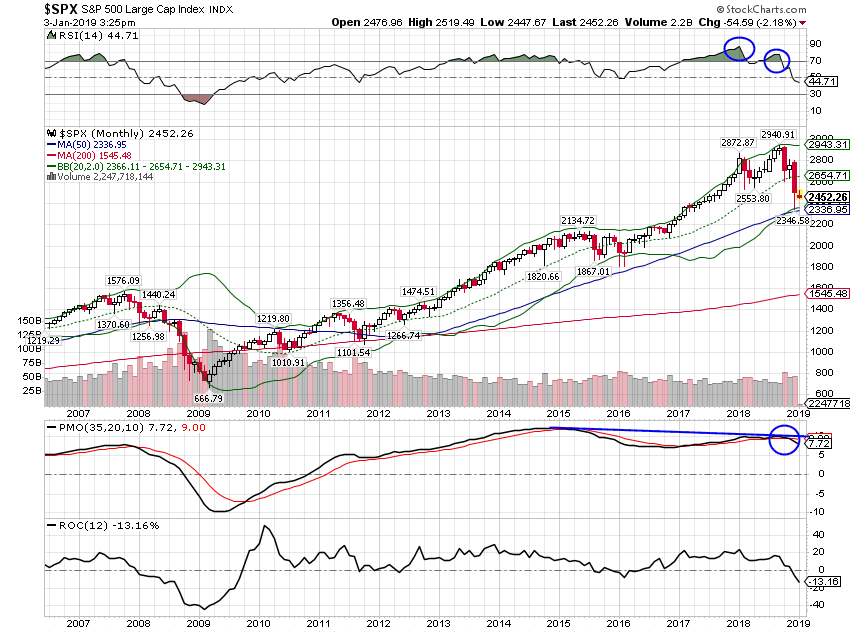 - Click to enlarge |
| REITs haven’t made much progress the last few years but they outperformed the S&P 500 during the latest correction and since the lows in 2009. Still momentum is negative, as it has been for most of this cycle that has preferred common stocks. If rates stay low that may change.
One trend I’ve been watching is the shift in momentum from stocks to commodities. The US dollar index peaked at the beginning of 2017 but enjoyed a counter-trend rally for most of 2018. Now momentum is turning lower as growth expectations between the US and the rest of the world equalize. It isn’t coincidence either that the Dollar index turned lower almost immediately after President Trump’s election. He has made no secret of his desire for a weaker dollar which he believes will aid his efforts to reduce the trade deficit. He could certainly be right but only if his policies produce a recession which is the only times we’ve seen the trade deficit “improve” over the last few decades. Talk about pyrrhic victories. One other thing all the weak dollar advocates should consider is that weak dollar periods are inevitably followed by crisis. The Plaza Accord signed in 1985 was an agreement to reduce the value of the dollar versus the German Mark and the Japanese Yen in an effort to reduce the US trade deficit (politicians didn’t understand current account deficits then either). The result was a 50% devaluation of the dollar, the crash of ’87, the S&L crisis, the Japanese bubble and collapse, the Iraq invasion of Kuwait, a US recession and the lowest interest rates in generations in the early 90s. The last weak dollar period from 2002 to 2008 produced, well, 2008. Careful what you wish for President Trump. |
IShares U.S. Real Estate 2017-2018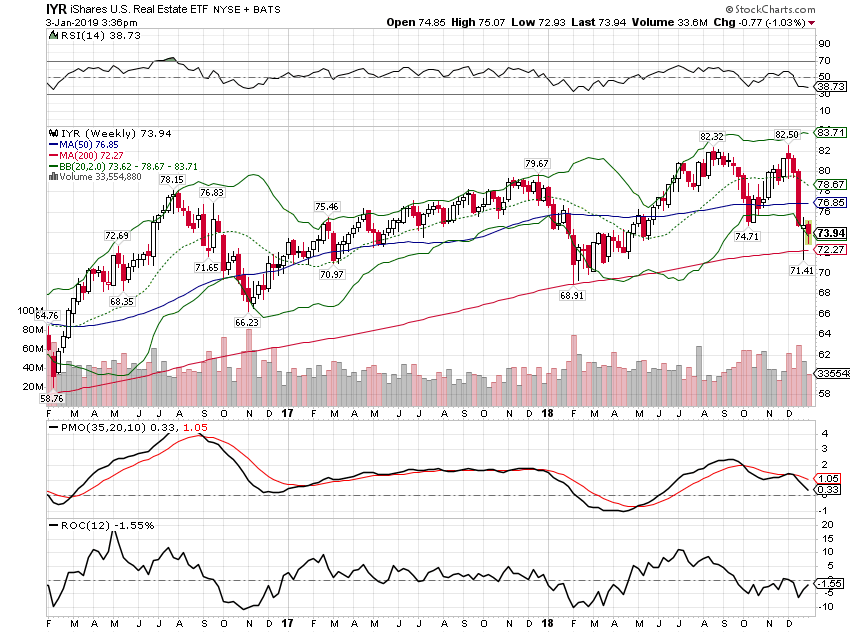 - Click to enlarge |
| The transition of momentum from stocks to commodities has been ongoing for three years. I expect this to accelerate in the years ahead as the dollar turns lower. |
S&P GSCI Commodity Index / S&P 500 Large Cap Index 1999-2019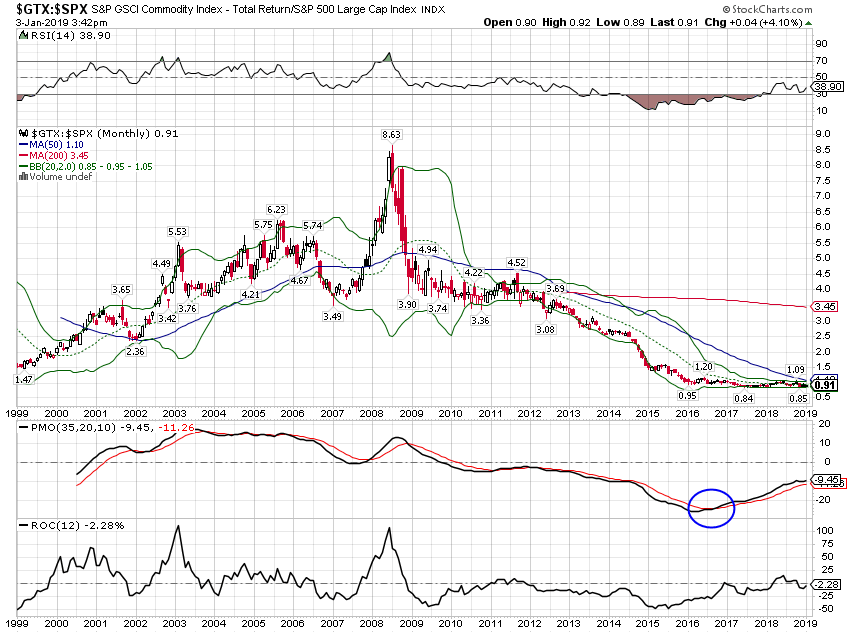 - Click to enlarge |
| Daily momentum has already turned negative for the dollar index and weekly is heading in that direction. The dollar was fairly strong in 2018 but momentum is shifting with daily and weekly measures negative already. Monthly momentum is barely positive and I expect it to follow the shorter term measures.
The strength of the dollar last year was driven by the perception that the US economy was accelerating and performing much better than the rest of the world. That perception has been dented a lot over the last three months as US stocks basically just caught up with the rest of the world. And I expect the dollar to ultimately head lower for one simple reason – President Trump. There is a lot of focus on whether the US and China will come to a trade deal but I think that misses the point to some degree. Whatever deal the President ultimately gets out of China – assuming he agrees to one and his political troubles seem to dictate that he will – it will not “solve” our trade deficit. Our current account deficit is driven by our own lack of savings and our status as the world’s reserve currency. No deal is going to change that. So, when the trade deals and tariffs don’t reduce the deficits what will President Trump do? I think the answer is obvious – he’ll return to pushing for a weaker dollar. The administration might phrase that as pushing for a stronger Yuan and a stronger Euro or Canadian dollar or Mexican Peso but that amounts to the same thing. And a weaker dollar will have big implications for investors. |
US Dollar Index 2016-2018(see more posts on US Dollar Index, )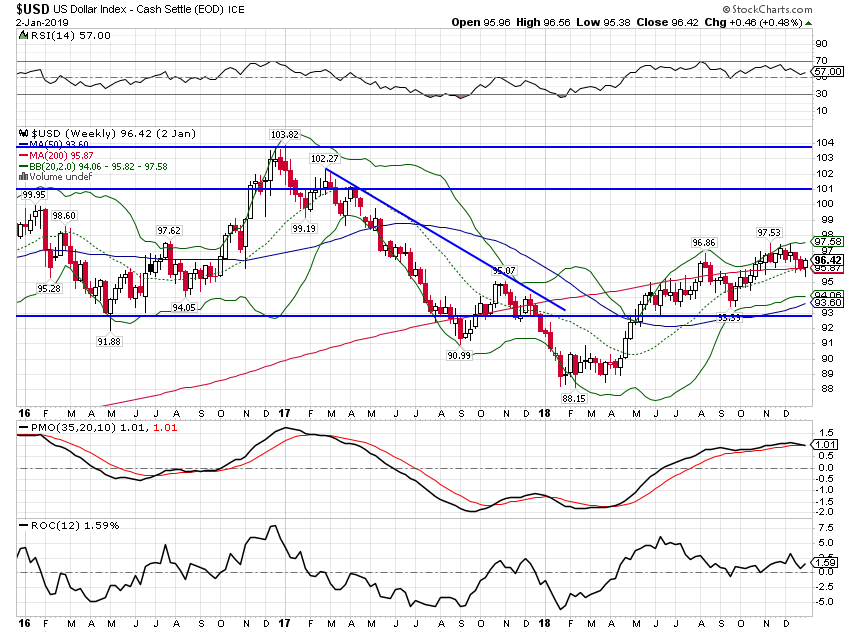 - Click to enlarge |
| Gold may already be telegraphing the eventual decline in the dollar, rallying through the stock market sell off in December. |
Gold - Continuous Contract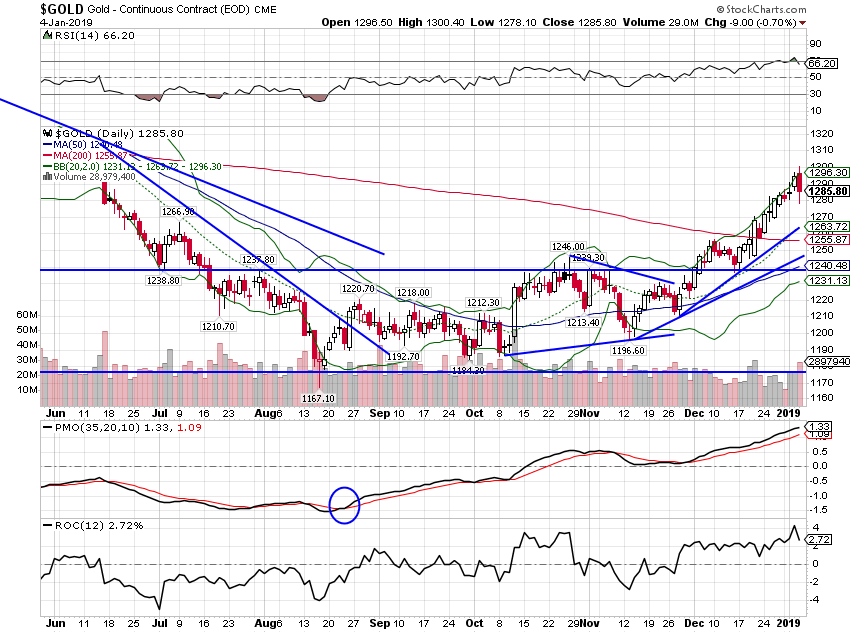 - Click to enlarge |
| The general commodity indexes were led lower by crude oil but they both appear to have hit support. With the dollar rolling over and sentiment negative crude oil and commodities may be about to surprise to the upside. |
S&P GSCI Commodity Index 2016-2018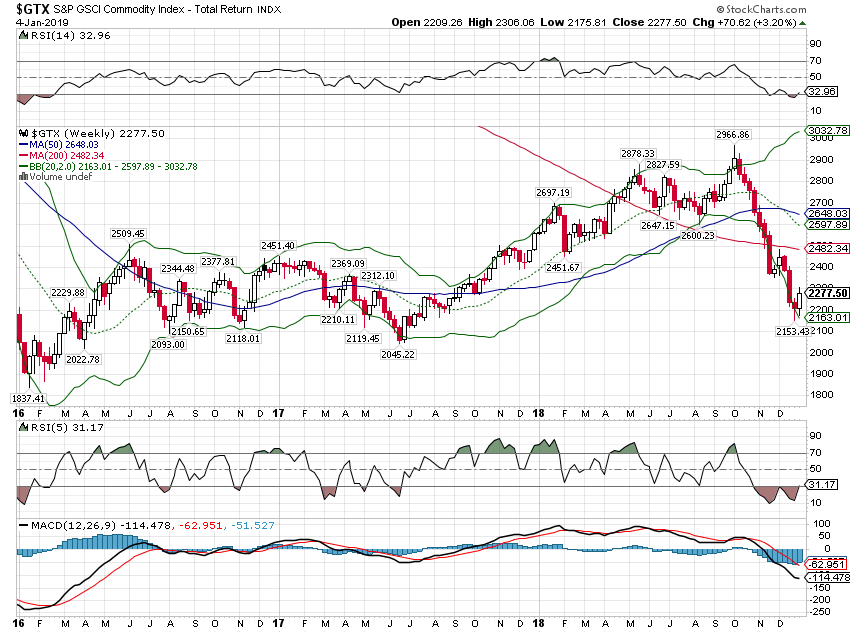 - Click to enlarge |
| Crude is at support and momentum is oversold. At a minimum, expect a bounce.
A weaker dollar would also favor foreign stocks over domestic issues and those shares also outperformed during the correction. |
Light Crude Oil - Continuous Contract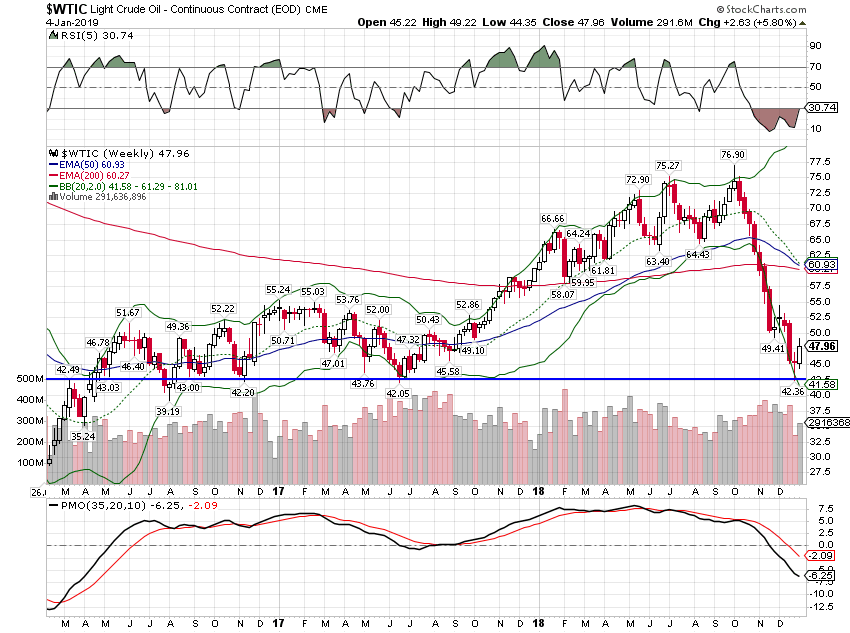 - Click to enlarge |
| Emerging market stocks underperformed for the year but outperformed in the fourth quarter. |
iShares MSCI Emerging Markets ETF/SPDR S&P 500 ETF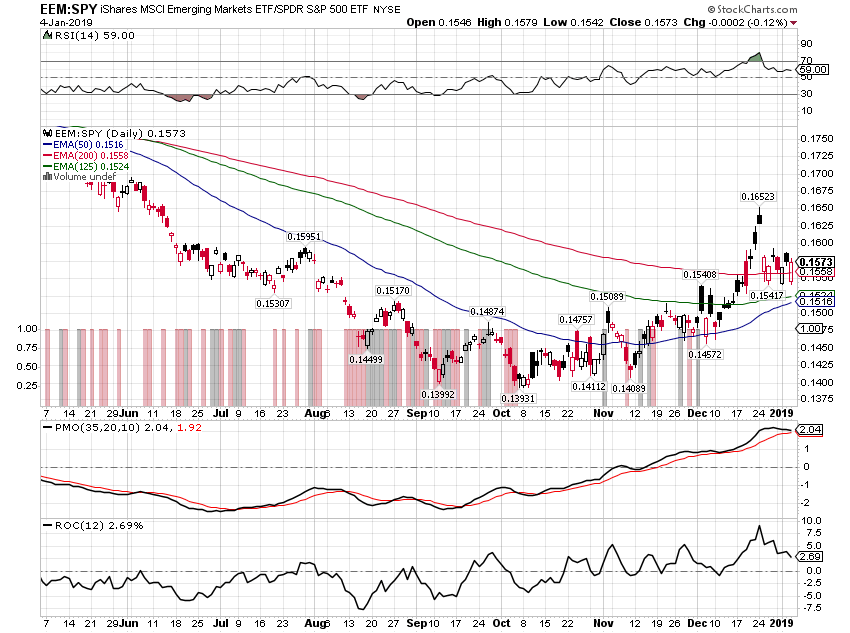 - Click to enlarge |
| EAFE stocks outperformed US in December during the most intense part of the selling. |
iShares MSCI EAFE ETF/SPDR S&P 500 ETF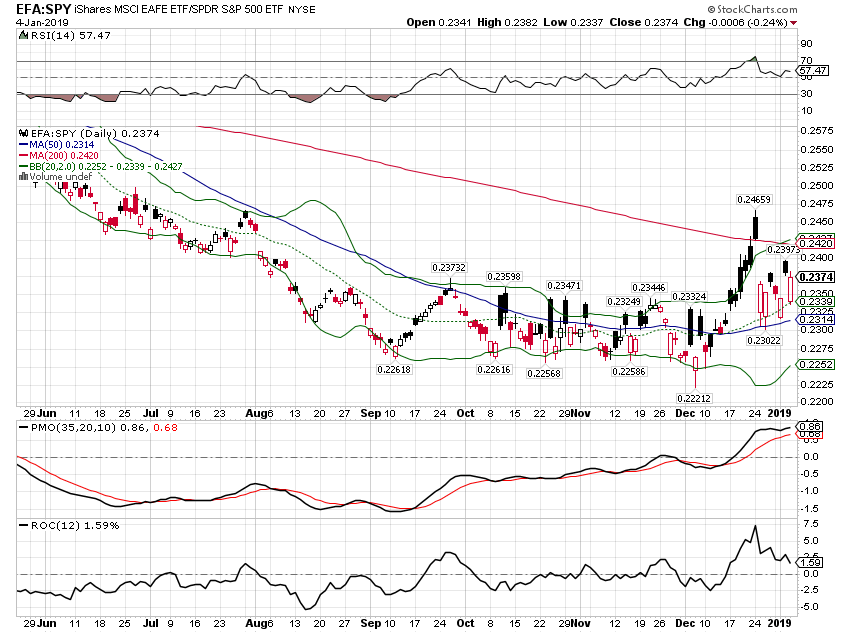 - Click to enlarge |
| Japan also outperformed in December albeit by a smaller margin. And like other foreign markets, Japan underperformed for the year as a whole. Still Japan is one of the cheapest developed markets around and stocks there are still much cheaper than the US with only slightly lower profit margins.
Bonds did exactly what they should do in a stock market correction, rising to offset some of the loss on the risk side of the portfolio. But for a variety of reasons I think bond yields will be heading higher in the years to come. Rates could certainly still move lower if the current slowdown develops into a recession but it seems likely that we are in the midst of a secular change in rates. After falling steadily since the early 80s, bond yields may have made their ultimate bottom. If that is the case, the implications are far reaching for investors. In the shorter term, the direction of rates is probably dependent to a large degree on the direction of the US dollar. If the dollar does rollover and commodities resume their uptrend, bond yields will likely follow commodities higher. |
iShares MSCI Japan ETF/SPDR S&P500 ETF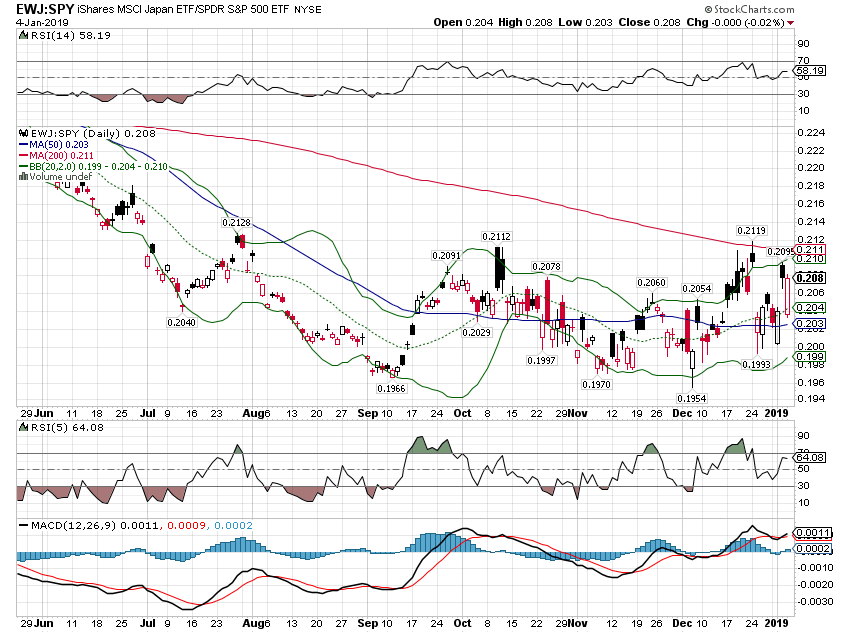 - Click to enlarge |
| Like crude oil, the copper/gold ratio is a good leading indicator for bond yields ( the black line in the main chart). The ratio bottomed in mid-2016 and headed higher as the dollar weakened throughout 2017 (see bottom panel). If the dollar resumes its downtrend, the copper/gold ratio will likely rise and with it bond yields. |
Copper-gold weekly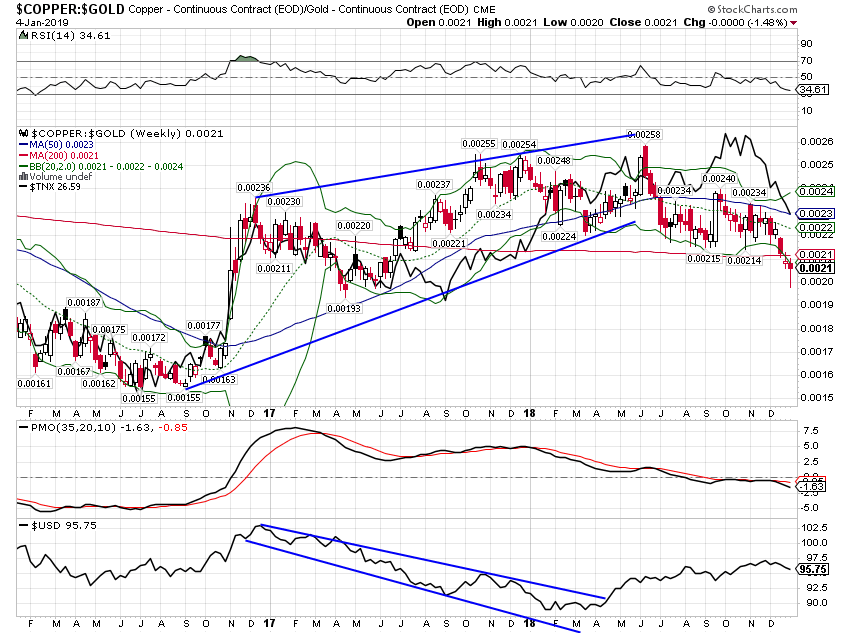 - Click to enlarge |
| Long term bonds rallied during the stock market correction but have now reached resistance. Momentum is still positive though so the trend is, for now, intact.
As I said at the top, I can’t predict the future so I don’t know how markets will move in 2019. The present conditions though are not what we would expect to see if a recession were imminent, so I think it is likely that the bear moves of last year will be put in the rear view mirror fairly soon. Does that mean US stocks can push to new highs? Not necessarily and if I’m right about the dollar, the question may be moot as investors will find greater rewards in foreign shares and other weak dollar beneficiaries. We can’t change the past and we can’t know the future so the present is all we have. That is as true for our financial life as our spiritual one. It is our nature to want to believe that someone can tell us how the future will unfold but it is a false god. I’ll leave you with a quote from another great philosopher:
I’ll be back with more observations about the present throughout the year. Here’s to a healthy and happy new year! |
iShares 20+ Year Treasury Bond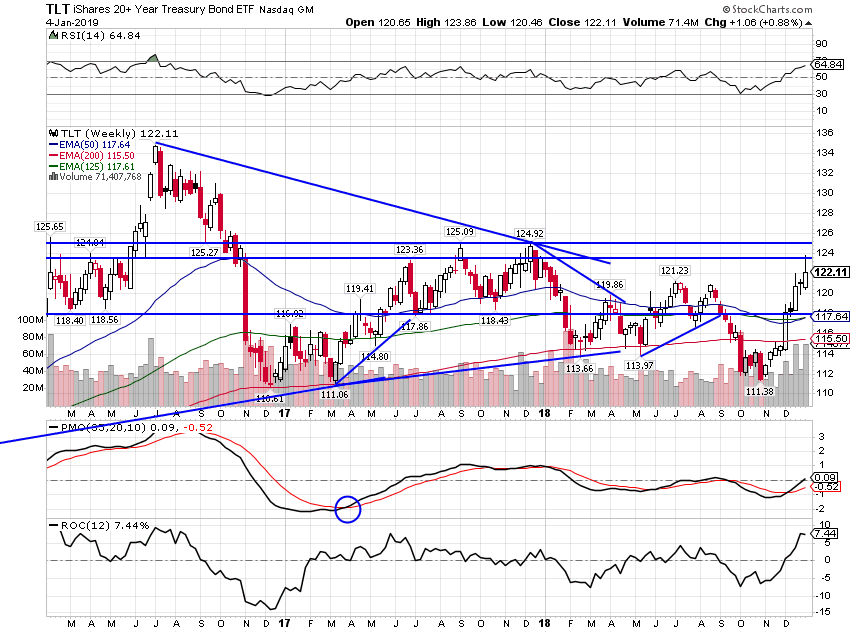 - Click to enlarge |
Tags: Alhambra Research,Bonds,cfnai,commodities,copper/gold ratio,credit spreads,Crude Oil,currencies,eafe,economic growth,economy,Emerging Markets,Federal Reserve,Federal Reserve/Monetary Policy,GDP,Gold,inflation,Interest rates,Investing,Japan,Markets,Monetary Policy,newsletter,Politics,Real Estate,REITs,S&P 500 Large Cap Index,stock market,stocks,Taxes/Fiscal Policy,TIPS,US dollar,US Dollar Index,Yield Curve


