


Joseph Y. Calhoun
My articles My siteAbout meMy videosMy books
Follow on:LinkedINTwitterSeeking AlphaAmazon
The yield on the 10 year Treasury note briefly surpassed the supposedly important 3% barrier and then….nothing. So, maybe, contrary to all the commentary that placed such importance on that level, it was just another line on a chart and the bond bear market fear mongering told us a lot about the commentators and not a lot about the market or the economy. As I said last month, despite the recent run up in rates, the economic landscape hasn’t changed that much. Since the beginning of the year, nominal growth expectations have risen, with both inflation and real growth expectations up slightly. But taking a little longer view, those expectations are no different today than they were at the end of 2015 or the fall of 2013. Call it what you will – secular stagnation or the new normal – but it is still with us. And I see no evidence that the US economy is about to break out of the 1.5% to 2.5% growth range we’ve been in for most of that period since 2013.
The economic data since the last update was a little weaker and the markets reflect that with both nominal and real interest rates down ever so slightly. From the bigger picture perspective, if we are to break out to a new higher growth range, we’ll have to raise productivity and so far, as the most recent report showed, we aren’t. There is some anecdotal evidence that investment may rise – if you believe the companies talking about capex on their conference calls – but like Godot, the hard evidence continues to be a no show. If companies do indeed start investing more then maybe productivity will rise and we can break out of these doldrums for good. But right now it just isn’t happening.
One area of concern for the global economy, at least short term, is the recent rally in the dollar. While a strong and stable dollar would be great for the global economy long term, there are short term costs to a rising dollar environment. One consequence is the fall in emerging market currencies and the impact on those economies. Argentina has recently raised interest rates to 40% in an attempt – futile I might add – to protect their currency. Obviously, that isn’t going to be a positive for the Argentine economy in the near term. Emerging markets have seen a large inflow of capital over the last 18 months on the back of generally rising currencies. But if the dollar continues to rise, those capital inflows will turn to outflows and EM growth will be impacted. For a variety of reasons I don’t expect that but it is certainly something to watch.
I would just note here that I am not in favor of a weak dollar. As I said above, a strong and stable dollar is highly desirable for the US and global economy. I would also add that stable is more important than strong which is in the eye of the beholder in any case. But a rising dollar in a world of very large dollar debts will have consequences, most of them negative in the short run. That’s why stable is the more important element. Stability in the reserve currency allows for long term commitments without fear that investments will be negatively impacted by currency movements. Those rapid capital inflows and outflows from EM countries make investment there riskier than it would be in a stable dollar world. A stable dollar isn’t just about monetary policy either by the way. Achieving it would require a coordinated effort between the Treasury, the Fed and fiscal authorities. I’m not foolish enough to hope for that anytime soon – if ever.
Economic Reports
Economic Growth & InvestmentThe GDP report garnered most of the attention among this group of reports but the CFNAI provides a better snapshot of the economy. The CFNAI is a report we watch with great interest because it encompasses and aggregates together a wide range of individual reports. At 0.10 it is reflecting economic growth that is just slightly above trend. The three month average is down to 0.27 but that is well above the -0.75 we would expect prior to recession. The GDP report also shows growth just a bit over trend – assuming 2% is the trend – but the real final sales number was quite disappointing if not surprising given the weak income growth also reported recently. Looking at the details of the GDP report reveals an economy that is quite a lot weaker than the headline. Inventories added 0.4 and with sales, especially on durables, weak I don’t think it was intentional. Investment did add 0.8 to the total but based on the regional Fed surveys and rising oil prices, a lot of that probably went into shale drilling. Residential investment added nothing to the total. Trade also added to GDP but that isn’t the positive the Trump administration believes. Imports, as noted below, have been weak which is not a positive sign of US growth. Productivity was less than expected in the latest report but that tells us little about the future. The key to future productivity is investment and on that front I still see a lot of problems. The investment in shale may be positive from a geopolitical standpoint – and I’m not entirely sure about that – but it doesn’t move the needle on productivity. Drilling holes in the ground is not exactly rocket science. |
Economic Growth and Investment - Click to enlarge |
ProductionAll these sentiment type reports appear to have peaked and rolled over with the exception of the Dallas and KC Fed surveys both of which are greatly affected by shale activity. Remember a couple of years back when I kept asking if the falloff in shale activity would be enough to cause a recession? It turned out the answer was no if only by a whisker. So the question now seems to be, can shale, by itself, create enough growth to keep the economy growing above trend? Another way to think about that is that the economic growth generated from shale activity is the marginal activity in the economy. When it goes away, growth falls to the bottom of the range. When it is in full swing – as it is now with oil at $70 – growth moves to the top of the range. If the dollar keeps rising and oil prices fall – as they would be expected to do if the dollar rises – shale activity will moderate and so will economic growth. Keep an eye on the dollar. |
Production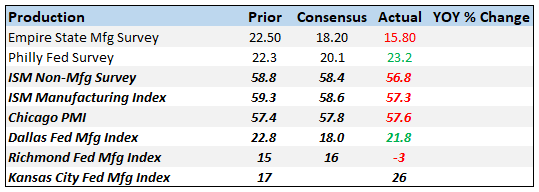 - Click to enlarge |
Consumption & DistributionConsumer spending was up 0.4% as expected but February was revised down 0.2% to flat so not a strong report. Durables spending was up on auto sales but non-durables were down 0.4%, the second straight decline. Spending has been weak this entire expansion and that hasn’t changed. |
Consumption and Distribution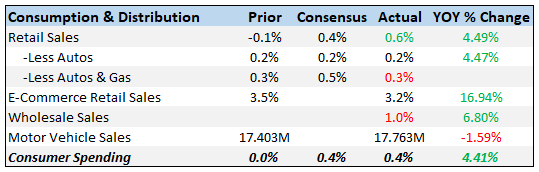 - Click to enlarge |
OrdersOptimists should concentrate on those year over year figures because the more recent reports were not that good. Durable goods orders ex-transports were flat. Machinery orders were down a steep 1.7% which does not bode well for all that investment we keep hoping for. Core capital goods were down in the durable goods report and revised even lower in the factory orders report. |
Orders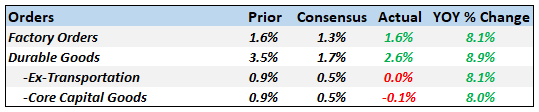 - Click to enlarge |
TradeA big improvement in the trade balance but as I said above, not for good reasons. Falling imports are not a good sign for the US economy. Having said that, I don’t know how much the recent trade rhetoric is affecting theses reports so I won’t take this as a big negative – yet. |
Trade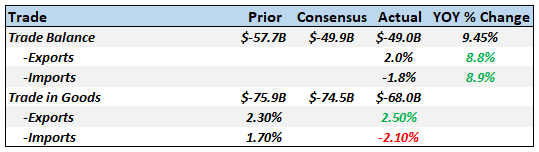 - Click to enlarge |
InflationI know there is a lot of concern out there about inflation – or at least that’s what the newspapers say – but I find it hard to get too worked up about most of these figures. The GDP price index was a little hotter than expected but still at just 1.9%. Employment costs, despite 3.9% unemployment, appear well contained. The only prices on here that bother me are the housing price numbers. House prices relative to incomes are now back to near where they were at the peak in 2006. Shelter costs are a significant factor in a lot communities. Here in South Florida nearly 2/3 of families spend more than 30% of their gross income on rent. In Miami-Dade county we have over 3/4 of a million families spending over half their income on rent. Now that is inflation that matters and I think it can be directly attributed to government policy. I’ll save that rant for another day and just say that monetary and regulatory policy is not working for the average American. |
Inflation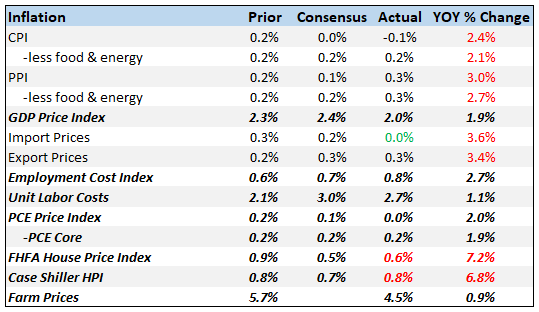 - Click to enlarge |
EmploymentPayrolls were again less than expected but February and March were revised higher by a net 30,000 jobs so that mitigates the negative to some degree. Average hourly earnings were less than expected so I still don’t really buy the worker shortage argument. If companies really needed workers they’d pay up and they aren’t. One would also expect to see the workweek lengthening and that isn’t happening either. Overall, employment growth is positive but not robust and in a downward trend. Jobless claims are again back near the lows though so I don’t see any reason to get worried although I am still wondering how helpful claims will be in identifying a slowdown in this cycle. Gigs are not jobs and when they end you can’t collect unemployment. |
Employment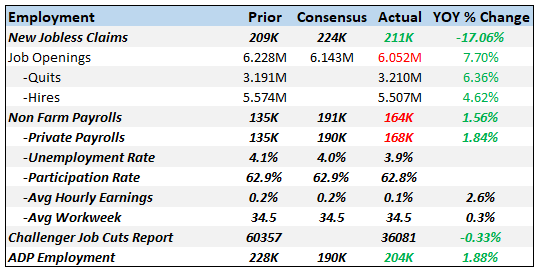 - Click to enlarge |
ConstructionThe new home sales report was fairly positive, up last month with January and February both revised higher. That contrasts with the overall construction spending report which was anything but positive. Spending on residential was down 3.5% with both single and multi-family down. Home improvement, which has been soft, fell off badly, down 8% for the month. Private non-residential spending was also down, held back by drops in factory spending and commercial. Again, where is that capital spending? Overall, just an awful report but it is very volatile, subject to big revisions. February was revised up from 0.1% to 1%. |
Construction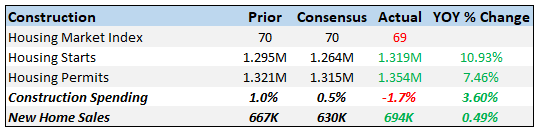 - Click to enlarge |
SentimentConsumer sentiment and confidence remain high. About the only negative was a drop in current conditions int he sentiment report. Again, though, as I’ve said many times, these numbers are coincident at best and tell us little about the future. |
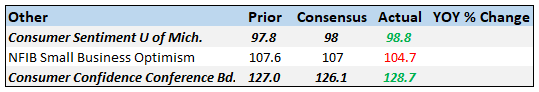 - Click to enlarge |
Market Indicators10-Year Treasury Note YieldThe 10 year yield hit 3.035% and then pulled back. Momentum still seems to be pointing to further upside in yields but that probably depends on the data and the perception of how the Fed will react to it. My best guess is that risk is up to about 3.25%. |
US Treasury Yield Index, Oct 2017 - May 2018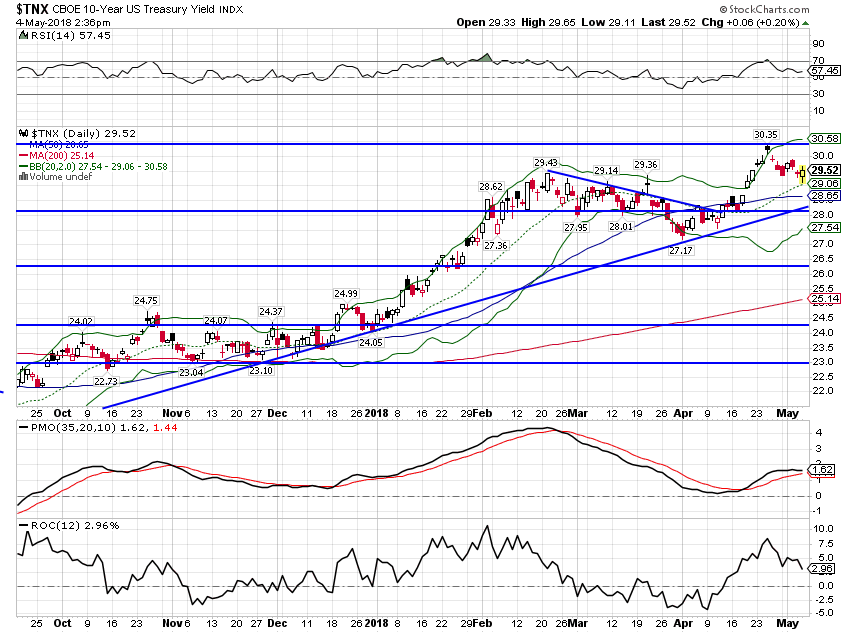 - Click to enlarge |
10-Year TIPS YieldTIPS yields also pulled back slightly but are still at the top end of the recent range. Growth expectations have moved up since the beginning of the year but the change is small. |
Treasury Inflation - Indexed Security, Jul 2013 - May 2018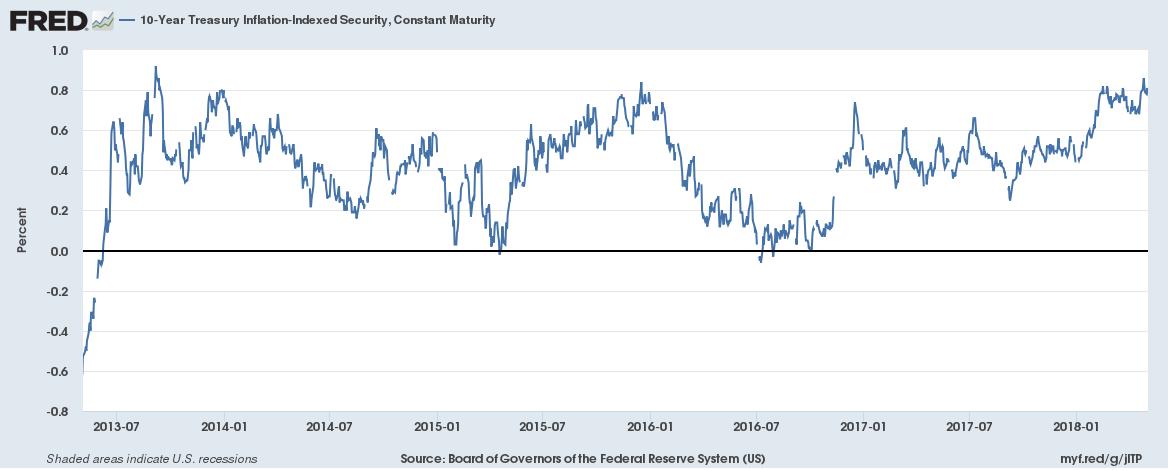 - Click to enlarge |
2-Year Treasury Yield2 year yields keep moving up and the yield curve keeps flattening. Normal behavior for this part of the business cycle. I would note though that the 2 year yield is well above the dividend yield of the S&P 500 now so maybe TINA can finally be retired. |
US Treasury Yield Index, Oct 2017 - May 2018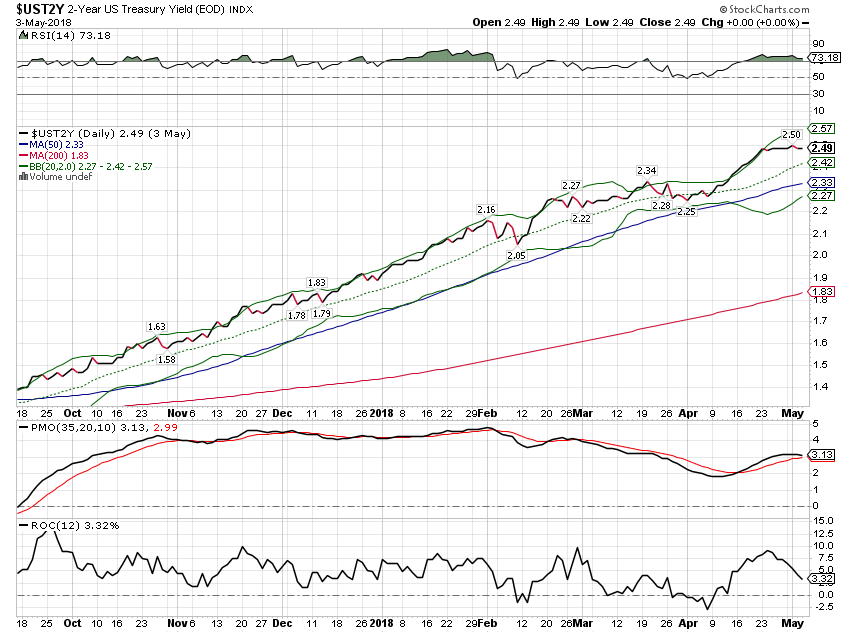 - Click to enlarge |
10/2 Yield CurveThe yield curve resumed flattening and is threatening the lows of the cycle. Nothing here pointing to recession or acceleration; just normal business cycle movement. |
Yield Curve - 2 Year Bonds Index, Oct 2017 - May 2018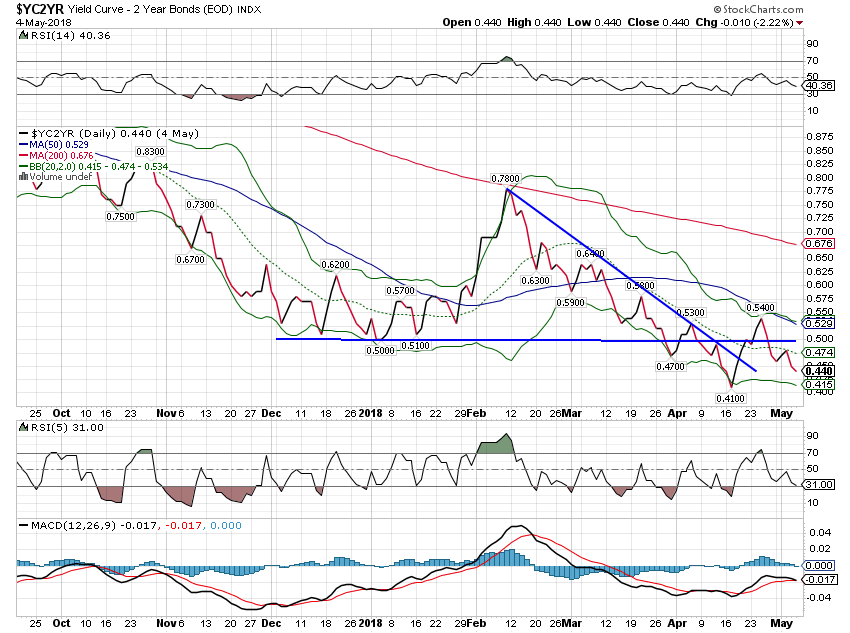 - Click to enlarge |
| The yield curve is the best indicator of future economic growth and so it isn’t surprising that it correlates well with the value of the dollar, at least at times. The dollar value is really about relative growth expectations though so what happens in Europe and the rest of the global economy matters too. But all else equal, the yield curve is pretty useful in looking at the dollar. What we see right now is a breakdown in the correlation where the dollar has moved higher while the yield curve has resumed flattening. If the flattening continues I would expect to see the dollar eventually follow it lower. |
Yield Curve - 2 Year Bonds Index, Jul 2017 - May 2018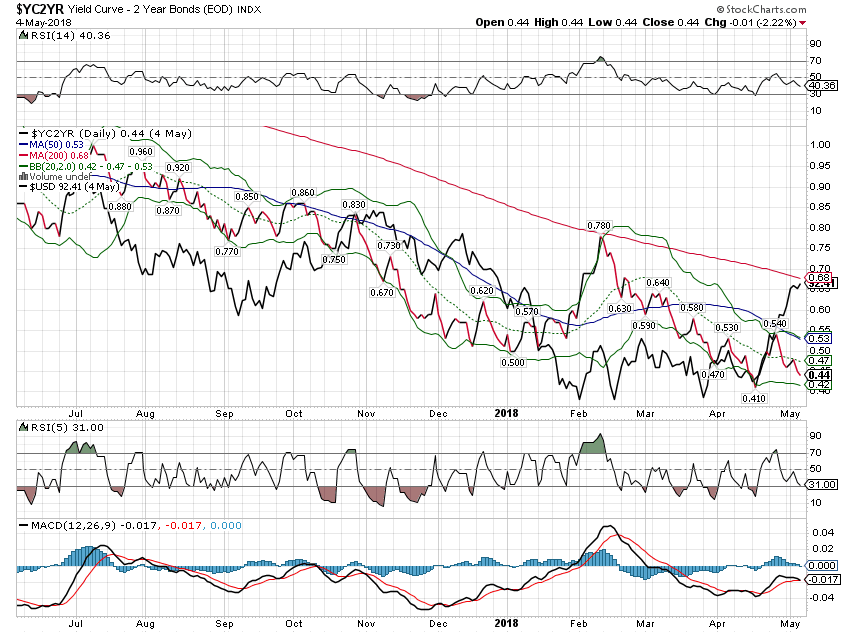 - Click to enlarge |
Credit SpreadsCredit spreads widened slightly but it is nothing more than noise at this point. The junk bond market is remarkably quiet. Too quiet? |
ICE BofAML US High Yield Master II Option-Adjusted Spread, Jan 2012 - May 2018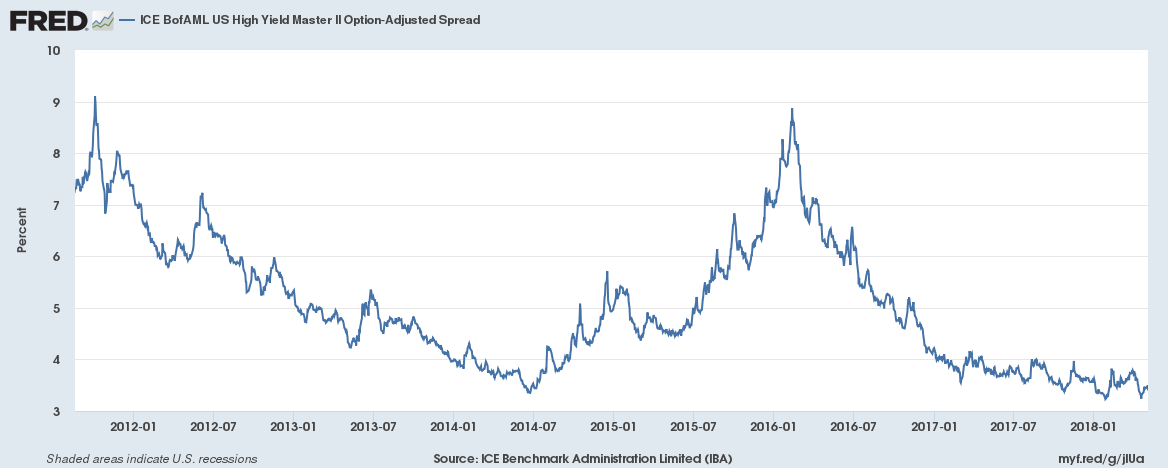 - Click to enlarge |
US DollarI’ve been looking for a dollar rally and we finally saw it over the last month. This seems to be more about waning growth expectations in Europe rather than any significant change in the US. Data in Europe has definitely been a little weaker but I don’t know that I’d characterize it as weaker than the US data. Whatever the reality, the perception seems to be that Europe is losing economic momentum versus the US. I suspect that will equalize through weaker US expectations but we’ll see. So far though, monthly momentum for the dollar remains negative. |
US Dollar Index, 1999 - 2018(see more posts on U.S. Dollar Index, )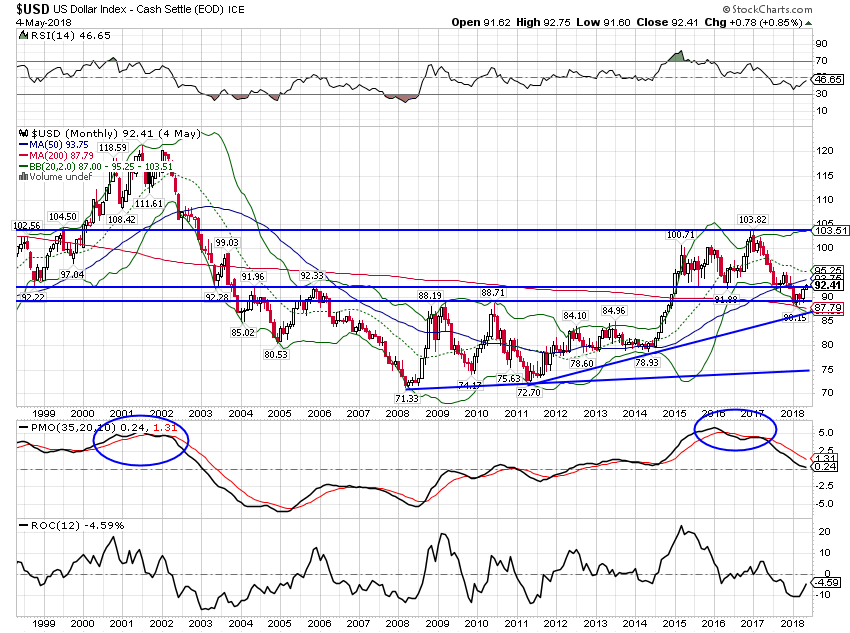 - Click to enlarge |
| Recent Euro weakness is just the flip side of dollar strength. I do not presently expect much more downside. |
Euro - Philadelphia Index, 1999 - 2018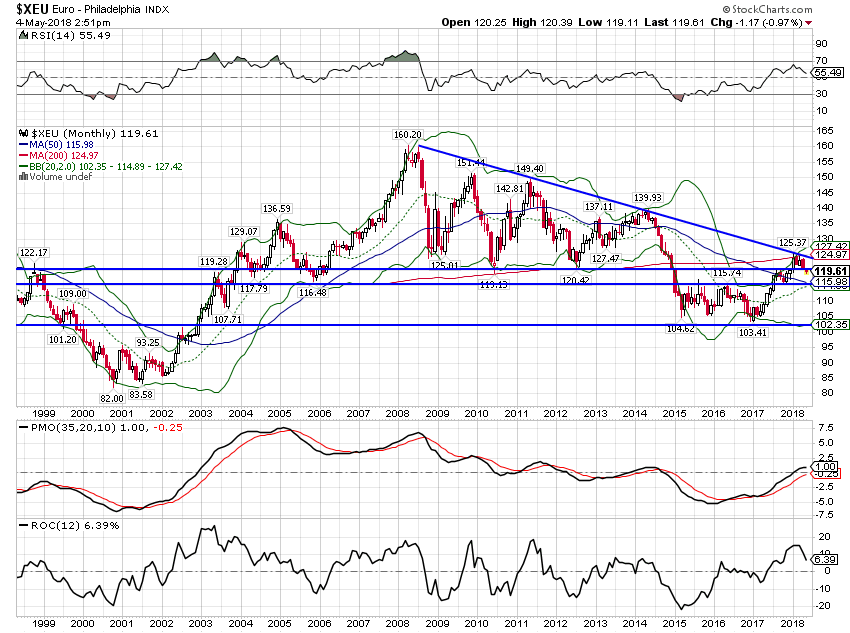 - Click to enlarge |
| As I said above, EM currencies have also been weak. Long term momentum is still up though and I see no reason to expect a rout in EM right now. |
WisdomTree Emerging Currency Strategy Fund, Jun 2009 - Apr 2018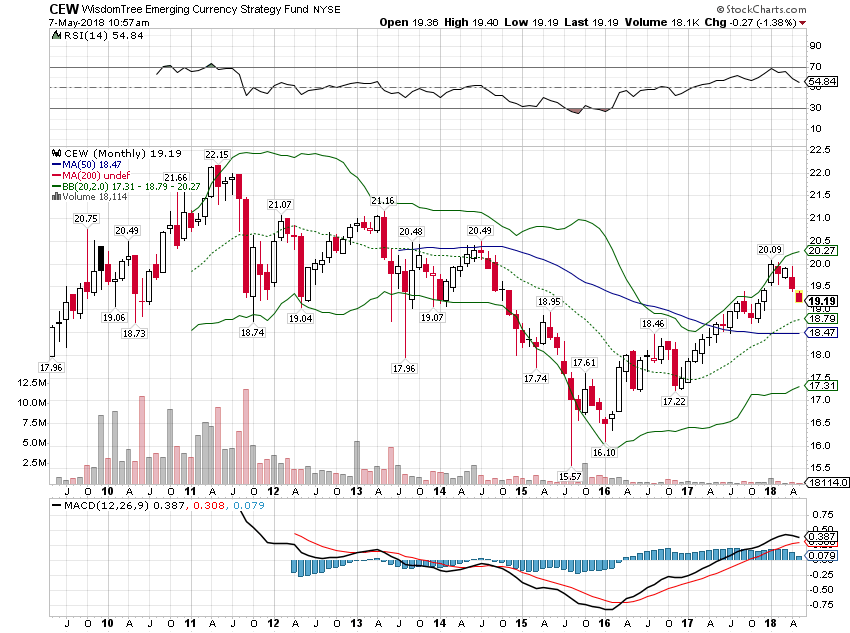 - Click to enlarge |
CommoditiesGiven the rally in the dollar and TIPS yields the fact that gold hasn’t fallen apart should be considered a major victory for the bulls. Still, gold was down a little since the last update, a small positive for growth. |
Gold Daily, Oct 2017 - May 2018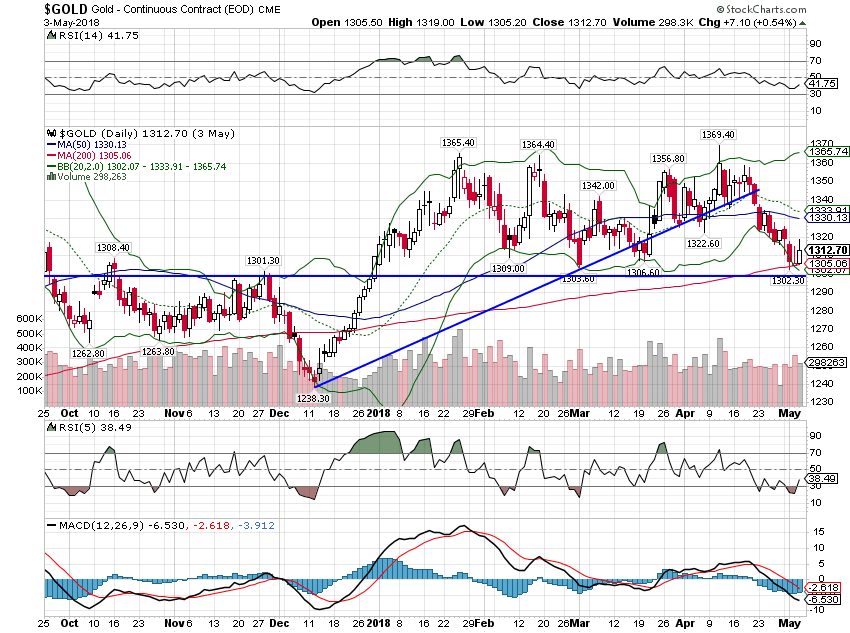 - Click to enlarge |
| This graph shows the 5 year TIPS yield and the inverse of the gold price. As you can see, the price of gold is inversely correlated with 5 year TIPS yields. When yields rise, gold tends to fall and vice versa – until recently when the relationship has broken down. What will close the gap? Lower TIPS yields or lower gold prices? |
Treasury Inflation - Indexed Security, Constant Maturity, Jan 2010 - May 2018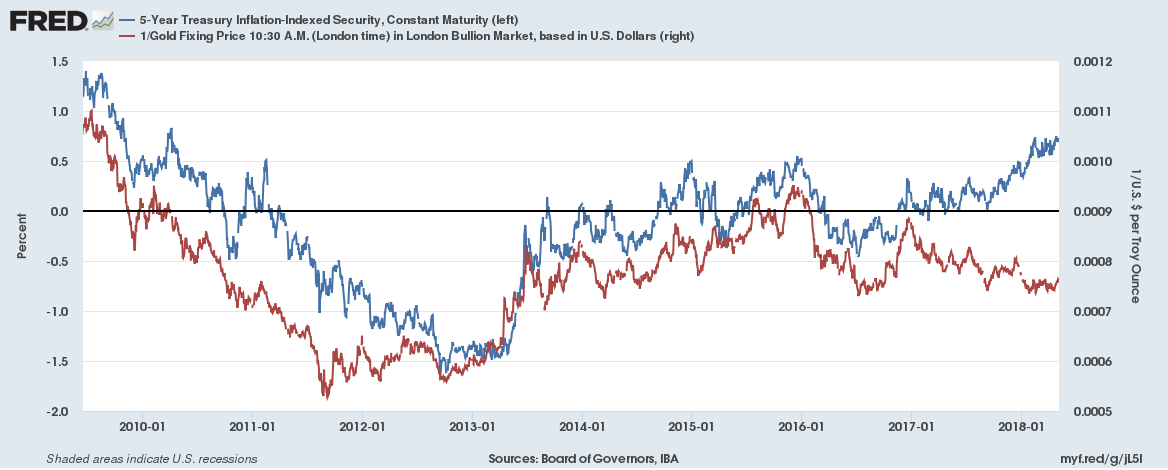 - Click to enlarge |
| The same could be said for the general commodity index where the uptrend continues. Of course, commodities also have a growth component and are not just driven by real interest rates and the dollar. So, does this mean growth is picking up? Well, there are certainly some tariff effects and oil is being driven by OPEC and fundamentals more than recently so there is some distortion. And companies have indicated that they are not able to pass through rising input costs to consumers so this will probably impact margins more than consumer inflation. I’d venture a guess that this is pointing to a resumption of the dollar decline more than anything. |
Bloomberg Commodity Index, Oct 2017 - May 2018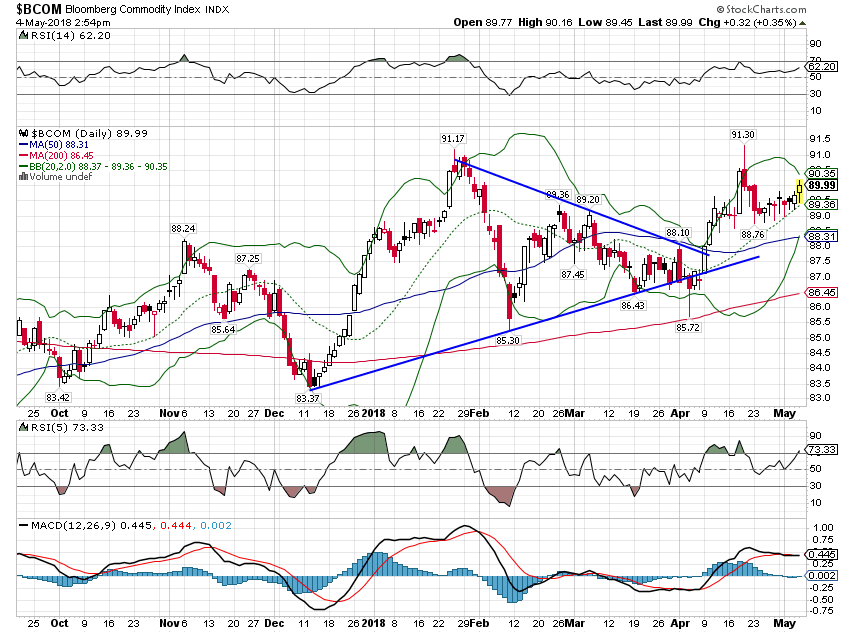 - Click to enlarge |
| Momentum for the Copper:Gold ratio is still down and the gap between the ratio and the 10 year yield persists. We’ll see on this one but I think this is probably going to be resolved through lower yields. |
Copper:Gold Weekly, Jul 2015 - Apr 2018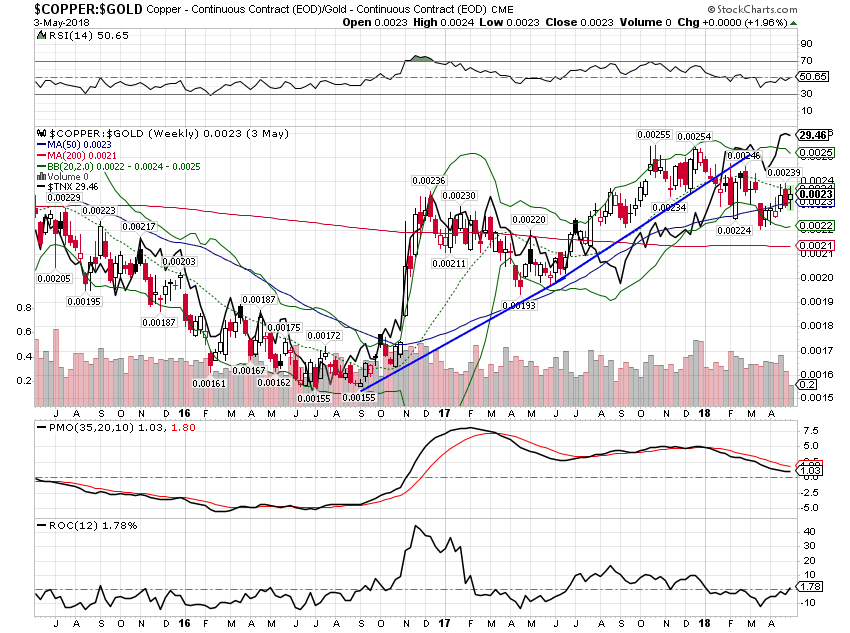 - Click to enlarge |
| I’ll finish up these indicators with crude oil which broke out to over $70 this morning but wasn’t able to hold it. If this rally continues, we are going to start seeing those articles about how this is like a “tax” on consumers. I don’t like that characterization for several reasons but mostly because tax revenue goes to a government whereas higher oil prices just moves the money from one group of Americans to another, i.e. consumers to producers. Our economy has, over the last decade, become much more sensitive to the price of oil. As I discussed above, oil production seems to be the marginal product of our economy. When oil prices are high the economy tends to grow a little faster, not slower. And when oil prices fell in 2015/16, we came darn close to recession. |
Light Crude Oil Weekly, Jan 2015 - Apr 2018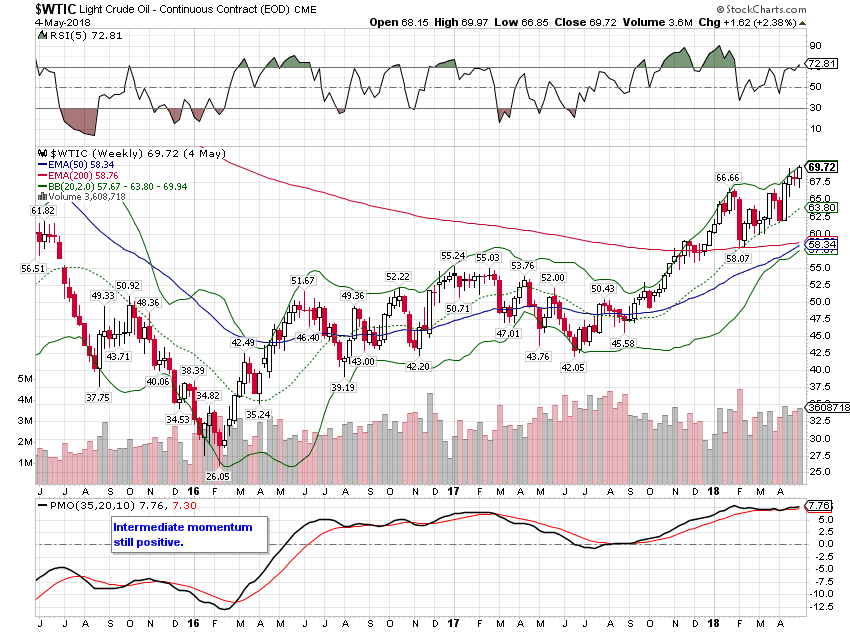 - Click to enlarge |
| Interest rates are near levels last seen in early 2014 right before a major dollar rally and a crash in oil prices. As I’ve said, our economy has become dangerously dependent on oil prices for growth. That is confirmed by the high degree of correlation between crude oil prices and the yield of the 10 year Treasury note: |
CBOE 10 - Year US Treasury Yield Index, May 2015 - 2018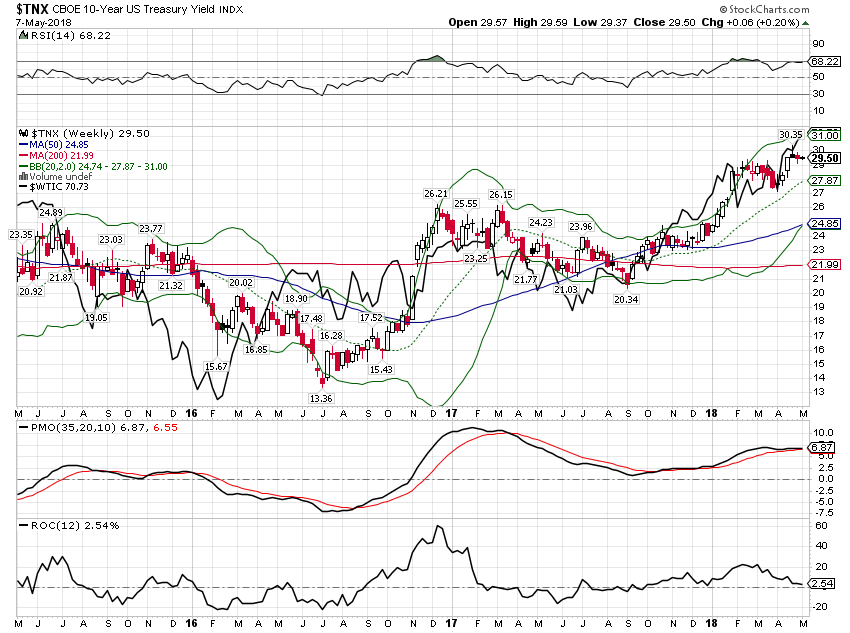 - Click to enlarge |
Oil prices are obviously not the only factor contributing to US economic growth. But oil production is more important now than it has been in my lifetime and oil prices matter. How much of current oil prices is about the geopolitics of the Middle East and OPEC? How much is due to the falling dollar? I’d say the former is playing a pretty big role right now as oil prices have continued to rally in the face of a stronger dollar. That makes the Middle East important to us in a way it never has. In the past, we always worked to keep oil flowing and prices low but not too low. Now because of our dependence on shale for growth, we want to keep prices high but not too high. If you think predicting the course of the economy was hard in the past, it just got a whole lot tougher.
Tags: Alhambra Research,Bi-Weekly Economic Review,Bonds,commodities,consumer spending,copper to gold ratio,credit spreads,currencies,economic growth,economy,Emerging Markets,GDP,Gold,inflation,Markets,newslettersent,oil prices,productivity,TIPS,Trade,U.S. Dollar Index,US dollar,Yield Curve


