Jeffrey P. Snider
My articles My offerMy siteAbout meMy videosMy books
Follow on:LinkedINTwitterSeeking Alpha
Beginning with its very first issue in May 1915, the Federal Reserve’s Bulletin was the place to find a growing body of statistics on US economic performance. Four years later, monthly data was being put together on the physical volumes of trade. From these, in 1922, the precursor to what we know today as Industrial Production was formed.
The index and its components have changed considerably over its near century of operative history. But it’s the length of the series and its application that continues to draw serious scrutiny. Contraction in IP has almost always been associated with declared recession. False positives are few.
For these reasons, the Economists who have tasked themselves with “officially” (its not a government declaration, rather one made within the Economics community that is treated as declarative because it is believed acceptable by the profession) dating the business cycle use IP along with only a few other indications to make their determination. If a cycle peak means a broad-based, widespread economic downturn, then IP’s signal is as the singular proxy for the very important contribution, or subtraction, of US industry.
Even in those cases where Industrial Production may have turned lower outside of official recession, nearly all have been a matter of timing. In isolated instances, IP may not have been enough on its own to trigger a cycle dating but has always described a slowdown or downturn reaching considerable and serious proportions.
It is not, however, a static statistic. Rarely do you find any that are. Revisions are a constant intrusion of modern economic gathering and measuring. Large-scale sampling is always preferred but it takes time.
| Annual benchmark revisions for IP completed last month but accompanying the latest release demonstrate yet again the difficulties in situations like the current “cycle.” Statistics like these are supposed to be objective, but they contain within them several key subjective judgments (trend-cycle the biggest). For yet another benchmark year, IP is pushed downward. |
US Industrial Production, Jan 2006 - 2018(see more posts on U.S. Industrial Production, )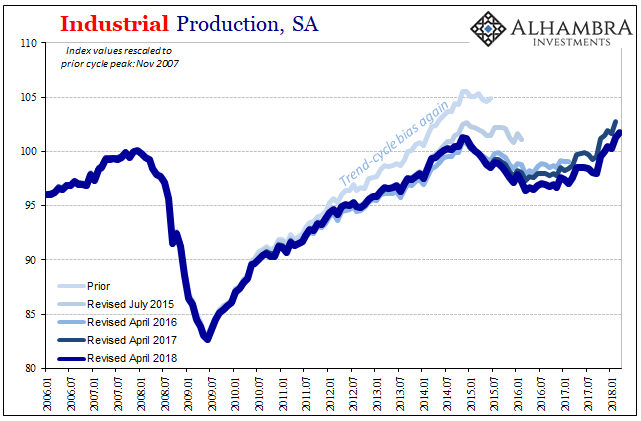 - Click to enlarge |
| The effect of these slow drip revisions is to more clearly outline the scale of 2015-16’s downturn at least in the industrial sector (and then combined with other accounts). What began as seemingly a concerning but small retreat has over these intervening years been redrawn into a pattern and proportions similar to what IP had shown during past declared recessions. |
US Industrial Production, Jan 1999 - 2018(see more posts on U.S. Industrial Production, )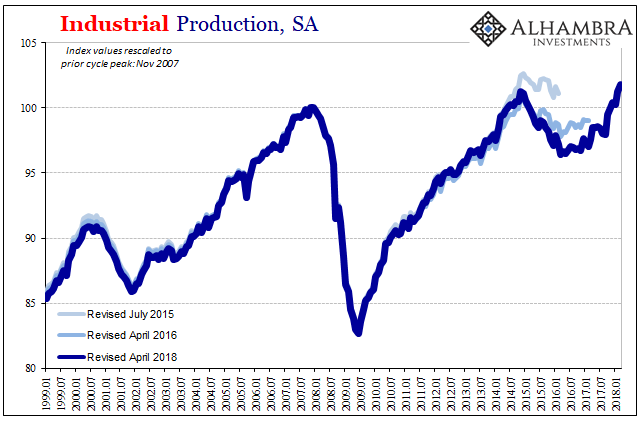 - Click to enlarge |
| Why do we care? After all, it appears to be nothing more than an academic argument about past history no longer much applied to the current situation. That was three years ago and the economy is, after all, booming right now. Or is it?
That’s largely the point of this annual exercise. And it matters a great deal in what it tells us about interpretation, and who is making them. You have to go back in time, but that’s what we were told then, too. They said then the economy was if not already booming in late 2014 it was surely about to. It was the manufacturing sector that first suggested there was something wrong with that interpretation. That this weakness finally broke through into a sharp IP decline is today indicative of that weakness having become very serious and broad-based. |
US Industrial Production, Jan 1980 - 2018(see more posts on U.S. Industrial Production, )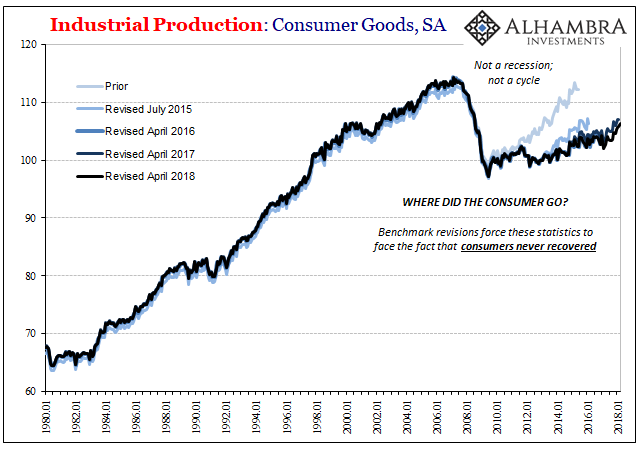 - Click to enlarge |
| Based on the contemporary benchmarks, however, the IP statistic as it was presented at the time wasn’t nearly as clear. It registered at first only a small setback, one that didn’t even produce a negative year-over-year comparison until December 2015. That contraction figure was released on the very same day the FOMC voted for its first “rate hike” since 2006.
That’s ultimately what we are talking about. The Fed clearly overlooked the small decline in the IP index and dismissed it as a minor negative indicator not near substantial enough to warrant holding them back. They had become convinced that though there were several economic and market “anomalies” of this kind, because they weren’t more serious in the negative they could be dissociated from their analysis as those “transitory” factors. |
US Industrial Production, Jan 2011 - 2018(see more posts on U.S. Industrial Production, ) - Click to enlarge |
| These further benchmark revisions, however, increasingly display that bias. These were not minor setbacks in some small unimportant niche corner of the economy, as it turns out they were of the proportions of past recessions (and we may find out next year, as the 2017 Economic Census winds its way into these data points, it was worse still). Thus, what are we to make of the interpretative abilities of people like those who populate the FOMC declaring their expectations for a boom that turns out to have been instead a near-recession?
You might defend them given the data they had at the time, but even with those prior estimates on hand they shouldn’t have been so easily set aside. The issue is forecasting from interpretation. They chose to very purposefully disregarded the smallish declines in IP (and others) when theses subsequent revisions have revealed that instead they should have focused on them no matter the degree. It’s about probabilities and scenarios, and how anyone gets to deciding the balance in any direction. If you think the economy is going to take off, then even a small deviation in IP should be enough to trigger a rethink about the balance of probabilities. The revisions since have proved that policymakers, Economists, and the mainstream (all redundant) have relied in the recent past on the wrong signals. |
US Industrial Production, Jan 1995 - 2018(see more posts on U.S. Industrial Production, )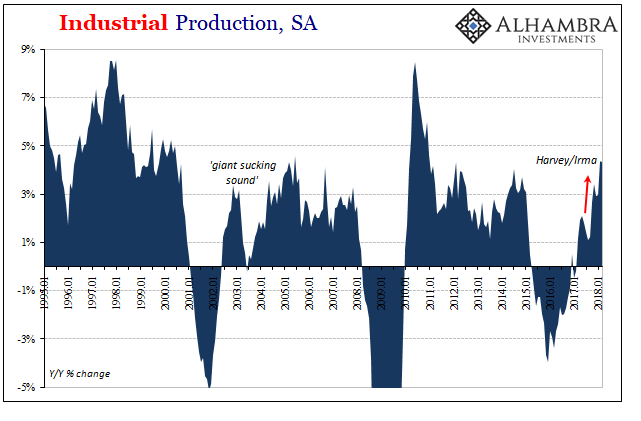 - Click to enlarge |
| Any pause in IP for any significant length of time is cause for serious concern, or it should have been. That’s ultimately the point here. The FOMC was in a rush to do its “rate hike” in December 2015 because they had been delayed by them long enough, minor though persisting as they might have appeared at the time. To accept what IP was saying would have meant, in reality, destroying the whole boom narrative.
The FOMC bet on the narrative and it soon became very clear why they were wrong to have done so. IP revisions (as well as other data, such as one other statistic the NBER also uses in conjunction with IP, Real Personal Income excluding Transfer Receipts) have only increased the level of evidence suggesting how and more importantly why, therefore explaining perfectly why “rate hike” #2 needed another whole year to be aroused. Economists and monetary officials would rather dismiss the possibility of a serious downturn as nothing but a transitory annoyance than be moved off their preferred recovery scenario. This should sound much too familiar to anyone analyzing economic (and narrative) trends in 2018; particularly as that last downturn gets ever deeper with each benchmark and it still has yet to be acknowledged. Without a grounded frame of reference, interpretation becomes irrational. Industrial Production is growing again, but despite the contributions from largely the oil sector and a big jump in motor vehicle assemblies (MVA) the past two months (February and March 2018) it has only reached 2014 levels. These are nothing like an actual boom (as the comparison to 2014 should induce the same caution), and certainly not when taking into account the depths of that last downturn still being revealed to us in these benchmark changes. |
US Industrial Production, Jan 2006 - 2018(see more posts on U.S. Industrial Production, )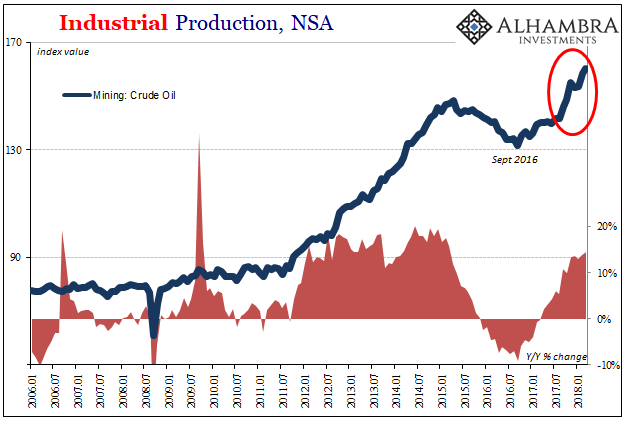 - Click to enlarge |
| Take MVA’s, for one. They have increased sharply (for as yet unknown reasons) but only starting from a serious depth. |
US Motor Vehicle Assemblies, Jan 2013 - Apr 2018(see more posts on U.S. Motor Vehicle Assemblies, )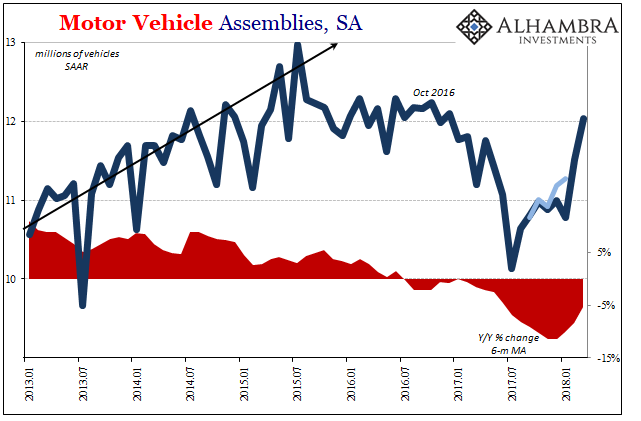 - Click to enlarge |
| It’s hard to imagine how the economy could have been booming last year when this segment was experiencing its own substantial downturn. Production volumes dropped by nearly 15% at its worst. |
US Motor Vehicle Sales and Production, Jan 2011 - Apr 2018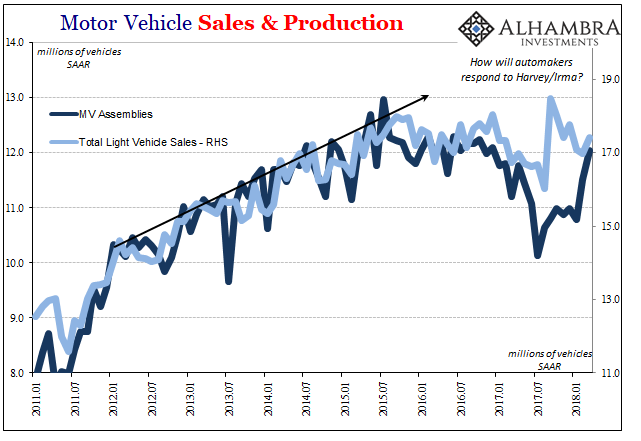 - Click to enlarge |
At 12 million SAAR last month, that’s much better than the 10.1 million at the low last July. That part, in isolation, might seem to suggest boom. But it remains considerably less than the prior trend which the auto sector departed from almost three years ago during the downturn still in question. Weakness, therefore, hasn’t been transitory within the auto sector at all.
It’s not as if sales have picked up, either, so again it’s not clear why automakers have increased production (frontloading in 2018?) Perhaps they are moving in anticipation of tax reform effects and the inflationary boom they keep hearing about (and surely their inhouse Economists keep assuring them is happening). But which are the valid, and which the false, signals?
Tags: Auto Sales,boom,Business Cycle,currencies,downturn,economy,Federal Reserve/Monetary Policy,industrial production,inflation,manufacturing,Markets,Motor Vehicle Assemblies,nber,newslettersent,recession,recovery,U.S. Industrial Production,U.S. Motor Vehicle Assemblies