The market volatility this year has been blamed on a lot of factors. The initial selloff was blamed on a hotter than expected wage number in the January employment report that supposedly sparked concerns about inflation – although a similar number this month wasn’t mentioned as a cause of last Friday’s selling. The unwinding of the short volatility trade exacerbated the situation and voila, 12% came off the market in a matter of days. The market recovered most of those losses by early March but volatility has returned with a vengeance over the last few weeks. The culprit this time is supposedly tariffs as the Trump administration called everyone’s bluff and did what everyone hoped they wouldn’t.
The truth is that we rarely know why markets move the way they do. We can’t possibly know the motivations of all the sellers and buyers in a market. All we can do is observe the result. If sellers are feeling more urgency to sell than buyers are to buy, then the price will go down until that sense of urgency is balanced once again. And vice versa. When I was much younger and new to this business I once asked an old trader why the market was down one day and his answer was a simple, “more sellers than buyers”. While not technically correct that simple statement tells you all you need to know.
I wouldn’t say that the motivations of buyers and sellers is irrelevant but it is a lot less important than most everyone thinks. It is the actions of investors and traders that shape the economy not the other way around. When owners of junk bonds start to get worried about the issuers and become sellers, the result is higher interest rates for marginal borrowers or in extreme cases a complete lack of funding. Those higher rates and reduced funding at the margin have an impact on the economy. Do defaults drive junk bond prices or do junk bond prices drive defaults? Probably a little of both I think.
I try to imagine that I have no access to the news, that my only source of information about the economy comes from the regular release of economic data and the market reaction to those reports. When I do that today, I come to a pretty clear conclusion – the global economy is losing momentum. This is evident in the economic reports which have been almost uniformly weaker than expected recently – here and in Europe – and also in the markets where both short term and long term interest rates have fallen recently. It isn’t a large change – yet – but it is pretty obvious. Why the economy is decelerating is much less important than the fact that it is.
As for stock market volatility, I will offer an additional explanation, one much simpler than unexpectedly hot wage numbers, short volatility trades and impending tariffs. My explanation is quite simple – the Fed is tightening policy, raising interest rates and reducing the size of its balance sheet. If you believe that QE had an impact on the markets – and I am hard pressed to find anyone who doesn’t – then you have to believe that its reversal will as well. Volatility is nothing more than the inverse of liquidity. With the Fed reducing the latter one should expect more of the former.
Bi-Weekly Economic Review: Investing Is Not A Game of Perfect
Economic ReportsEconomic Growth & InvestmentThe Chicago Fed National Activity Index, one of those broad based indicators we keep a close eye on, jumped to 0.88, much better than expected. But keep in mind that the last two months have been revised lower by a significant amount so we might view this one with just a bit of skepticism. But even if it is revised lower next month, the message is pretty clear. Even if we are slowing a little, with a three month average of 0.37, we aren’t even close to recession. Personal income improved again, up 0.4% on the month but still tracking at less than 4% year over year. These are not great rates of growth but at least they are positive. The savings rate improved again but is still down substantially from last year. The GDP revision was about as expected although I think some were surprised by the negative corporate profits number. That is an artifact of tax reform (Jeff explains here) though so it isn’t as bad as it looks. Corporate earnings, despite their recent recovery, are not all that impressive even if you take out the tax reform distortion but they are expected to rise significantly this year. That may well depend on the depth of any slowdown that develops. |
Economic Growth and Investment |
ProductionAll these survey based manufacturing reports were less than expected but all of them are still at robust levels. |
Production |
Consumption & DistributionConsumer spending, as in the previous report, was less than expected. Unless we get a gangbuster of a report for March, this is going to be a significant drag on Q1 GDP. The inventory build this year looks more and more like it was unintentional. |
Consumption and Distribution |
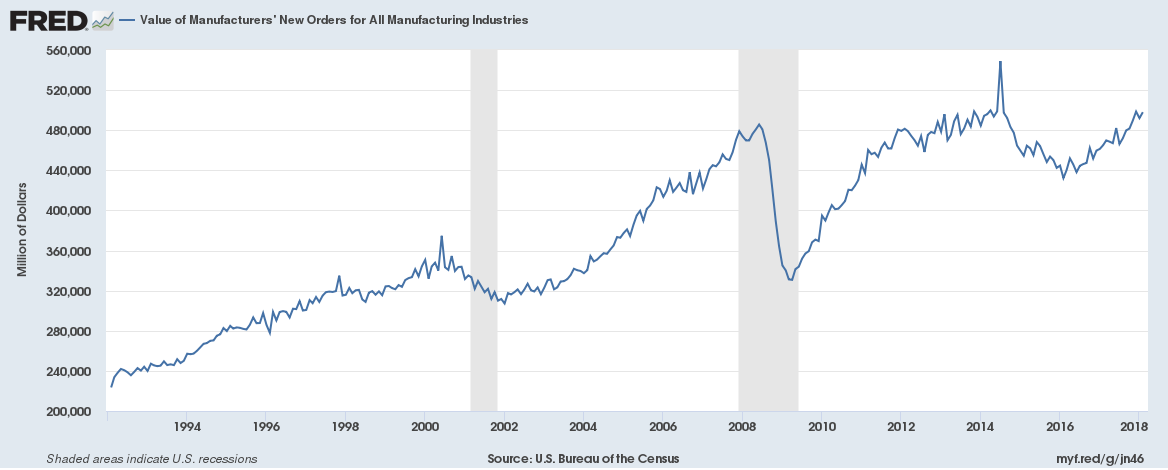
OrdersFactory orders look pretty decent year over year but February was definitely weaker than expected. Ex-transportation orders were up just 0.1%. And frankly, even that number may have been inflated. Orders for primary metals surged 2.8% in what is a pretty obvious attempt to get ahead of the Trump administration’s tariffs on aluminum and steel. |
Orders |
| From a longer term perspective, orders today are no higher than they were in 2013 and not a lot higher than they were back in 2008. |
Value of Manufacturers' New Orders for all Manufacturing Industries, 1994 - 2018 |
TradеDespite all the rhetoric on trade, the actual trade numbers haven’t been that bad. Exports and imports were both higher with vehicles and capital goods leading the way for both. But the trade deficit itself expanded which will be a negative for Q1 GDP. |
Trade |
InflationThe Fed’s preferred inflation gauge, the PCE deflator, is still quite a ways from their target. If the Fed is really concerned about inflation they should concentrate on the rise in housing prices. After the last housing bubble, how can the Fed not be alarmed at house prices rising at 4 times the rate of core PCE? |
Inflation |
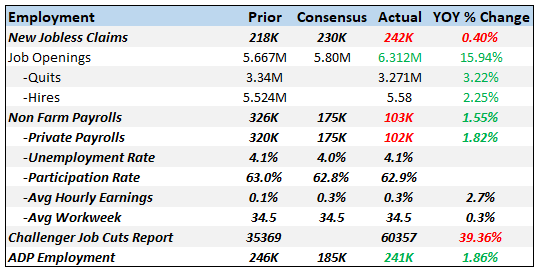
EmploymentOne month obviously doesn’t make a trend but what about six? That’s how long the unemployment rate has been stuck at 4.1%. Maybe it means something, maybe it doesn’t since there are a lot of reasons the rate might remain unchanged and all of them are not bad. But before the unemployment rate rises it has to stop falling and it appears to have done so. Of course, the Fed is probably happy about that since they still believe in the oft discredited Phillips Curve. While the ADP report showed little sign of weakness, the other two employment related reports were not as positive. The Challenger Jobs Cut report jumped to over 60,000, a big rise from last month and last year. The culprit shouldn’t be surprising – retailers. Which is interesting because last month’s official employment report showed a big jump in retail hiring. Which is right? Based on all the empty retail space I see around, I’d say somebody down at BLS needs to take a closer look at last month’s report which was actually revised higher last week. The official employment report this month wasn’t that rosy either, coming in at just 103,000 jobs. Revisions between January and February were a net -50,000. That is not a good trend, February’s good numbers notwithstanding. Jobless claims also jumped but are not yet worrisome. I generally get worried when the year over year change in the 4 week moving average of claims turns up and we aren’t close to that yet. One caveat to consider though. Claims may lag more than normal in this cycle due to the expansion of the “gig economy”. Gigs may feel like jobs but they really aren’t; you won’t find a line on your 1099 for unemployment insurance and if the gig ends you won’t be able to collect benefits. When the economy does start to soften, I would expect the contractors to get the axe first and that will not show up in initial claims. |
Employment |
ConstructionConstruction activity continues to disappoint. Spending last month was up just 0.1% as home improvement spending fell sharply. Multi-family construction is still fading, up just 0.9% year over year. |
Construction |
SentimentSentiment is near the highs of the cycle and like a lot of the regional Fed surveys and the ISM reports have no where to go but down. That doesn’t mean sentiment has turned sour but it can’t get a lot better. |
|
Market Indicators10-Year Treasury Note YieldThe 10 year Treasury note yield continues to drift lower, down about 4 basis points since the last update. Nominal growth expectations are moderating but as I said above, the change is minor so far. |
US Treasury Yield Index, Sep 2017 - Apr 2018 |
10-Year TIPS YieldThe 10 year TIPS yield was basically unchanged since the last update and is still stuck in the range that has prevailed since 2013. Until this breaks out decisively, my expectations for real growth won’t change. Real interest rates are the intersection of savings and investment and until this is a bigger positive number I can’t get too excited. For context, real rates in the last expansion were around 2% for the entire cycle and that was during a period when investment wasn’t that strong. Today, real rates are less than half that. |
Treasury Inflation - Indexed Security, Constant Maturity, Jul 2013 - Jan 2018 |
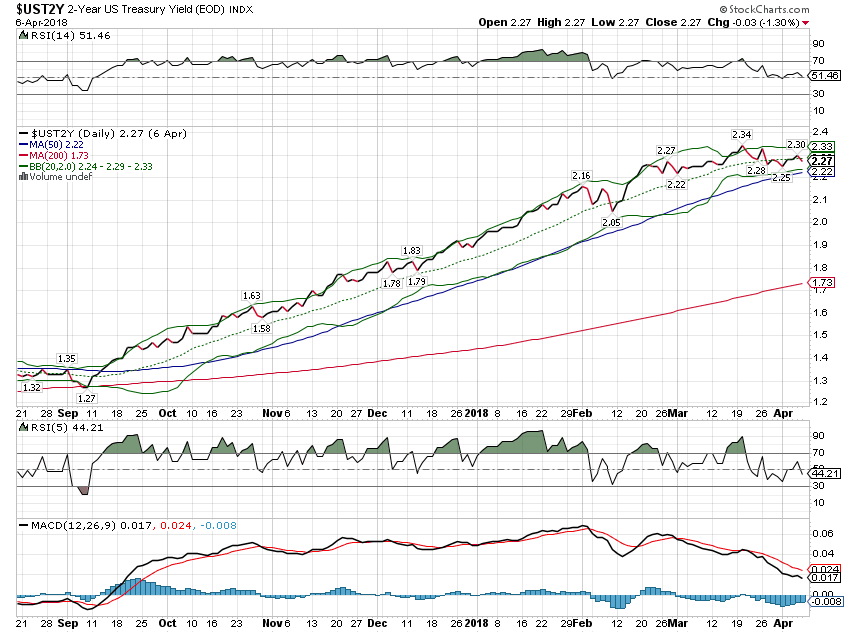
2-Year Treasury YeldThe yield curve flattened some since the last update but it was a different sort of flattening. Long term rates have been coming down but short term rates have stalled since the beginning of March and actually fell a little since mid-month. This could be a change in expectations regarding Fed policy or it could be the market leading the way and telling the Fed that growth is peaking. For now, it is short term and not large so while it shouldn’t be ignored, it also shouldn’t be overemphasized. Essentially what this means is that growth expectations have stopped rising. |
US Treasury Yield Index, Sep 2017 - Apr 2018 |
10/2 Yield CurveThe yield curve flattening trend has obviously returned but we aren’t flat yet. We also aren’t seeing the normal pattern we see right before recession. The curve will actually steepen rapidly right before recession as short term rates collapse faster than long term rates. That’s generally a sign the market is starting to price in rate cuts. Short rates have stopped rising – for now – but I don’t think anyone seriously expects the Fed to be cutting rates this year. Hmmm….. |
Yield Curve - 2 Year Bonds Index, Sep 2017 - Apr 2018 |
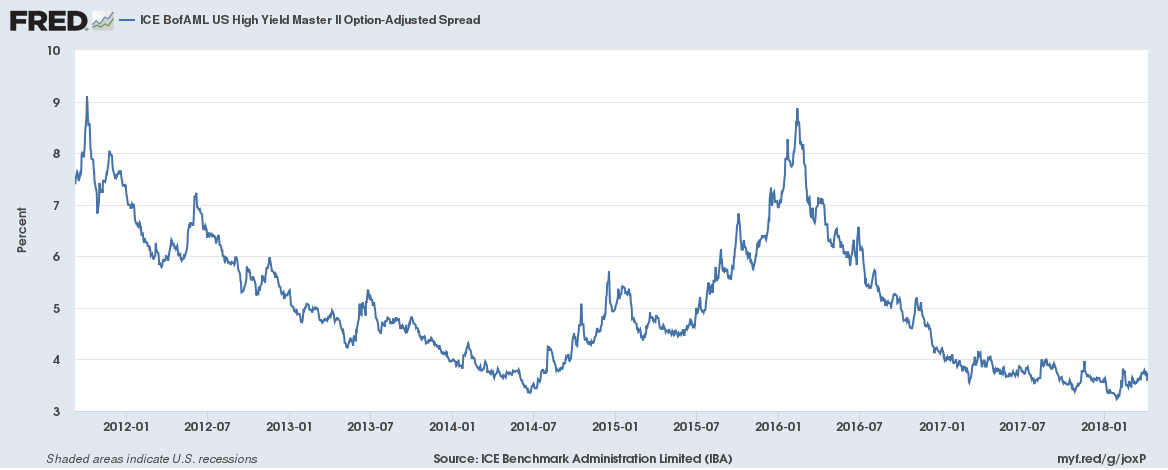
Credit SpreadsCredit spreads have widened by about 11% since their nadir on January 26 but by only 14 basis points in March. Spreads have, for now, stopped narrowing but haven’t widened nearly enough to warrant serious concern. This just fits with the narrative of peaking growth expectations. |
ICE BofAML US High Yield Master II Option-Adjusted Spread, Jan 2012 - 2018 |
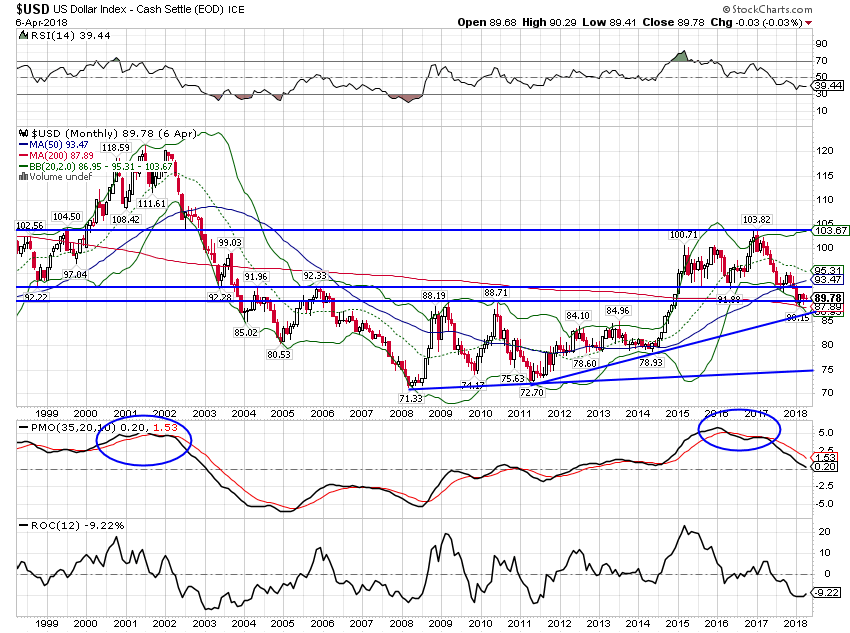
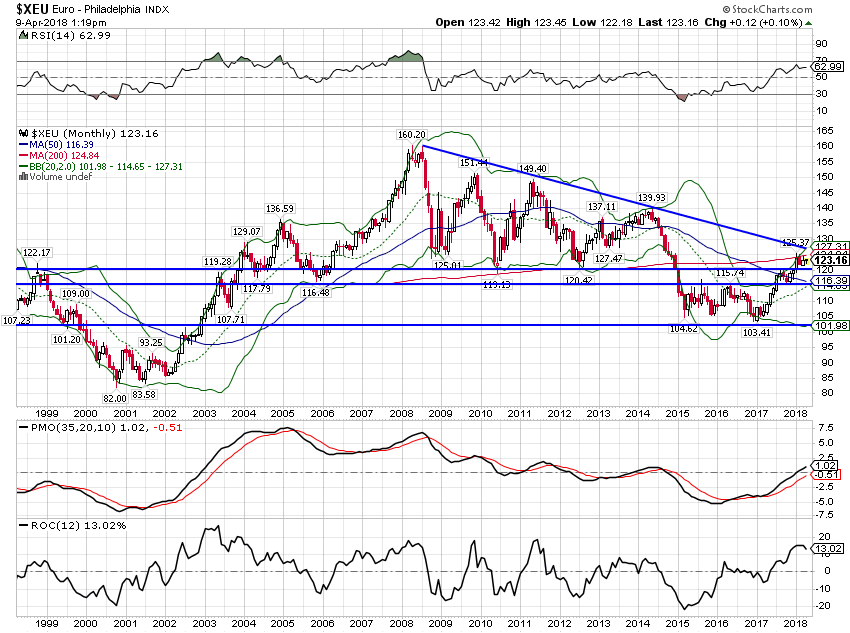
US DollarThe dollar’s descent has also been arrested, at least for the time being. As I’ve said many times, as long as the President and his Treasury Secretary want a weak dollar that is probably what they will get. President Trump’s attacks on business probably don’t help either. Any foreign company contemplating opening facilities in the US will probably think twice before subjecting themselves to the Twitter wrath of the President. With growth expectations seeming to moderate here and in the rest of the world, we may see the dollar just mark time until something emerges to push it either way. |
US Dollar Index - Cash Settle, 1999 - 2018 |
| Any foreign company contemplating opening facilities in the US will probably think twice before subjecting themselves to the Twitter wrath of the President. With growth expectations seeming to moderate here and in the rest of the world, we may see the dollar just mark time until something emerges to push it either way. |
Euro - Philadelphia Index, 1999 - 2018 |
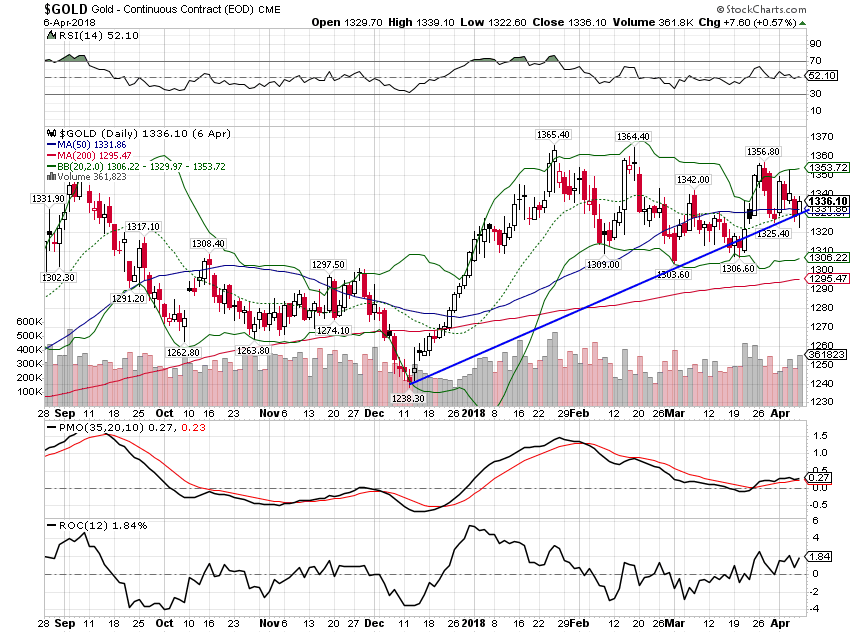
CommoditiesGold has outperformed in the commodity complex, another sign that growth is not foremost in investor’s minds. |
Gold Daily, Sep 2017 - Apr 2018 |
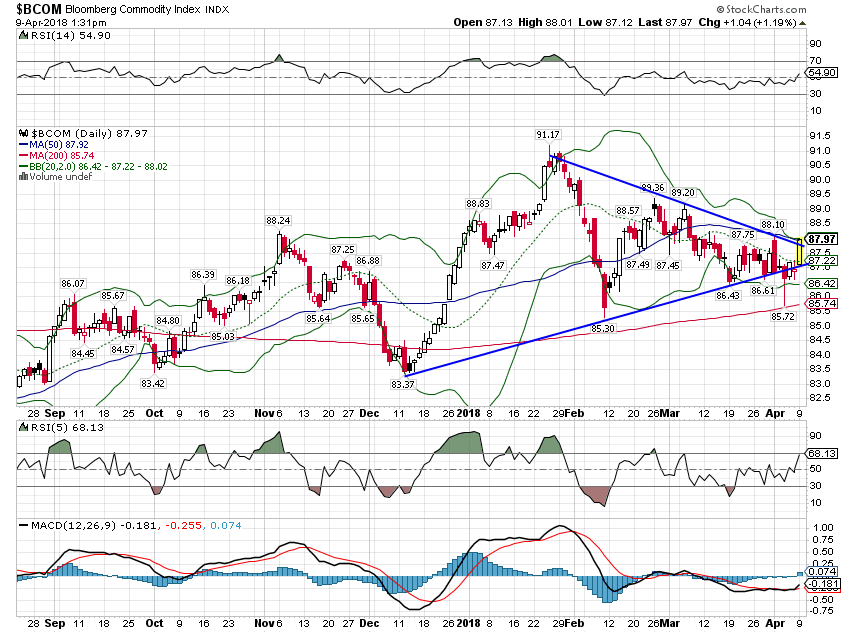
| But the Bloomberg commodity index has also broken its downtrend. The momentum shift from stocks to commodities has been slow but it continues. |
Bloomberg Commodity Index, Sep 2017 - Apr 2018 |
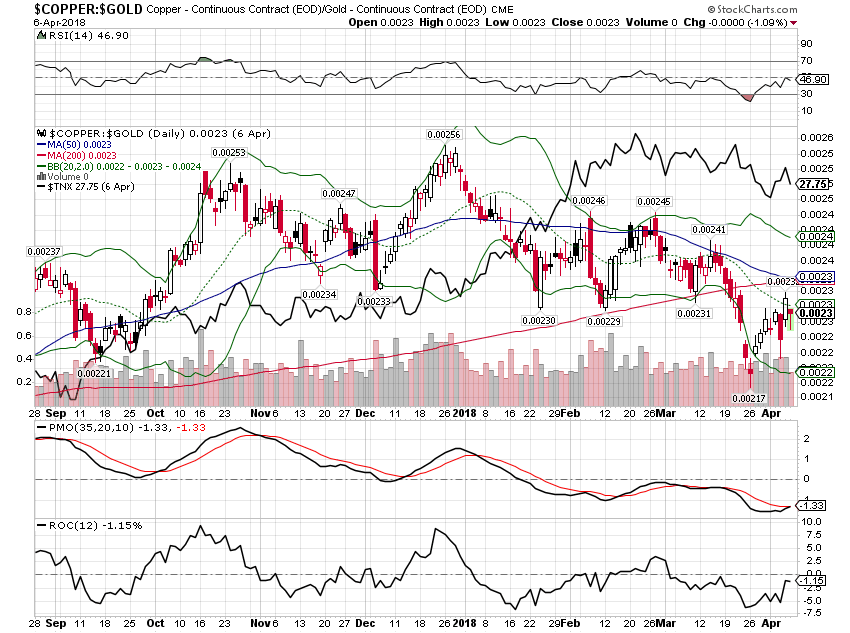
| The copper to gold ratio firmed up a bit since the last update. It looks like bond yields and this ratio may meet in the middle. |
Copper : Gold Daily, Sep 2017 - Apr 2018 |
Growth expectations have pulled back somewhat over the last few weeks as the economic data has softened. I’ve been saying for some time that growth is still in the range it has been in since mid-2013. That range is defined generally as 1.5% on the low end and 2.5% on the high end. Will we break out to a new higher, more satisfying level? I don’t know but markets will.When I talk to investors these days, they seem to have a great deal of anxiety about the economy and markets. And they seem to think it is my job to figure out what the economy will do and how markets will react. I’m not even sure if I could do the former if it would help me to do the latter. I feel strongly that it is markets that determine the course of the economy rather than the economy that determines the course of the markets. And markets run on emotion, an amalgam of millions of individuals’ choices, desires and fears. You can’t predict how the herd will turn or who it will run over next. If that’s what you or your advisor are trying to do, you are not investing. You are speculating.
Investing does not depend on your ability to do the impossible – predict the future. All it really requires is that you figure out the present. That isn’t as easy as it sounds but it is at least doable. It is when investors try to anticipate that they make mistakes. Assuming that you know how tax cuts or tariffs or some other policy will impact the economy and markets is a recipe for disaster. Success in investing, like so many things in life, is mostly about avoiding the big mistakes. This isn’t a game of perfect.
Tags: Alhambra Research,Bi-Weekly Economic Review,Bonds,commodities,consumer spending,credit spreads,currencies,economic growth,employment,Euro,Gold,inflation,Interest rates,Markets,newslettersent,PCE,Personal Income,stocks,tariffs,TIPS,Volatility,Yield Curve


