


Pater Tenebrarum
My articles My siteAbout meMy videosMy books
Follow on:TwitterSeeking AlphaFacebook
A Word on 1987 Analogies – Why Even Bother?As our friend Dimitri Speck noted in his recent update, the chart pattern of the SPX continues to follow famous crash antecedents quite closely, but obviously not precisely. In particular, the decisive trendline break was rejected for the moment. If the market were to follow the 1987 analog with precision, it would already have crashed this week. Nevertheless, we wanted to show one more parallel in connection with the previously discussed “flight to fantasy” effect. As we mentioned when we posted this chart, the divergent DJIA/NDX peaks we could recently observe happened in 1987 as well. Here is a chart of the event: |
DJIA and NDX Daily, May - Nov 1987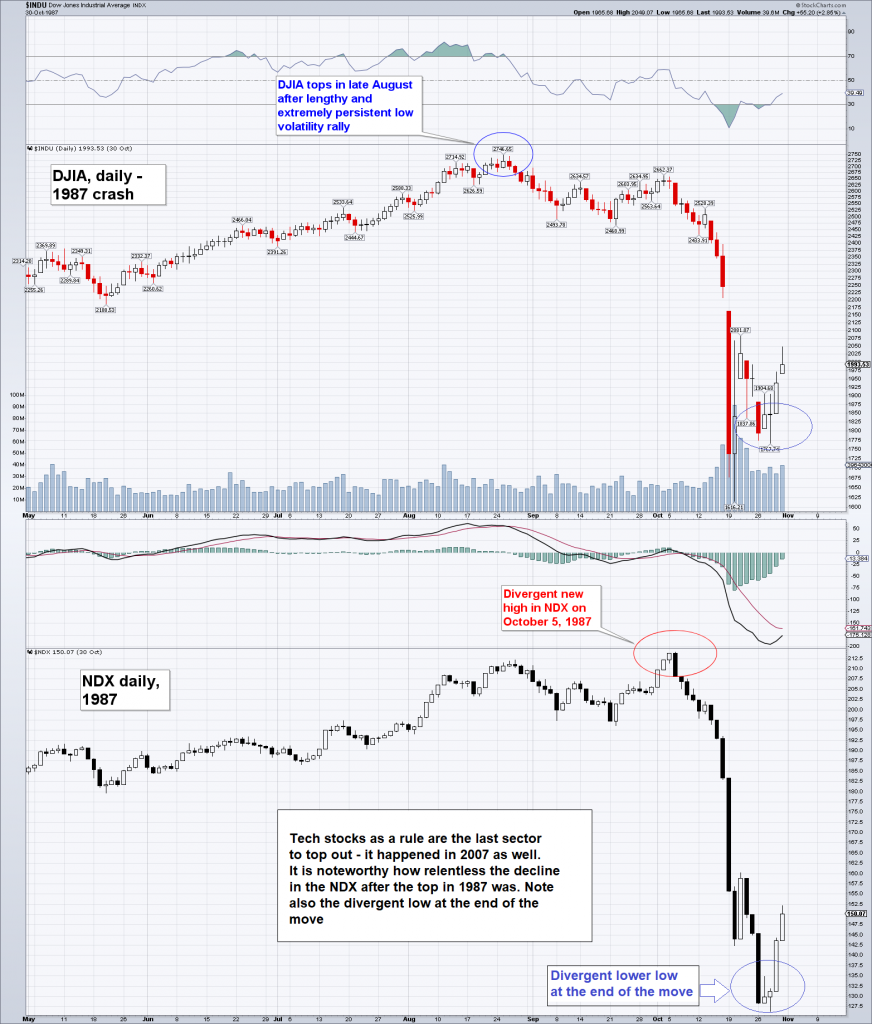 Divergent highs and lows in the NDX compared to the DJIA in 1987. - Click to enlarge The similarity with the recent divergence at the peak – which took even almost the same time to develop (DJIA peak on Jan 26 vs. NDX on March 12) – is quite glaring. It is one of several reasons why we believe the January top in the major benchmark indexes may turn out to be a significant one, regardless of whether an 87-style crash wave develops. |
| Why even bother with such comparisons? Although crashes are exceedingly rare events, 1987 in particular is quite interesting to us. For one thing, because the decline happened despite the fact that no recession was in sight and for another because of what did happen ahead of the crash:
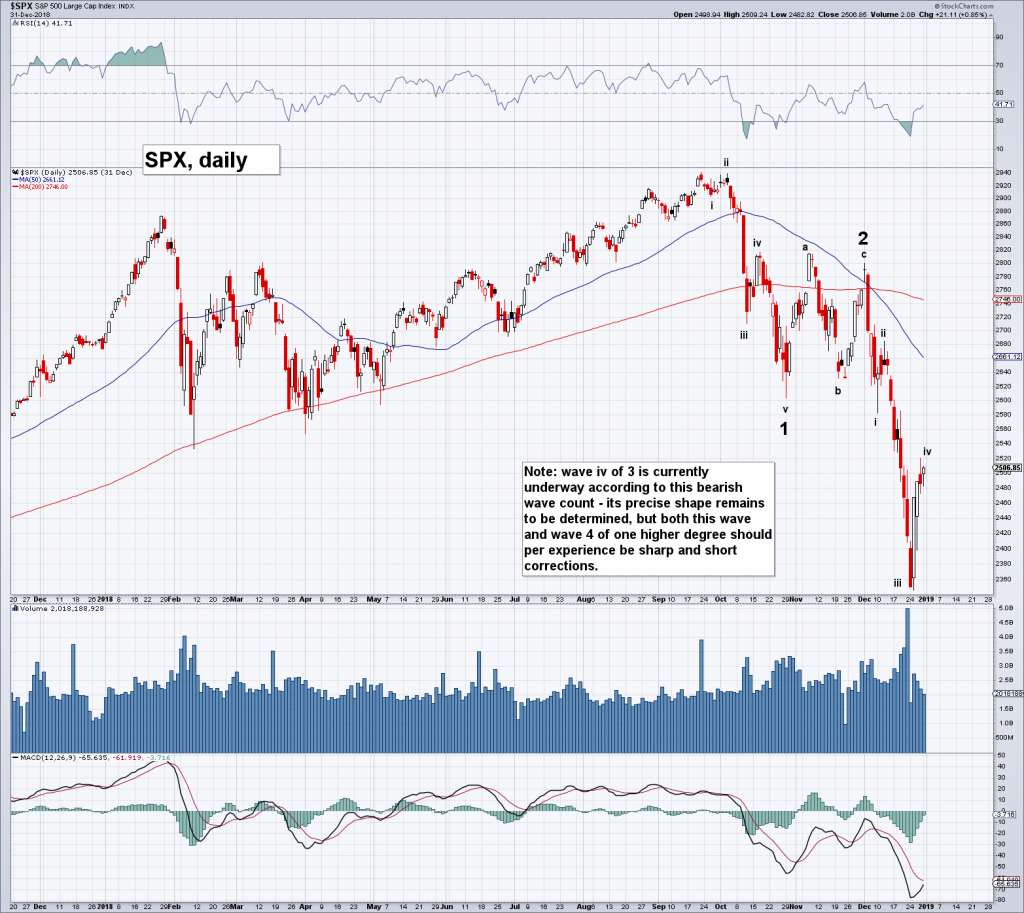
All of these characteristics apply to today’s market as well – including the fact that economic indicators are not warning of an imminent recession just yet (it should be noted though that coincident indicators suggest that economic growth is weakening as Mish points out here. We remarked on the odd decline in the Fed’s US leading index back in early November already, when we pondered the odd behavior of credit spreads (more on the latter topic in the next post). As regular readers know, we always keep a very close eye on money supply growth, as we consider it particularly important for trends in risk asset prices. US TMS-2 growth currently stands at 2.67% y/y, the lowest since early 2007; even euro area M1 growth has declined to less than 8% y/y by now, which is the lowest level since early 2015 – essentially it has been cut in half. Here is a chart showing how money supply growth rates in the two currency areas have evolved over time. What strikes us as the potentially most important similarity remains the surge in quantitative/ computerized trading strategies (which is exacerbated by the vast increase in passive vs. active investing these days). We can only repeat in this context that these strategies remain untested in a bear market. What we do know for certain is that they can dish up large surprise declines such as the May 2010 flash crash and the August 2015 mini crash (see our annotated chart here), both of which were highly unusual events. Naturally, all of these things have to be seen in the context of valuations – if not for the fact that this is one of the most overvalued markets in history, we would certainly not consider the possibility of a crash wave. Lastly, the fact that the recent chart pattern is deviating from its historical antecedents in several details is not necessarily relevant – chart patterns often rhyme, but they are never exactly the same. Nevertheless, the many similarities between them do tell us that the market’s psychological set-up is essentially the same – which has to be regarded as a warning sign. |
US True Money Supply, Feb 1996 - 2018 and US True Money Supply, 1980 - 2018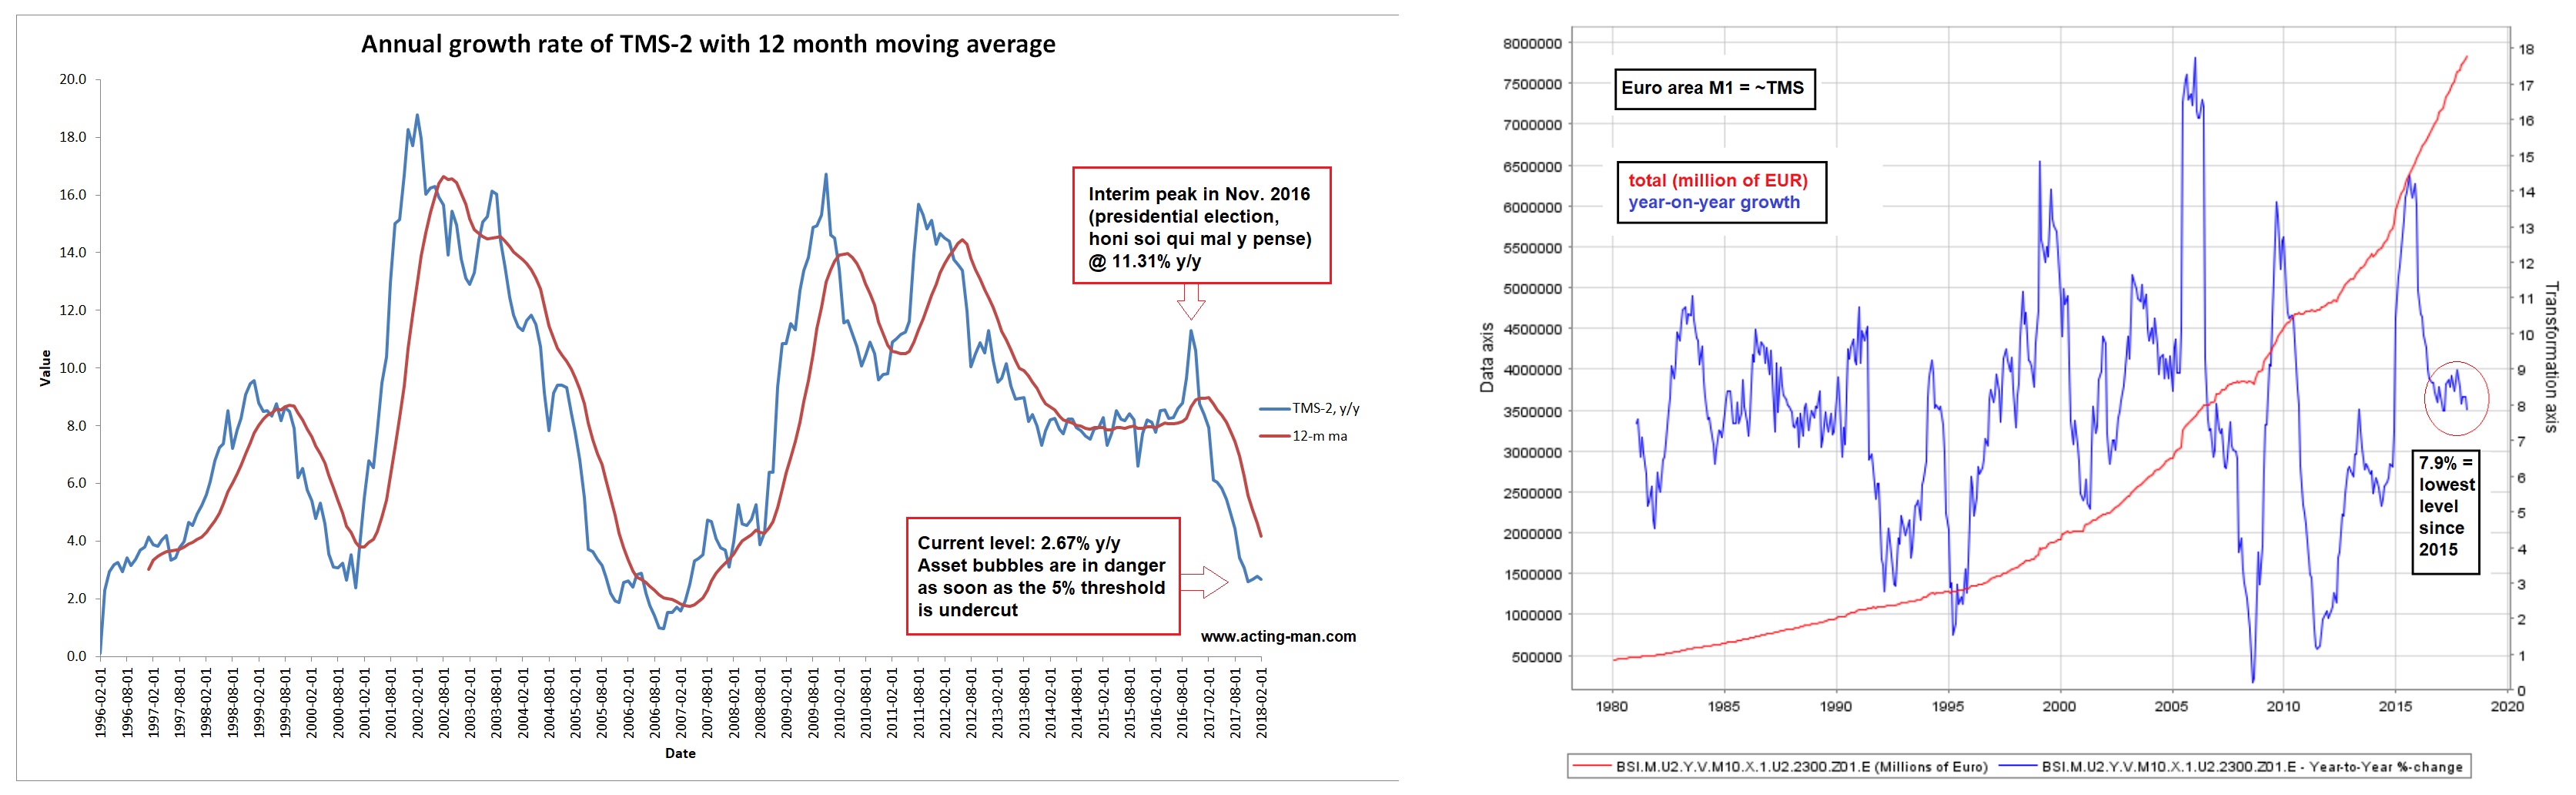 True money supply growth in the US and the euro area – in the US it has declined well into the danger zone, in Europe it has declined to the lowest level since 2015, even if it remains fairly brisk historically. - Click to enlarge But ECB pumping has been halved this year, and bank lending is dead as a door nail, so this growth rate is bound to fall further in short order. |
Market Psychology – The Dip Buying FrenzyThe psychology surrounding recent market gyrations is quite interesting to us. As we have previously pointed out (see the “Augustine of Hippo Plea”), there are quite a few market observers and participants who are skeptical of valuations and believe that rising interest rates create a hostile environment for stocks (true enough). While they expect that a financial accident is bound to happen, for some reason they nevertheless seem to believe that it won’t happen now. Presumably they would prefer the September to October time frame, since that would be more convenient. Our friend Dimitri Speck has actually done a small private survey on this question and has found additional anecdotal confirmation of this idea; some skeptics are apparently even long FANG stocks because they expect to see “one more new high”. The results of Dimitri’s private survey were underpinned by even more anecdotal confirmation, inter alia by an analyst who to our knowlede has forecast imminent crashes almost daily for several years. He suddenly thinks there will be a “final blow-off”, which we found rather surprising. His past posts indicate that this is a completely new idea – in fact, just one week earlier, he was still firmly convinced that another leg down to lower prices was imminent. Maybe he just doesn’t want to be right about anything ever (we would settle for a coin flip ourselves). We thought the market action in January was impetuous enough to qualify for a blow-off, but we concede of course that an even bigger one can never be completely ruled out. Last Friday, when the market closed at a new low for the move, the Rydex bull/bear ratio closed just below 30 to our surprise – for comparison, it peaked at less than 18 at the top of the tech mania in early 2000. Rydex bear assets were barely off an all time low at the end of last week, a sign that many bears used the first small bounce they had seen in ages to immediately get out of their positions. Earlier this year, during the run-up into the January peak (with the DJIA’s weekly RSI reaching a rather memorable record high of 92), Bloomberg reported that short positions in SPY had actually declined to zero for a brief moment. This is an instrument with huge options open interest (there is an expiration every two to three days). How can it possibly ever have short interest of zero? And yet, it actually happened: Obviously, enthusiasm was quite pronounced in January, as many other indicators showed as well. But what about now? Consider the following statistical tidbit courtesy of Bloomberg, which is really quite astonishing and once again indicates that almost no-one is prepared for the possibility that untoward developments may be on the way rather more quickly. In a Bloomberg article after the February sell-off we learned that “Buy the Dip Goes Mainstream”:
|
S&P 500 ETF and MSCI Emerging Markets ETF, 2007 - 2017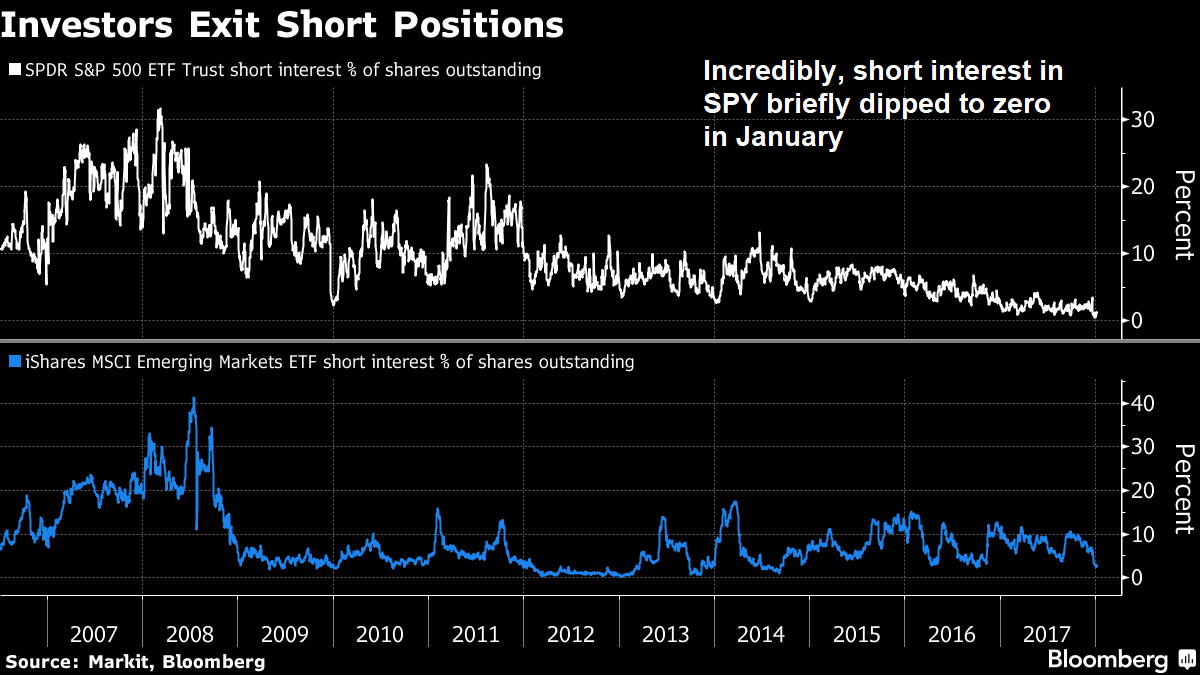 Short interest in SPY and EEM (the MSCI emerging markets ETF). In SPY it briefly touched zero in early January, which is highly unusual, to say the least. It has happened in EEM a few times in the past, but EEM is a midget in terms of AUM and options open interest compared to SPY. - Click to enlarge |
| Bloomberg even provided a chart, so we can compare the intensity of the dip buying admonitions issued in February to past occasions. As can be seen, the advice is often not so bad – but sometimes it does come at the wrong moment. For instance, in 2015 the admonitions spiked just before the biggest sell-off in years. The surges of dip-buying advice on the initial market corrections in 2007 were rather ill-timed as well. We would guess that the signal has to be brought into context with valuations and all the other factors we mentioned above. |
Stories Mentioning "buy the dip" and S&P 500 Index, 2007 - 2017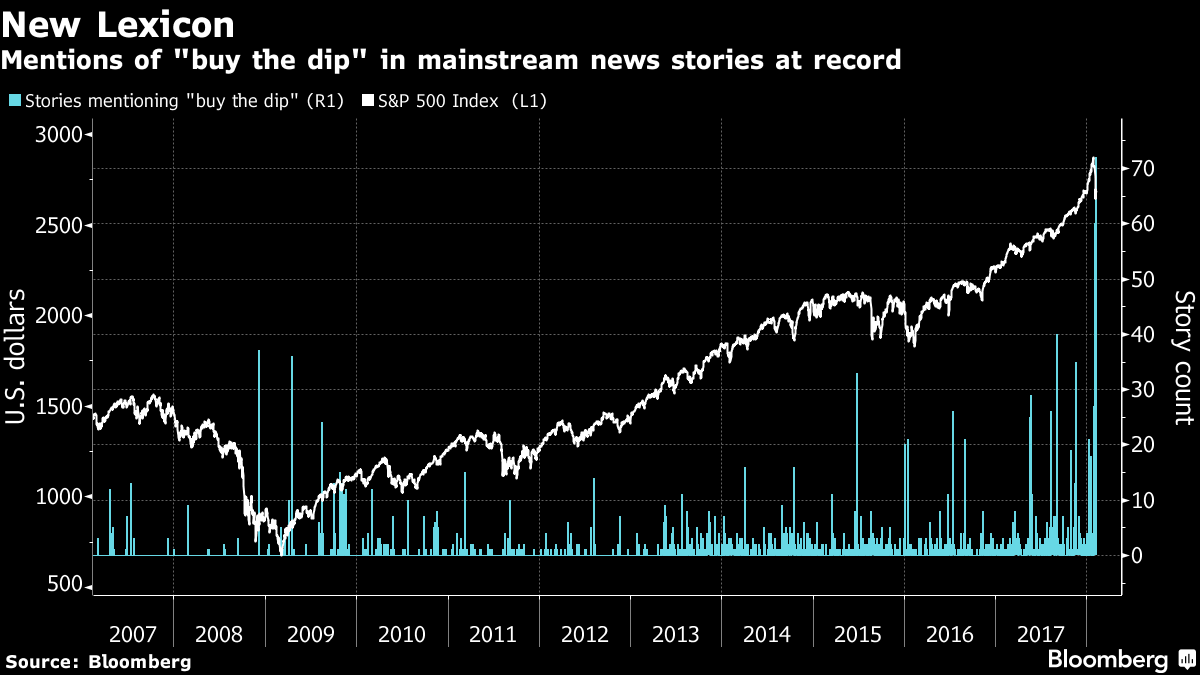 “Buy the dip” mentions in the media surge to a record high in the fact of the recent sell-off – exceeding previous records by about 100%. - Click to enlarge Note also the increasing frequency of dip buying advice in H2 2017. |
What the Hell is GBEB?Lastly, readers may wonder about the title of this post. The acronym “GBEB” is short for “Great Bernanke Echo Bubble” ™. We believe the bubble deserves to be named after its progenitor, under whose reign at the Fed quantitative easing (i.e., money printing on a breath-taking scale) was introduced and indulged in rather liberally. Alas, it may well be time to think about preparing the pompes funèbres for the good chairman’s wealth-effect brainchild.
Addendum:According to Frank Roellinger, the Modified Ned Davis Method went 50% net short last Friday (3/23) at a Russell 2000 close of 1510.08. |
 Painting by Sharon Hatley - Click to enlarge Adios, GBEB! We hardly knew ye… |
Tags: Chart Update,newslettersent,The Stock Market


