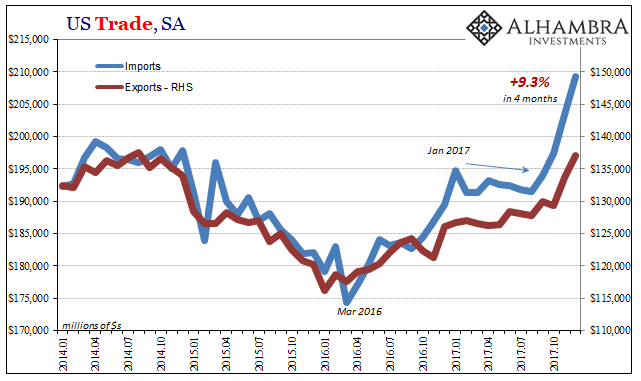
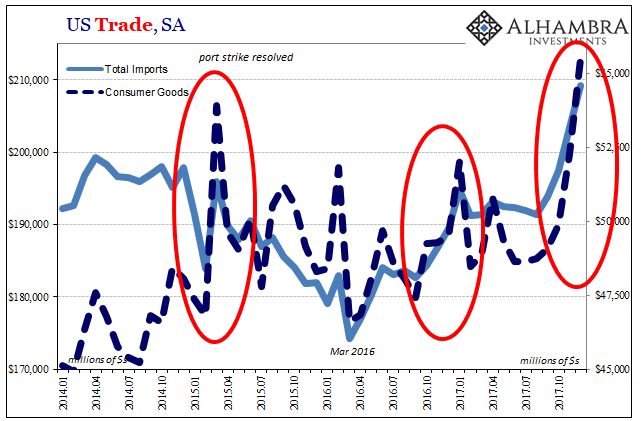
| US imports rocketed higher once again in December, according to just-released estimates from the Census Bureau. Since August 2017, the US economy has been adding foreign goods at an impressive pace. Year-over-year (SA), imports are up just 10.4% (only 9% unadjusted) but 9.3% was in just those last four months. For most of 2017, imports were flat and even lower.
The question is, obviously, what has changed? Did the boom finally ignite, Janet Yellen’s last goodbye a happy sendoff? |
US Trade Balance, Jan 2014 - 2018(see more posts on U.S. Trade Balance, ) |
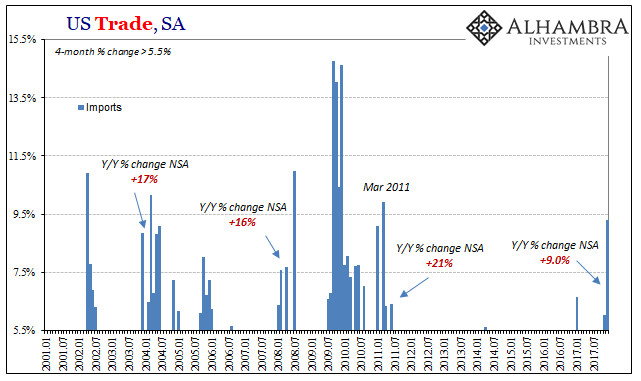
| To begin with, we haven’t seen this kind of short-term burst of import activity in seven years. Not since early 2011 have such large gains been recorded in such a short period of time. Of course, what stands out about that particular point in economic history was: |
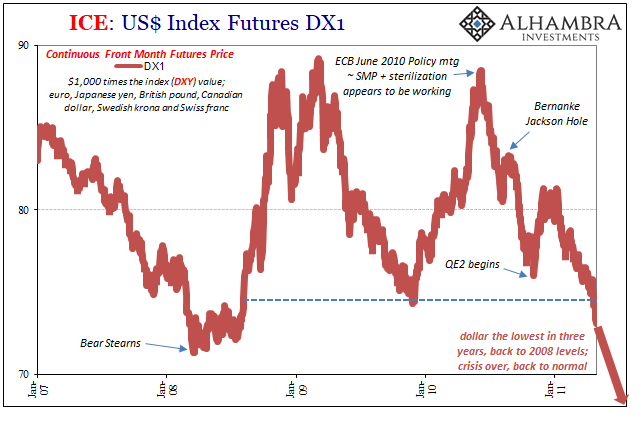
US Dollar Index Futures, Jan 2007 - 2011(see more posts on U.S. Dollar Index, ) |
| Between the middle of 2010 and late April 2011, the dollar fell precipitously against all major currencies. Imports rose both as a matter of cyclical factors coming out of the Great “Recession”, but also as Americans were forced to pay more for foreign goods as the dollar priced toward “reflation.”
Economic theory posits that this weak dollar should make imports more expensive, and it does. But that never seems to lead toward the expected trade rebalancing. In other words, we still import the same amount stuff, only we have to pay more for it all. It contributes a little to the inflation baseline of any economy. |
US Trade Balance, Jan 2001 - 2018(see more posts on U.S. Trade Balance, ) |
| In the 21st century, these kinds of big movements for inbound trade are usually associated with impressive and full recovery. That’s surely what many are hoping is happening right now. But it also has occurred, like late 2005, when the dollar falls sharply under more questionable economic conditions. Those recoveries featured nearer 20% annual gains, not half that rate.
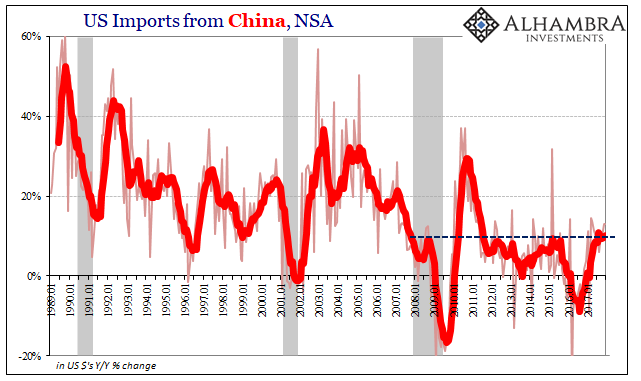
We can check these assumptions a couple of different ways. The first is imports by geographical distribution. An uptick in demand, of the organic variety, would benefit first and foremost China. Unless somehow the US manufacturing sector was able to rebuild its productive capacity all in the year 2017 without it showing up in any economic statistic, a pickup in goods trade will mean a direct pickup in Chinese imports. |
US Imports from China, Jan 1989 - 2018 |
| Instead, imports from China were up 13% year-over-year in December. That sounds impressive but is really the same low level that has prevailed since 2012. It just doesn’t suggest any acceleration in demand, at least not in the same manner and capacity as had been consistent with increasing growth. We don’t even find a currency impact despite CNY.
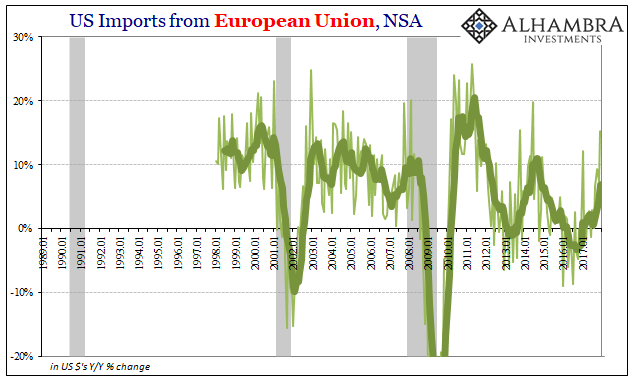
The area seeing the most additional American demand was Europe. Imports from the EU jumped 15.3% in December, accelerating sharply from a 7.5% gain in November. Unlike China, Europe hasn’t seen that much growth from the US in years. It was the highest gain going back to 2014. |
US Imports from European Union, Jan 1989 - 2018 |
| After rising somewhat between September and November, by December the euro had resumed its decline. Given that the currency translation had bottomed out at the end of 2016, December 2017 was the maximum annual gain for Europe’s currency. China’s currency has been rising, too, against the dollar but imports did not move with CNY.
Taking imports by category, as I did last month, we find that the majority of this 4-month import surge came in the form of consumer goods. While that may be related to the falling dollar, too, it is perhaps more likely the remnants of Harvey and Irma. |
US Trade Balance, Jan 2014 - 2018(see more posts on U.S. Trade Balance, ) |
The timing of the shift really leaves little doubt. Imports of consumer goods had been flat and lower since 2015. Then out of nowhere they shoot upward starting in September 2017 for no outwardly apparent reason other than hurricanes. The last time they went so far so fast was in early 2015 with the resolution of the West Coast port strikes.
Together with the dollar, it would suggest this unusual surge of import activity is some combination of inflationary currency and the anticipated aftereffects of serious storm-related economic disruptions. In seasonally adjusted terms, imports rose about $20 billion in 2017. In constant 2009 $s, the gain was only a little more than half that – meaning that a little less than $10 billion of the annual increase was due to price changes. It’s likely that over the remain $10 or $11 billion, given the timing, the vast majority ended up in Texas or Florida (or in transit to Texas and Florida).
Unlike in economic theory, these are no real benefits to the economy. In the real world, a lower currency doesn’t mean you import less, it means you pay more for the things you import anyway (just ask Brazil). It is a mildly inflationary pressure that so far hasn’t shown up in inflation calculations, but is nonetheless an economic drag. I’m sure at this point Janet Yellen will take it no matter that.
And as we’ve stated from the moment of Harvey’s strike, the broken windows fallacy will be proved yet again. Though a temporary boost, at some point that will fade and demand should adjust back to the prior pre-storm baseline (which was slightly lower imports and demand) if not worse because someone will have to pay for all those literal broken (car) windows.
Full story here Are you the author? Previous post See more for Next postTags: $CNY,China,currencies,dollar,economy,Euro,Europe,exports,Federal Reserve/Monetary Policy,global trade,imports,inflation,Markets,newslettersent,U.S. Dollar Index,U.S. Trade Balance,yuan


