Marc Chandler
My articles My offerMy siteAbout meMy videosMy books
Follow on:LinkedINTwitterSeeking AlphaAmazon
![]() Introduction by
Introduction by
George Dorgan
My articles
My siteAbout meMy videosMy books
Follow on:LinkedINTwitterSeeking Alpha
CFA SocietyEconomicBlogs
Summary:
Speculators have a large net short 10-year Treasury position.
The gross short position is a record.
CPI is likely to be softer, while retail sales may show a still robust consumer.
| The US reports January CPI figures tomorrow. The market seems especially sensitive to it. The main narrative is that it is an inflation scare spurred by the jump in January average hourly earnings that pushed yields higher and unhinged the stock market.
This Great Graphic comes from Bloomberg and is derived from data issued by the Commodity Futures Trading Commission (CFTC). When trading futures, one must declare whether one has an underlying business interest (commercial) or not (non-commercial). Non-commercial participants are speculators. This chart shows the net position, which is a combination of gross longs and gross shorts. The chart shows that the net speculative short position is approaching the record high seen in Q1 17. A year ago, some keen observers were warning that the bearish view was excessive, but this year, some of the same observers are warning of even higher yields ahead. Yet, if anything, the net position conceals an extreme gross position. Specifically, as of last Tuesday, 6 February, the large speculators had a record gross short 10-year Treasury futures position. It stood at 939k contracts. The previous record from a year ago was 882k. The fact that the net position is not at a record means that the gross long position is greater than it was a year ago. |
Large Specs Futures, 2013 - 2018 - Click to enlarge |
As of last Tuesday, the large speculators had a gross long position of 612k contracts. A year ago, it was around 470k contracts. The speculative gross long position peaked last May just shy of 950k contracts, which is roughly the size of the gross short position now.
In January 2017, the CPI rose 0.5% on the month. The January 2018 CPI is expected to have risen by 0.3%. This is why despite the rise in prices, the year-over-year pace is expected to slow to 1.9% from 2.1%. It would be the first reading below 2.0% since last August.
Similarly, the 0.3% rise in January 2017 core rate will drop out of the comparison and be replaced with a likely 0.2% increase. This is consistent with the year-over-year pace slipping from 1.8% to 1.7%. The 1.7% matches the low from last year after the core rate began at 2.3% in January 2017.
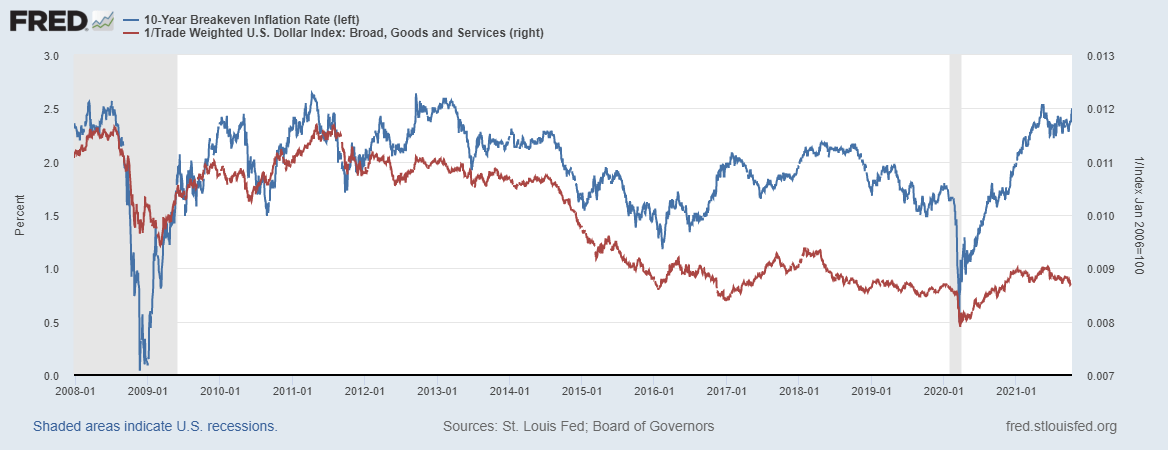
We have argued that the recent rise in yields appears to be more a function of real rates. Real rates are difficult to observe, but we backed into them by making some simple assumptions. We assume that there are two components to nominal rates. Real and a term premium, which for the purposes of this exercise, we simply as inflation expectations. We use market-based measures like breakeven rates to show that nominal rates have increased much more than inflation expectations.
It is not that we are not concerned about inflation. Our point is more modest. Inflation expectations remain in check. We link the increase in real rates to growing concerns about supply (more) and demand (less from Fed and possibly less by corporations parking earnings booked offshore into fixed income products). We suspect the inflation story is premature. We look for inflation to begin rising more noticeably starting in late Q1 and running into Q3.
At the same time that the January CPI is reported, the US will also release January retail sales. Autos and gasoline likely tempered the headline, while underlying measures should be firm. The headline may slow to 0.2% from 0.4% in December. Excluding autos, retail sales may have risen by 0.5%. The components used for GDP calculations may rise a bit, but it will be difficult to match the 0.75 monthly average in Q4, which was the strongest three-month period since April 2014. Still, the US consumer is alive and well, and according to the NY Fed, American households increased their debt by $193 bln in Q4 to a new record of $13.15 trillion. It is about $440 bln more than the last cyclical peak in Q3 08.
Full story here Are you the author?Tags: $TLT,Commitment of Traders,Great Graphic,inflation expectations,newslettersent