Pater Tenebrarum
My articles My siteAbout meMy videosMy books
Follow on:TwitterSeeking AlphaFacebook
Early Warning Signals in a Fragile System[ed note: here is Part 1; if you have missed it, best go there and start reading from the beginning] We recently received the following charts via email with a query whether they should worry stock market investors. They show two short term interest rates, namely the 2-year t-note yield and 3 month t-bill discount rate. Evidently the moves in short term rates over the past ~18 – 24 months were quite large, even if their absolute levels remain historically low. |
US Treasury Yield, Jul 2015 - Nov 2017(see more posts on U.S. Treasuries, )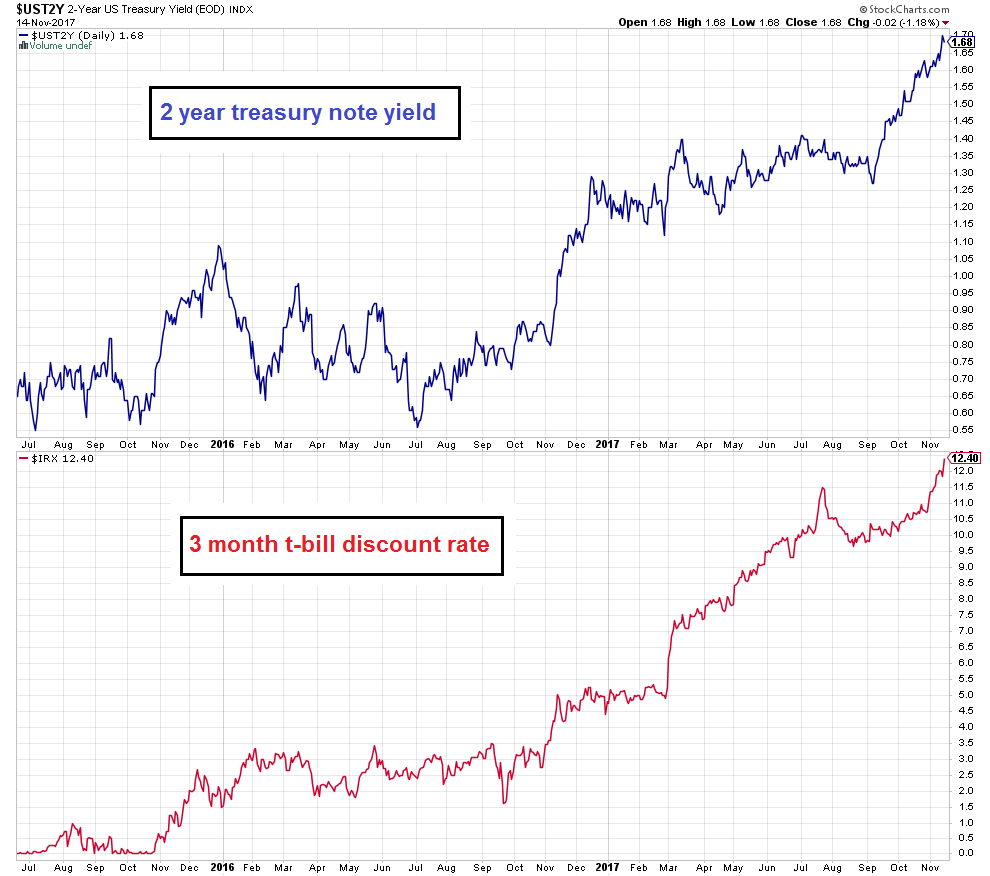 Sizable moves higher in short term interest rates were recorded over the past two years. - Click to enlarge 2 year note yields only started moving up in mid 2016, but the surge in t-bill discount rates has been in train since late 2015 already. The moves in short term rates come from extremely low levels, but they are nevertheless quite noteworthy |
| The first thing that comes to mind in connection with asset prices is that the cost of carry for leveraged positions is rising. Eventually this will have an effect on such positions, particularly in fixed-income instruments, which inter alia include structured products such as CLOs (collateralized loan obligations). Some market participants reportedly employ leverage of up to 1:10 in these in order to boost returns, which the banks are apparently happy to provide, as the risk is deemed to be low.
As we have discussed previously, CLOs are conceptually not different from the CMOs that created such heavy conniptions in 2007-2009, but CLOs ultimately turned out to be quite resilient at the time. The problem is of course that it is definitely not a given that they will be similarly resilient in the next crisis. Banks no longer have large proprietary books of corporate bonds, but by providing margin loans to investors who buy them on leverage, they remain exposed – and the degree of leverage is reminiscent of the margin requirements of Wall Street bucket-shops in the 1920s. Obviously these enhanced returns are highly dependent on borrowing costs, so rising short term rates are bound to become a problem at some point. As a more general remark: the central bank policy of suppressing rates to zero or close to zero provided the incentive for investors to take up enormous leverage, which is seen as the only way of obtaining half-way decent yields. In other words, central bank manipulation of interest rates has definitely made the financial system a lot more fragile. There is a feedback loop between the Federal Reserve’s interest rate policy and market rates, but market expectations are historically the main driver; it usually appears as though the Fed is simply following the lead of market rates. It should also be noted that market-based inflation expectations so far remain quite subdued. 5-year TIPS yields have oscillated between -10 to +30 basis points this year, after trading as high as 52 basis points in December 2015. |
US 5 Year Treasury Inflation, Jan 2013 - Jul 2017(see more posts on U.S. Treasuries, )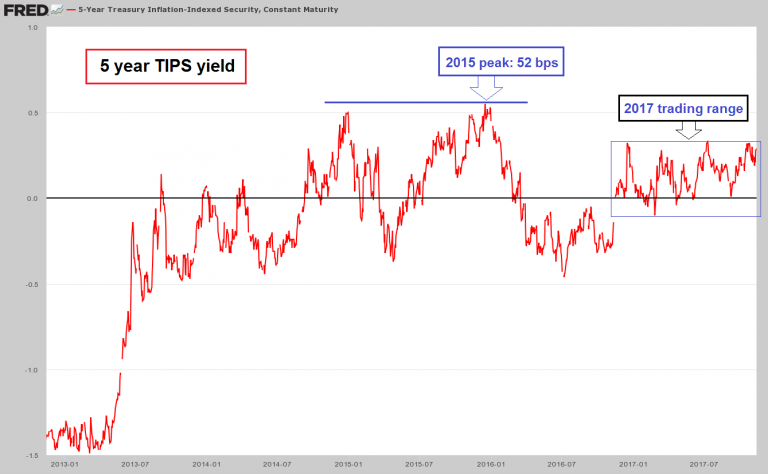 5 year TIPS yields are a good proxy for medium term real interest rates. - Click to enlarge They indicate that inflation expectations remain fairly subdued so far |
Free Capital Begins to Run ShortApart from increasing the cost of carry of leveraged positions, the surge in short term rates is a sign that the distortions in realtive prices underlying the current shape of the economy’s production structure may be about to flip-flop (i.e, the distortions that have led to investment being drawn toward capital goods production to the detriment of consumer goods production). Social time preference begins to reassert itself, and a shortage in “free capital” is beginning to emerge (this terminology was used by Richard von Strigl).* There is no limitless reserve army of workers one can draw from and real capital is scarce. Both have to be properly allocated, and as discussed in Part 1, the inter-temporal allocation process is regulated by interest rates. In a free market a decline of interest rates to near zero would indicate that time preferences are extremely low. By implication people would be saving a very large percentage of their income in such an environment (we assume these are mainly capitalist savings, i.e., they are made available to borrowers in the market). This has an important effect: it increases the size of the pool of real funding. Real savings consist of all the final products people could have consumed, but refrained from consuming because they decided to save and invest instead. They made a sacrifice in the present, in order to be able to consume more in the future. Note: there is no other way to grow the economy. |
Stages of Production and Interest Rate A chart illustrating what occurs in a free market without central bank interference (and assuming no credit expansion.**), after a decline in social time preference and a commensurate increase in savings. - Click to enlarge [legend: S= old level of savings, S’=new level of savings, D=demand for loanable funds, i-eq=old equilibrium interest rate, i’-eq=new equilibrium interest rate, C=consumption, I=investment]; [ed note: we have inserted the more descriptive image of the “Hayekian triangle” inside the blue rectangle in the lower left quadrant again as a conceptual aid – it is otherwise not part of this chart. The triangle is of course a highly simplified stand-in for the complex latticework of the economy’s capital structure, but it is obviously very useful for explaining the associated processes]. In the the top half of the chart, we see how the triangle is shaped before and after the increase in savings and investment. After the new savings are allocated, factors of production are withdrawn from the now comparatively less profitable lower stages (called “late stages” in the insert) and added to the higher stages. But that is not all: new stages that didn’t exist before are added, lengthening the production structure (this can also be thought of as an expansion in the division of labor). Ab initio this will increase production time, but it will at the same time increase productivity – the more roundabout production processes become, the more productive they will be, even if there is no advance in technology or production methods otherwise. Looking at the PPF (production possibilities frontier) to the right, we can see that the previous lower amount of savings and the associated “height” of the triangle intersected at a point indicating greater consumption and less investment, which is commensurate with higher time preferences. The new intersection on the PPF is at a point that indicated a shift in the consumption-investment balance in favor of investment. Overall, these are two snapshots in time, we essentially see the situation right before and right after the new savings and investments were added. At the particular point in time when S’ and i’-eq prevail, consumption is in fact smaller than it was before. Mr. Draghi and Ms. Yellen would no doubt be apoplectic, but as Friedrich Hayek reminded his fellow economists 85 years ago***: “Money spent today on consumption goods does not immediately increase the purchasing power of those who produce for the future; in fact, it actually competes with their demand, and their purchasing power is determined not by current but by past prices of consumer goods. This is so because the alternative of investing the available productive resources for a longer or a shorter period of time always exists. All those who tacitly assume that the demand for capital goods changes in proportion to the demand for consumer goods ignore the fact that it is impossible to consume more and yet simultaneously to defer consumption with the aim of increasing the stock of intermediate products.” (emphasis added) |
| Low interest rates thus signal to everyone in the market that investing in projects that may take a very long time to finish and will only bring forth finished consumer products at some point in the relatively far future has become a profitable proposition. One can now afford to engage in such investment projects, because a sufficient amount of saved final goods is available to feed, house and otherwise supply the people who will be working in more roundabout and time-consuming production processes. This is what we referred to as “free capital” above. In other words, what constitutes “capital” is actually a matter of perspective.
The effect lower interest rates exert on prices along the different stages of the production structure is comparable to their effect on the prices of bonds of different durations – the longer the maturity, the bigger the price increase will be. In addition to this, borrowing costs obviously decrease as well and capital-intensive investments often require taking on sizable debt. Thus one one can now for instance consider building new mines, new skyscrapers, Space-X rockets, and so forth. There is a big problem though: the market is not free of central bank interference and credit expansion ex nihilo is rampant. In reality, people have not increased their savings. Interest rates were manipulated by the central bank: it printed a lot of money, purchased bonds with it and lowered their yields in the process. This greatly increased the money supply and bank reserves as well, supplying the banks with the wherewithal to expand credit even further. In short, it only appeared as though more savings had become available – a false signal was sent. Since consumption was actually not restricted, the consumer goods needed to fund all those long term projects are actually not available and are produced in increasingly insufficient quantities as production factors are shifted to the higher stages. Note also that the early receivers of newly created money can exercise a claim on real goods without having to supply any real goods or services to the pool of real funding in return. This makes things more difficult for other market participants competing for the same capital – genuine wealth generation is actually hampered. Eventually the economy will end up tying up more consumer goods than it releases. At that point interest rates will begin to rise. As the realization spreads that the available funding is insufficient to finish numerous longer term investment projects that have been begun (which look less and less profitable as interest rates rise), a scramble to obtain credit ensues, which puts even more upward pressure on market rates. Commercial banks will at the same time become less willing to lend and begin to tighten their lending standards. Developments on the “real side” and the “money side” will converge at this juncture, as there is literally “nothing left to lend” if the pool of real funding is no longer able to support all extant investment projects. Of course banks have no way of quantifying or ascertaining the state of the pool of real funding directly; they only see that market rates are rising, and that many of the projects in question therefore appear increasingly less profitable and the entrepreneurs engaged in them are less likely to be able to repay their loans. Soon it turns out that the entire structure of production will have to be temporarily shortened and completely rearranged in order to bring the consumption-investment balance back to a sustainable configuration – that is when the economic bust is here. Obviously this process is attended by numerous difficulties due to the heterogeneity of capital (the same applies to labor actually; it isn’t just a homogeneous blob either). The less specific capital goods are, the easier it will be to transform them or employ them differently. But highly specific capital goods in business lines in which future demand was misjudged in the course of the credit expansion will end up being liquidated. In many cases it will turn out that the accounting profits made during the boom were illusory, and it will become clear that instead of distributing profits, many companies have simply consumed their capital. |
US Industrial Production, 1990 - 2016(see more posts on U.S. Industrial Production, )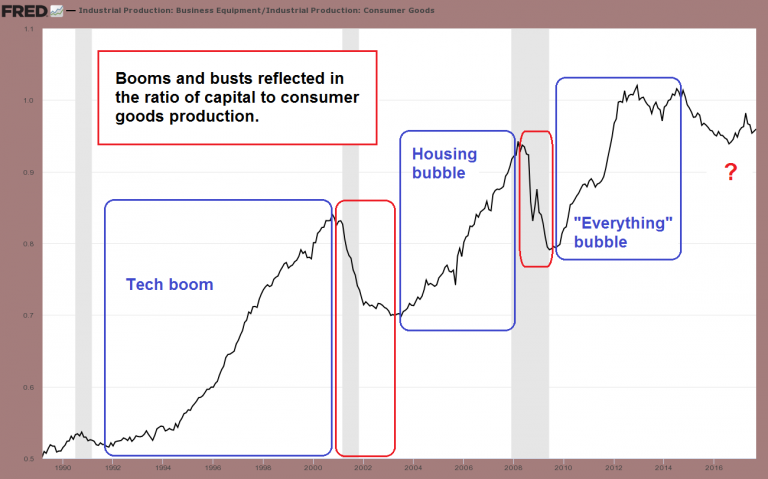 The effect of credit expansion on the production structure can be observed in the trend of the ratio between capital and consumer goods production. - Click to enlarge It is no coincidence that the ratio increases in boom periods and corrects during busts |
The Stagflation EraFrom the above readers can probably already deduce why we said in Part 1 that it is in principle easy to explain the phenomenon of “inflationary” recessions. Given the consumption of capital during the boom and the bottleneck that eventually develops in terms output and inventories of consumer goods, prices of consumer goods should actually be expected to rise by the time the bust arrives, ceteris paribus. Obviously, capital consumption makes the economy less productive, thus pressure on prices should begin to emanate from the goods side. Naturally, the ceteris are rarely paribus, and when it comes to prices, one has to be especially careful when trying to predict future developments. One reason for this is that prices are determined by four different factors which exert their influence concurrently: the demand for and supply of goods, and the demand for and supply of money (incidentally, this is also why attempting to measure and calculate a “general level of prices” actually makes no sense – there is no constant that can be used for such a measurement). |
US Money Supply, 1996 - 2016 Year-on-year growth of the broad true money supply TMS-2 and commercial and industrial loans has declined sharply over the past year, to levels that are likely to imperil many of the malinvestments undertaken during the boom - Click to enlarge |
| Moreover, people have a certain conception of the purchasing power of money in their mind, which derives from experience. As Mises explains in the regression theorem, our expectations with regard to today’s purchasing power of money are informed by yesterday’s prices, just as yesterday they were informed by the prices of the day before yesterday, and so forth.
People don’t throw these expectations overboard easily. Furthermore, the effect monetary inflation exerts on prices is highly uneven, to the extent that early on in the process, prices for some items may rise while prices for other items decline at the same time. A more general, broad-based rise in prices only tends to begin once people’s inflation expectations change for some reason. Obviously, if the money supply were relatively fixed, rising economic productivity would make most or all goods cheaper over time. A mild but persistent decline in consumer prices could in fact be observed in the period from the end of the US civil war until the establishment of the Fed. The strongest annual per capita real economic growth in US history was recorded in this time period. Not surprisingly, this happy state of affairs ended with the founding of the central bank and the decision that the US should henceforth meddle in global wars. If one looks at past episodes of rising consumer price inflation or inflation episodes that eventually deteriorated to such an extent that hyper-inflation conditions emerged, one can see that certain preconditions had to be present. For one thing, these episodes are always preceded by a lenghty period of excessive monetary inflation, which usually only affects consumer prices with a considerable time lag. Not only does it take time for newly created money to percolate through the economy, but numerous forces tend to counteract its effects on consumer prices to varying degrees. These range from strong productivity increases in manufacturing, rising demand for money (which as a rule emerges during busts), the stickiness of inflation expectations already mentioned above, faith in the monetary authority (particularly trust that it will abandon or reverse inflationary policies in a timely fashion), consumers being overwhelmed by having taken on too much debt or seeing their discretionary funds pressured by a rise in prices of essential services (health care, rents, education), and so on. And yet, it is clear that modern fiat money has lost a lot of purchasing power in the long term and that price inflation can flare up unexpectedly. |
US Consumer Price Index, 1920 - 2010(see more posts on U.S. Consumer Price Index, ) As this illustration shows, the loss in the dollar’s purchasing power adds up quite a bit over time – even in periods of relatively mild consumer price inflation. - Click to enlarge The idea that the economy has somehow benefited from this butchering of the currency is of course absurd. In fact, ever since the Fed has entered the scene, long term economic growth has steadily declined, despite countless one-way “improvements” in the statistical methods used in measuring inflation and output |
| The “stagflation” era of the 1970s is a concrete historical example that seems most relevant in this context, particularly with respect to Ben Hunt’s idea regarding the current “inflation narrative” (see Part 1). From about 1952 to 1969, consumer price inflation in the US was fairly tame (there were quite wild gyrations in CPI in the first 7 years after the war, as a result of the monetary policy conducted during the war and the transition from a war command economy to a relatively free civilian economy).
We looked at the money supply data of this time period, and found the following: in the 1950s, the US money supply rose by approximately 30%. By today’s standards that is negligible, but one has to keep in mind that it had already increased strongly in the two decades after the trough of 1932. From 1960 to 1970, the broad true money supply rose by roughly 64%. This was followed by an increase of ~67% between 1970 and 1980. In short, based on money supply growth alone, the 1970 were not really “worse” than the 1960s, and yet, CPI only began to misbehave in the 1970s. |
US Consumer Price Index, 1952 - 1982(see more posts on U.S. Consumer Price Index, )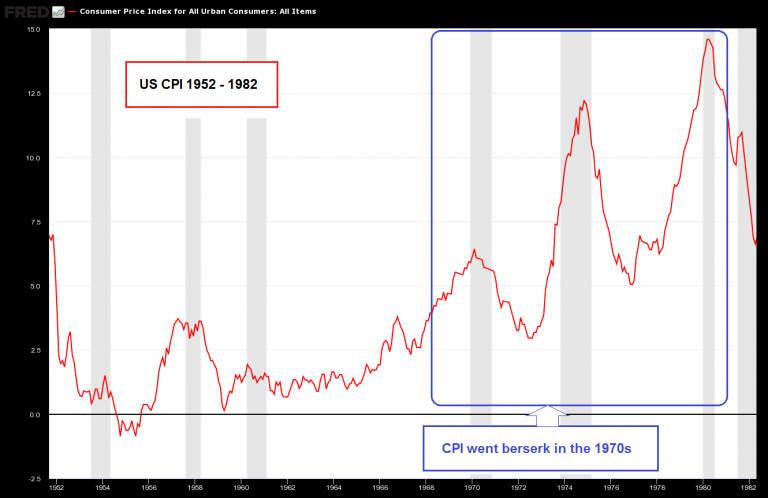 US CPI 1952 – 1982 - Click to enlarge |
| So the question is, what made the 1970s different? It is fair to say that a lot of “potential” inflation had accumulated in the system in the preceding decades. The 1970s provided the triggers needed to change the public’s inflation expectations, which caused a decline in the demand for cash balances.
Faith in the fiscal and monetary authorities was already wobbly in the wake of LBJ’s “war against poverty” boondoggle and the ongoing Vietnam conflict. Nixon then provided the coup de grace by defaulting on the Bretton Woods gold exchange standard agreement in 1971. This was followed by the Arab oil embargo and Nixon’s resignation; the peak in uncertainty arrived in mid to late 1979 and early 1980 with the Iranian revolution and the Soviet invasion of Afghanistan. What is the situation today? 1960 to 1980 were the two post-war decades prior to the 1980 peak in CPI with the strongest monetary inflation. The total increase in the broad true money supply in these two decades amounted to 173.1% (from USD 286.4 billion in 1960 to USD 782.1 billion in 1980). By contrast, over the past two decades (i.e, from October 1997 to October 2017), TMS-2 increased by a total of 426% (from USD 2.449 trillion to USD 12.884 trillion). In other words, we certainly have more than enough kindling for an outbreak of consumer price inflation. |
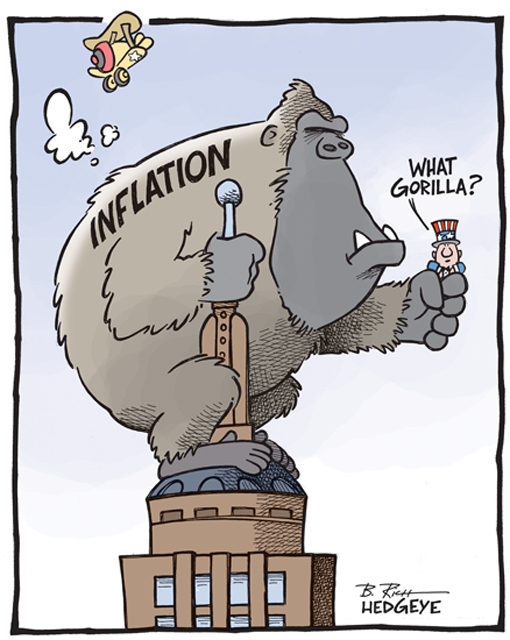 The “invisible” threat. - Click to enlarge |
One thing that mitigates against such an outcome is today’s much larger level of international trade. In the 1970s the US economy was fairly closed by comparison. The ratio between capital and consumer goods production has to be put into perspective by this as well, as a lot of consumer goods production has moved to countries such as China.
Clearly though, “trigger events” that could alter the public’s inflation expectations are conceivable. To name an example, the Trump administration may well introduce tariffs or other obstacles to global trade at some point. Also, if the Fed resumes monetary pumping after a sharp decline in asset prices, confidence that its inflationary policies were just a temporary affair may well evaporate.
Conclusion
The idea that consumer price inflation could actually rise despite the Fed beginning to take back QE cannot be dismissed out of hand. It not only remains an interesting, highly contrarian bet, it can also not be ruled out on theoretical grounds. Moreover, there is significant potential for contingent circumstances to change in a such a way that radically changes the public’s perceptions of the future purchasing power of the dollar.
Readers old enough to remember the late 1970s only need to think back to the “narrative” that prevailed at the time. Just as almost no-one can imagine a return of significant levels of consumer price inflation today, back then almost no-one would have believed it possible that CPI and treasury bond yields would decline almost relentlessly over the coming three and a half decades. And yet, that is precisely what happened.
Footnotes and references:
Full story here Are you the author?* see: Richard von Strigl, Capital and Production, L.v.Mises Institute, 2000; original edition: Kapital und Produktion, 1934, Julius Springer, Vienna. Strigl was one of the last representatives of the Austrian School actually working in Vienna. Capital and Production is an excellent supplement to Austrian capital theory, in particular with respect to Boehm-Bawerk’s idea of the “subsistence fund”, or what we call the pool of real funding. [Link to a free PDF version]
** it should be pointed out that credit expansion is not dependent on the existence of a central bank or on a fiat money system. Fractionally reserved banks have existed under the gold standard as well and business cycles occurred regularly. It is clear though that if a sound money standard and a free banking system are in place, credit expansion can never reach the excessive heights it has attained since the establishment of the central bank and the introduction of the full-fledged fiat money system.
*** see: Friedrich A. Hayek, Kapitalaufzehrung (“Capital Consumption”) in Weltwirtschaftliches Archiv 36, no. 2 (1932)
Tags: central-banks,Chart Update,newslettersent,U.S. Consumer Price Index,U.S. Industrial Production,U.S. Treasuries