Lance Roberts
My articles My offerMy siteAbout meMy videosMy books
Follow on:TwitterSeeking AlphaFacebookAmazon
The economy is booming.
Employment is at decade lows.
Unemployment claims are at the lowest levels in 40-years.
The stock market is at record highs and climbing.
Consumers are more confident than they have been in a decade.
Wages are finally showing signs of growth.
What’s not to love?I just have one question. If things are so good, then why is America’s saving rate posting such a sharp decline? The answer is not surprising. Despite the bullish economic optics, the reality for the majority of Americans is they simply have not yet recovered from the financial crisis. As the chart below shows, while savings spiked during the financial crisis, the rising cost of living for the bottom 80% has outpaced the median level of “disposable income” for that same group. As a consequence, the inability to “save” has continued. |
Median Disposable Income and Debt Ratio, 1967 - 2015 - Click to enlarge |
| I discussed previously the problem of rising debt. Beginning in 1990, the gap between the “standard of living” and real disposable incomes went negative with the resultant “gap” filled through the use of debt. However, since the financial crisis, this has no longer been the case. I modified the previous chart with the savings rate which tells the same story, as the cost of living began outpacing incomes the difference came from savings, and a continuous increase in debt. Again, despite the temporary uptick in the savings rate following the financial crisis, the real cost of living continues to erode the middle class. |
US Real DPI, Savings Rate and Cost of Living, 1959 - 2014(see more posts on U.S. Disposable Personal Income, U.S. Savings Rate, ) - Click to enlarge |
| You can see the erosion of the savings rate more clearly when you look at the rate of Personal Consumption Expenditure (PCE) growth as compared to debt growth. As spending and debt accelerated, the savings rate declined. More importantly, in 2000 the growth rate of debt sharply accelerated above PCE growth. This debt-fueled consumption, however, has not led to stronger rates of economic growth. |
Credit Fueled Consumption and Long-Term Savings Decline, 1960 - 2015 - Click to enlarge |
Debt is a negative thing for the borrower. It has been known to be such a thing even in biblical times as quoted in Proverbs 22:7:
Debt acts as a “cancer” on an individual’s wealth as it siphons potential savings from income as those funds are diverted to debt service. Rising levels of debt means rising levels of debt service which reduces actual disposable personal incomes that could be saved or reinvested back into the economy. The mirage of consumer wealth has been a function of surging debt levels. “Wealth” is not borrowed but “saved” and as shown in the chart below, this is a lesson that too few individuals have learned. The reality is that since “savings” are the cornerstone of economic growth longer-term, as savings provide for productive investment and lending, it should be of NO surprise that, as shown in the next chart, there is a very high correlation between the savings rate, GDP, and PCE. |
US PCE, Wages, Consumer Credit and GDP, 1959 - 2013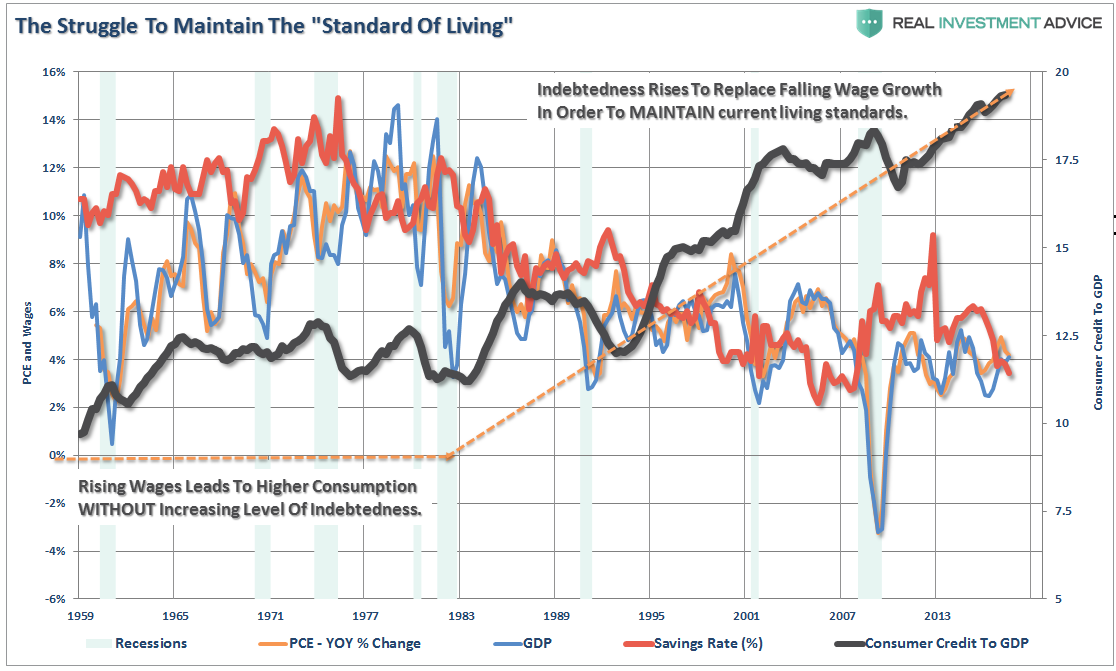 - Click to enlarge |
| While many continue to suggest that “debt is not a problem,” the evidence is pretty clear that rising debt levels have impeded economic growth, savings, and consumption since slanting sharply upwards beginning in 1980.
Correlation or causation? You decide. The chart above is extremely noisy so I have created a composite index below of inflation (CPI), GDP, Wages and the Savings Rate. I then compared that composite index to both interest rates and the S&P 500. |
S&P 500 and Interest Rates vs Composite, 1959 - 2015(see more posts on S&P 500, )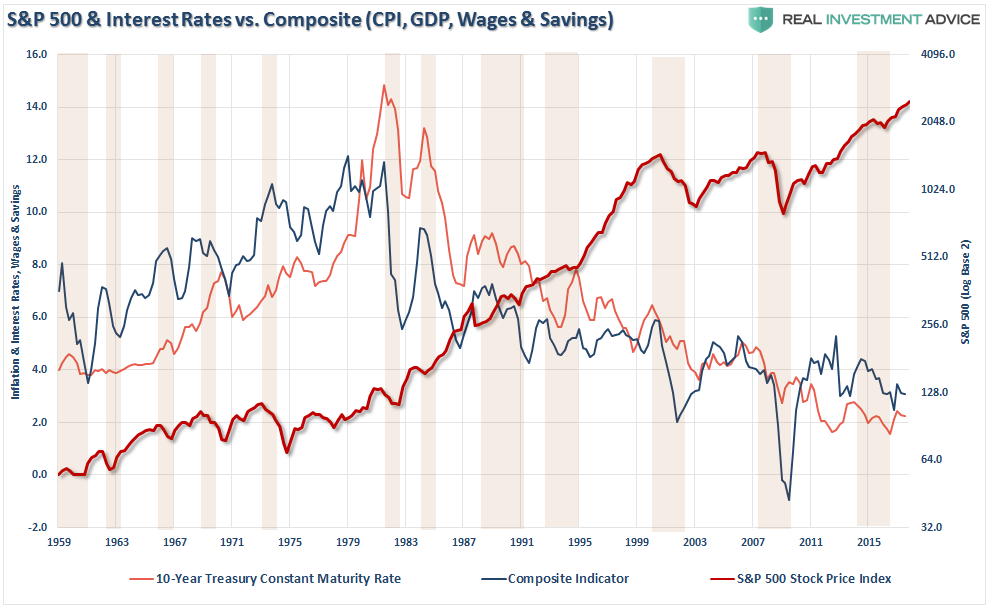 - Click to enlarge |
| What you find, unsurprisingly, is that declines in the composite index also correspond with declines in both rates and equity prices. The most recent decline resulted in the near 20% sell-off in late 2015 and early 2016. The recent uptick in equities and the index follow on the heels of both the massive European and Swiss National Bank’s buying sprees and the “Trump bounce.”
The fall in the savings rate, combined with the subsequent rise in debt, is suggesting there is more weakness within the economy that headline data would suggest. Currently, there are clear signs of stress emerging from credit. Commercial lending has taken a sharp dive as delinquencies have risen. These are both signs of a late stage economic expansion and a weakening environment. With savings rates weak, the real-world inflationary pressures of food, energy, medical and utilities have consumed more of discretionary incomes. This is why dependency on social support systems now comprise a record level of disposable incomes. |
Government Financial Assistance and Social Benefits, 1966 - 2016 - Click to enlarge |
It is hard to make the claim the economy is on the verge of acceleration with the underlying dynamics of savings and debt suggesting a more dire backdrop. With the average American still living well beyond their means, the reality is that economic growth will remain mired at lower levels as savings continue to be diverted from productive investment into debt service. Furthermore, with the Federal Reserve and the Administration actively engaged in creating an artificial housing recovery, and wealth effect from increasing asset prices, it is likely that another bubble is being created. This has never ended well. The concern is that without a reversion of debt to more sustainable levels the attainment of stronger, and more importantly, self-sustaining economic growth could be far more elusive than currently imagined. This isn’t just about the “baby boomers,” either. Millennials are haunted by the same problems, with 40%-ish unemployed, or underemployed, and living back home with parents. In turn, parents are now part of the “sandwich generation” that are caught between taking care of kids and elderly parents. The rise in medical costs and health care goes unabated consuming more of their incomes. As I stated previously:
But that is still an awful lot of hoping. |
 - Click to enlarge |
Tags: Business,CPI,Economic bubble,Economics,economy,Federal Reserve,Financial crises,Financial crisis of 2007–2008,Great Recession,household debt,Macroeconomics,newslettersent,Reality,recovery,S&P 500,S&P 500,Savings Rate,Stock market crashes,Swiss National Bank,U.S. Disposable Personal Income,U.S. Savings Rate,Unemployment,Unemployment Claims,unemployment insurance,US Federal Reserve