Keith Weiner
My articles My offerMy siteAbout meMy videosMy books
Follow on:LinkedINTwitterSeeking AlphaFacebookAmazonGoogle +
See the introduction and the video for the terms gold basis, co-basis, backwardation and contango.
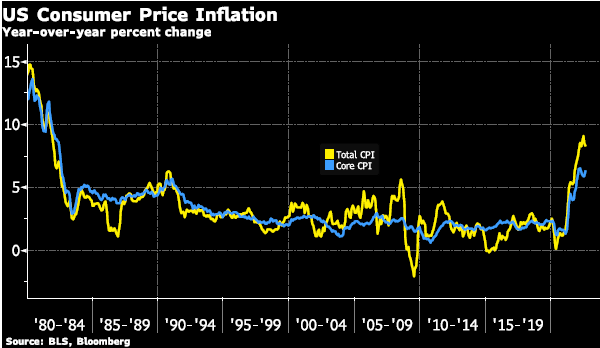
Where the Good Things GoMany gold bugs make an implicit assumption. Gold is good, therefore it will go up. This is tempting but wrong (ignoring that gold does not go anywhere, it’s the dollar that goes down). One error is in thinking that now you have discovered a truth, everyone else will see it quickly. And there is a subtler error. The error is to think good things must go up. Sometimes they do, but why? |
S&P 500 Large Cap Index(see more posts on S&P 500 Large Cap Index, )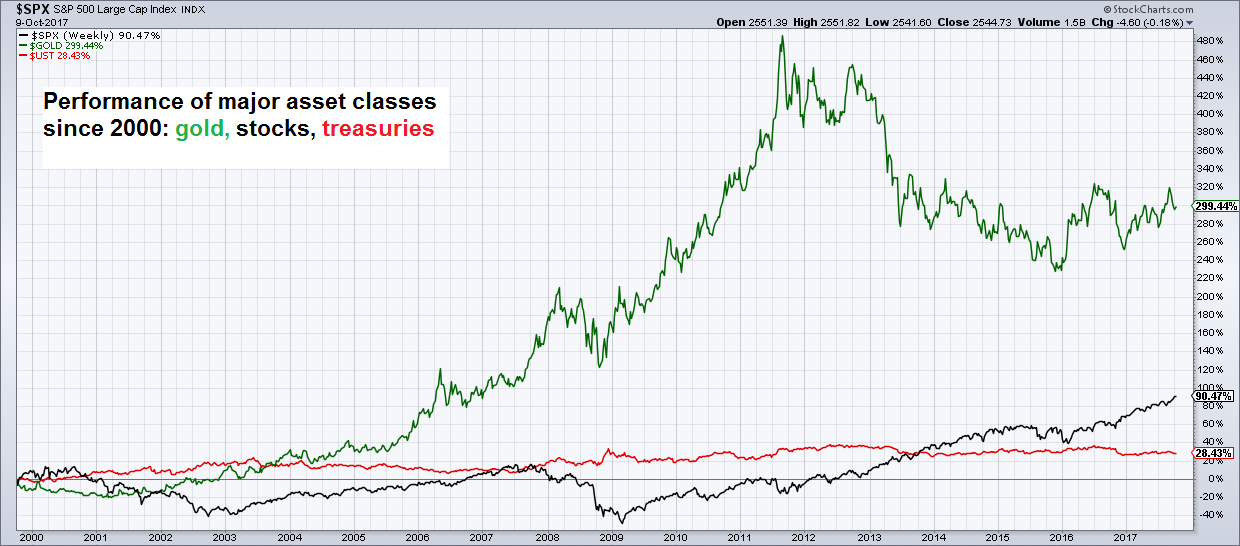 Since putting in a secular low at the turn of the millennium, gold is still the by far best performing major asset class, despite suffering a big correction from its 2011 peak. - Click to enlarge There is good reason to expect that the secular bull market isn’t over yet, regardless of the fact that the market is testing the patience of bulls. This is probably a case of “it will go wherever it needs to go, just not when you think it should”. |
| First, we think it’s a cop-out to say, “well it’s all subjective.” If it were all subjective, then there would be no way to say that gold is good, and no way to say that it “should” go up. It would be sufficient to say, “gold is $1,276.” Indeed that is all that one could say, if everything were subjective.
Why is gold trading at that price? Subjective preference, nothing more. Will it trade at $12,760? Maybe. If subjective preference changes. One might as well say “if God wills it.” But it is not all subjective. There is something objectively wrong with the dollar and all of its derivatives such as euro, pound, yuan, etc. They are all slowly failing. Gold is the alternative to holding the dollar. It is important to keep in mind that most people do not like to buy on speculation. This may be particularly difficult to understand if you are someone who bought gold as a bet on its price. Most people buy, not because they expect a discontinuous change, but simply because they have goals to achieve. For example, a consumer buys food because he needs to eat. A business buys copper because it manufactures wire, or circuit boards, or chemicals to pressure-treat wood. That’s what businesses do — buy inputs, combine them into a product, and sell it for a profit. Will copper go from $3.02 to $4.02? Maybe. But that is not why copper-using businesses buy it (at least not in the falling interest cycle — see part IV of Keith’s Theory of Interest and Prices). Suppose Acme Piping Inc. buys copper at $3.02. It adds $1.98 worth of labor, and turns the metal into pipes. It sells a pound of pipes for $6.00. It spends $5.00 ($3.02 + $1.98). We can say that this $1 of profit is an incentive to produce plumbing.
Debt TrapAnd there is another incentive. If Acme has a debt of $1,000,000, with a monthly payment of $15,000, then it must sell at least 15,000 pounds of pipes. If not, then its creditors will seize the business. It would like to sell at least 20,000, so it makes the payment, and has a profit of $5,000 left over. If you wonder why the “worthless paper dollar” can buy so many great products, it’s because all debtors are exchanging whatever they can produce and sell to get enough dollars to service their debts. When interest rates fall, several things change. First, the incentive to borrow increases. If Acme had decided not to borrow to buy a new pipe-making machine when the rate was 6%, the company may be more tempted at 3%. Total debt goes up as more businesses take this greater incentive. |
US Domestic Corporate Debt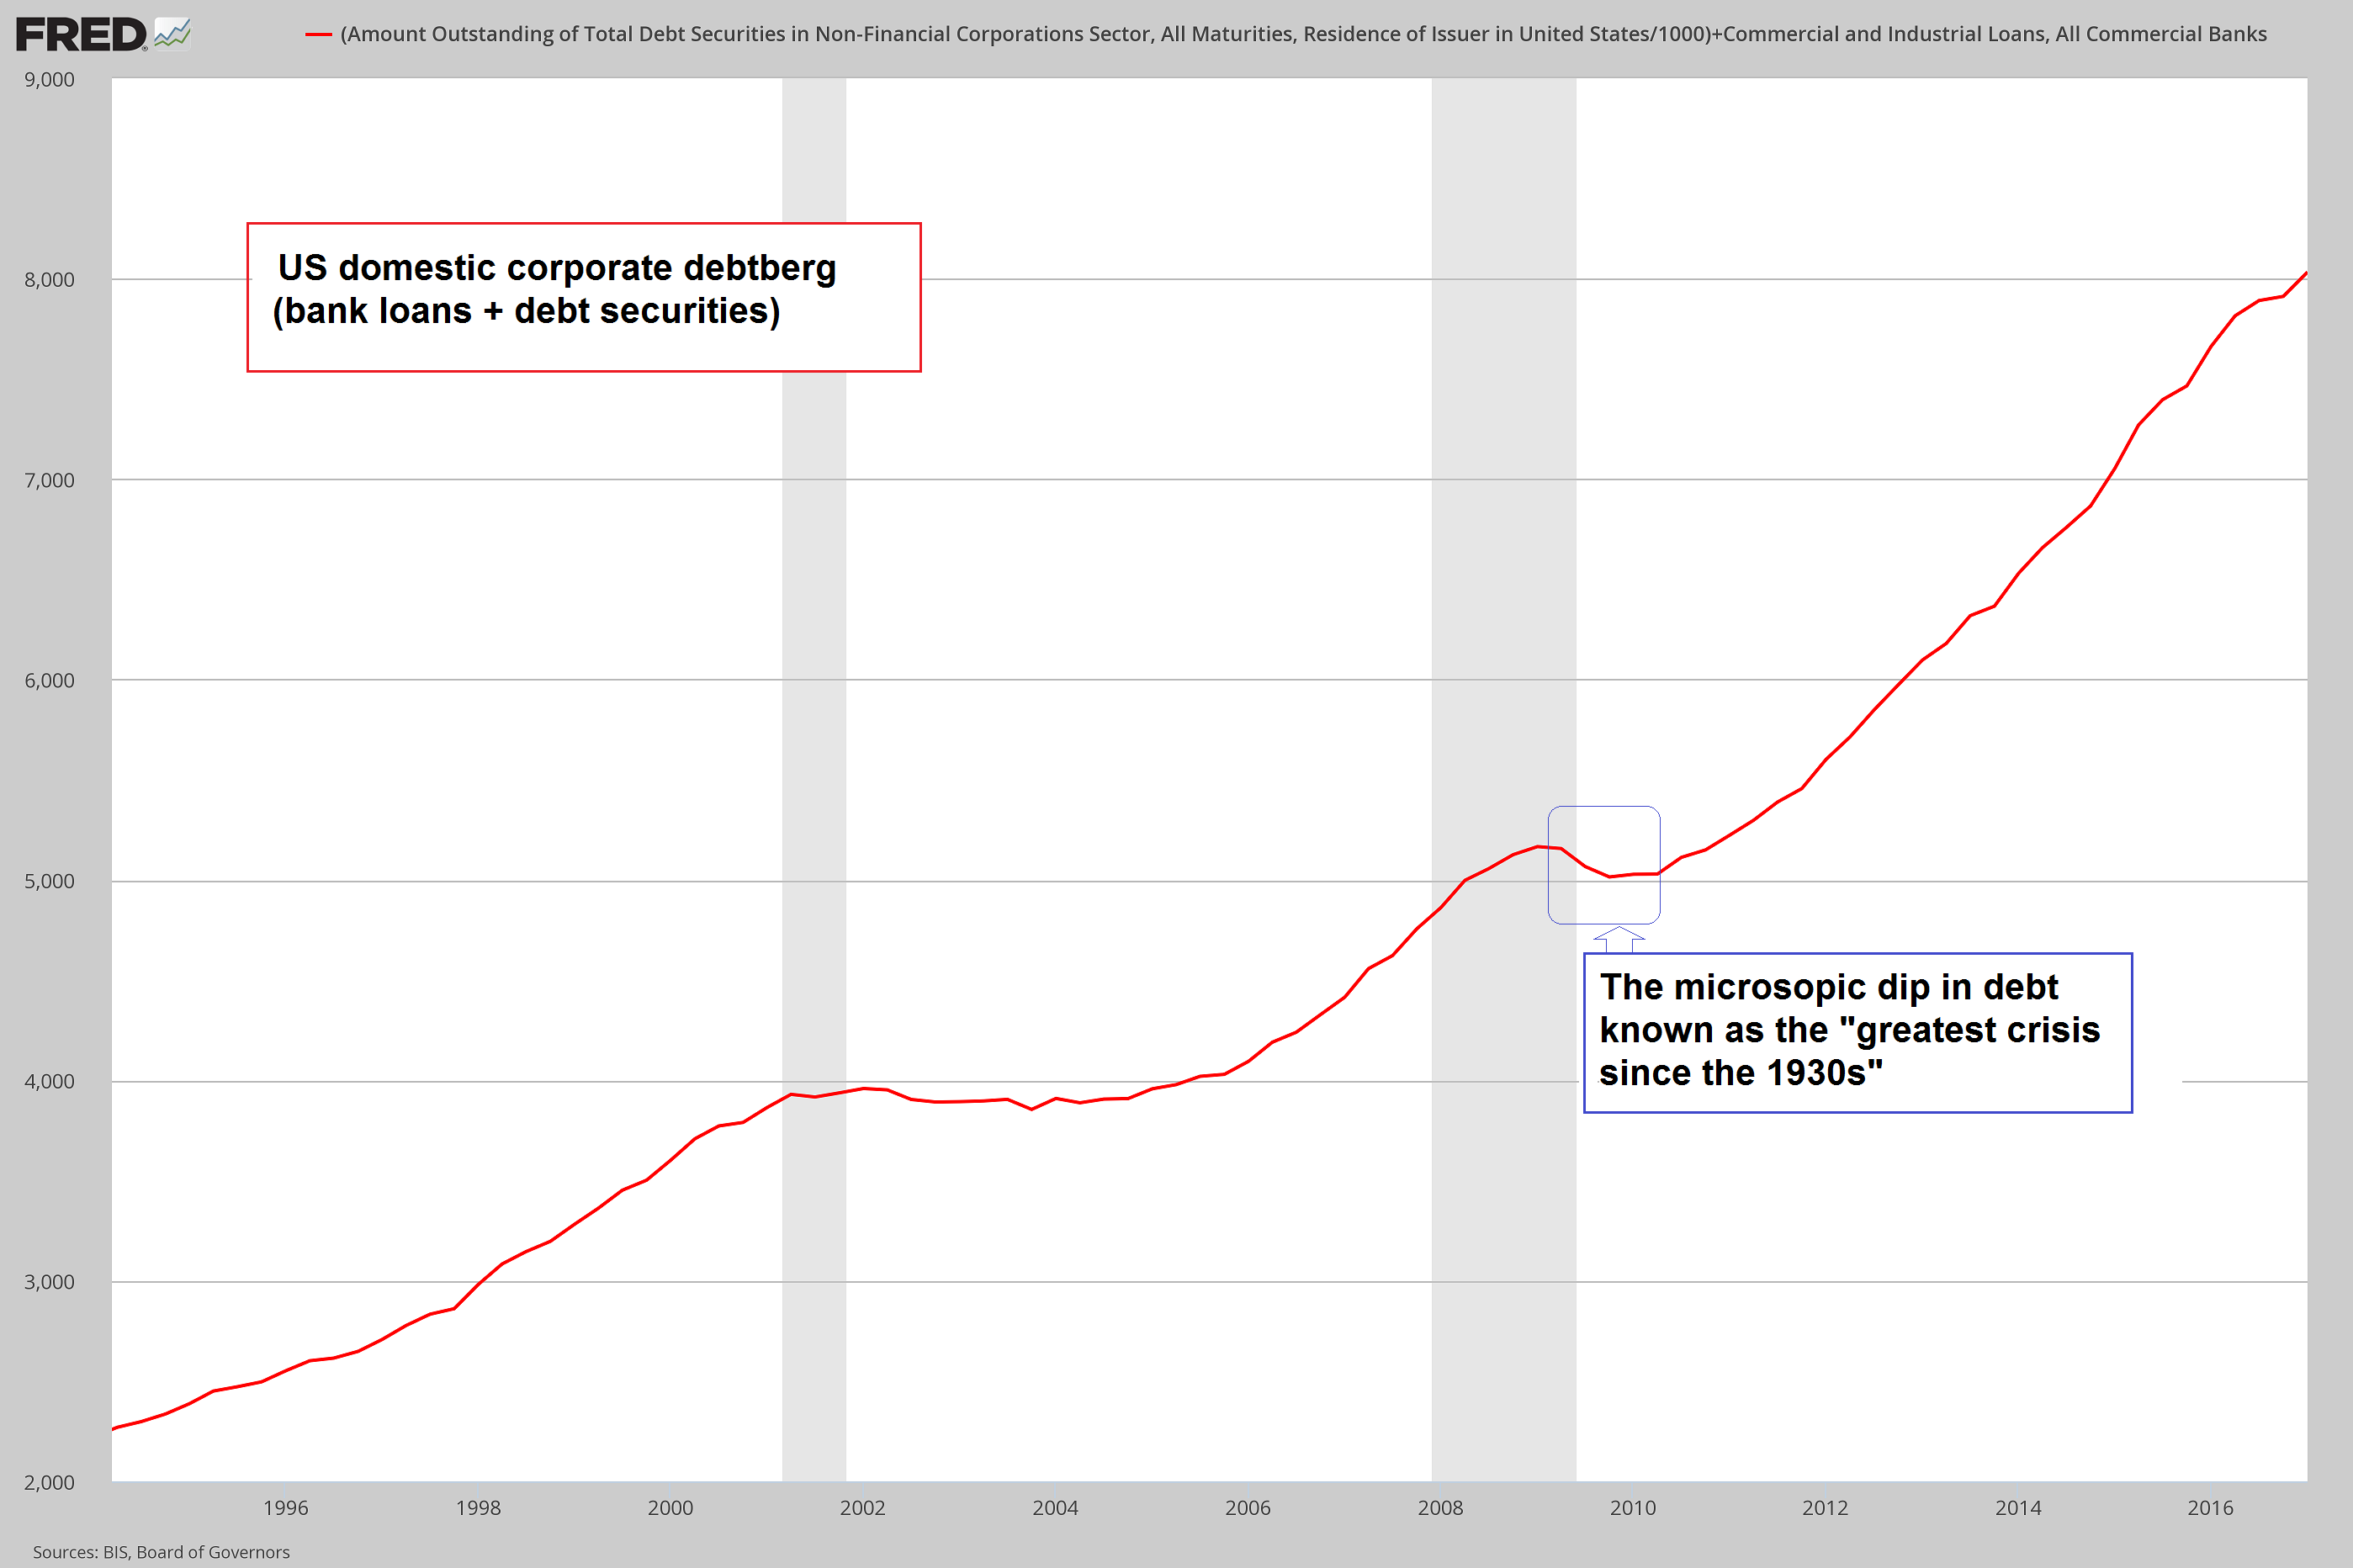 Domestic US corporate debt (bonds + bank loans). - Click to enlarge Deeply shocked by the turmoil of the 2008/9 crisis, corporate chieftains thought it best to pile on and increase their debt by another 60%. What can possibly go wrong? [PT] – click to enlarge. |
| The monthly payment per dollar of debt is lower (total debt may be a lot higher). However, it becomes harder to generate the profits to service the debt. When every pipe manufacturer borrows more to add more machines to make more pipes, the price of pipe tends to fall. Taxes and regulations might slow or prevent the drop in price, but not the drop in profit margins.
So let’s look at a chart of the price of the S&P stocks overlaid with non-financial corporate debt (not the same as S&P 500 debt, but we use it as a proxy for data we don’t have). We started the graph in January 2008, so you can see the big plunge from 1400 in May 2008 to 734 in February 2009. |
S&P 500 Index vs Corporate Debt(see more posts on S&P 500 Index, )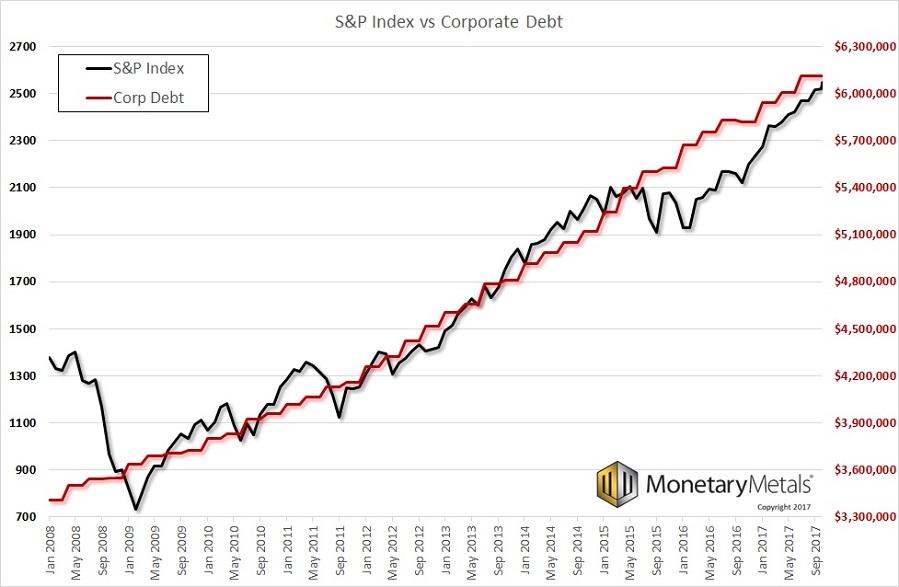 Note: This depicts only non-financial corporate debt securities outstanding – money borrowed from banks adds another $2.1 trillion to the figure (see chart above). - Click to enlarge For illustration purposes this will do just fine of course. |
| Acme Piping, Acme Banking, Acme Pharma, and 497 other Acmes are steadily adding to their debt. According to this data series, borrowing did not miss a beat, even in the worst of the financial crisis. This debt is quoted in millions, so total non-financial corporate debt nearly doubled from $3.4 trillion to over $6 trillion.
Aside from buying more machines, companies use some of this borrowing to buy back their shares. There is a reasonable argument for this, as debt and equity are alternative ways to finance the enterprise. And the lower the interest rate, the more attractive debt becomes. Many companies are also paying dividends. Management has a tougher case to argue that borrowing is used for other purposes and dividends are paid of out of cash flow. However, cash is fungible. If a company is adding debt at the same time, it raises the question if it is borrowing to pay the dividend. The fact is that cash comes in from borrowing, and goes out for dividends. Stocks have been rising relentlessly since 2009. We don’t know how much of the rise is due to borrowing for so called “shareholder friendly” actions. The graph certainly shows a strong correlation. We can say that these moves may seem “friendly”, but actually create a problem for long-term shareholders. Debt is rising. As the expression goes, “it’s not a problem until it’s a problem.” Until it’s a problem, speculators keep buying stocks to front-run relentless “shareholder friendly” actions by public companies. Most have been trained not to think about yield, but to think about capital gains. Preferably big capital gains. They don’t see the engine of capital destruction, as each buyer in turn, turns over his capital to the previous owner of the asset. The buyer would never consume his own wealth, or want to be the Prodigal Son. However, to the previous owner who is now selling, it comes as income. Which he happily spends. This is a process that must inevitably end, when it depletes all capital that people are willing to put into it. Speaking of yield, here is a graph showing the S&P index again, this time with earnings and dividend yield. |
S&P 500 Index vs Earnings and Dividend Yield(see more posts on S&P 500 Index, ) SPX – earnings and dividend yield - Click to enlarge |
| Earnings yield is the stated earnings of the companies in the index divided by price. Dividend yield is the dividend over price. Yield is an interesting view, because it lets us compare earnings or dividends to other assets, such as the treasury bond.
The problem with earnings is that it can be difficult to determine what went into them. Companies can actively “manage” earnings numbers. For example, deferring maintenance or reducing R&D will boost earnings. At least for now. Public companies use the accrual basis for their accounting. With accrual accounting, it’s quite possible to have negative cash flow while reporting positive earnings. Dividends are thought to be harder to dress up. This is because they are paid of out of cash flow, or so the theory used to hold. However, as noted above, they are increasing their borrowing. Both earnings yields and dividend yields are falling. In contrast to the 10-year Treasury bond at 2.4%, the earnings yield of S&P stocks is under 4% and the dividend yield is under 1.9%. This shows that people prefer stocks strongly over the steady yield of the bond. This is extraordinary, given that stocks carry a substantial risk of capital loss. Heck, our chart above shows a loss of about 50%. We think that stock buyers want that risk. They don’t see much downside, only upside. This common belief does not mesh with another common belief that interest rates will rise (which we don’t share). With rising rates bondholders will of course take capital losses. But holders of equities will take bigger losses. But until then – until it’s a problem – most people buy stocks. The prospect of buying gold as a way to opt out seems unattractive to them (perhaps they will be more excited by a gold fixed income investment).
Fundamental DevelopmentsThe price of gold dropped $10, but the price of silver increased 18 cents last week. Is this the end of the downtrend that began around 8 September? Last week, we said:
This week the action occurred on Friday, after the employment report by the Bureau of Labor Statistics. They said unemployment fell by 0.2%. They may as well have said “Buy silver because, inflation!” or maybe “buy silver, because growth!” In any case, people sold silver first, down to $16.30 shortly after 10am NY time. Then they bought silver, pushing it up to $16.85 an hour and a half later. We continued:
Is this another case of new energy fueling speculation while the market remains moribund? We will look at an updated picture of the fundamentals of supply and demand of both metals. But first, here are the charts of the prices of gold and silver, and the gold-silver ratio. |
Gold and Silver Prices(see more posts on Gold prices, silver prices, )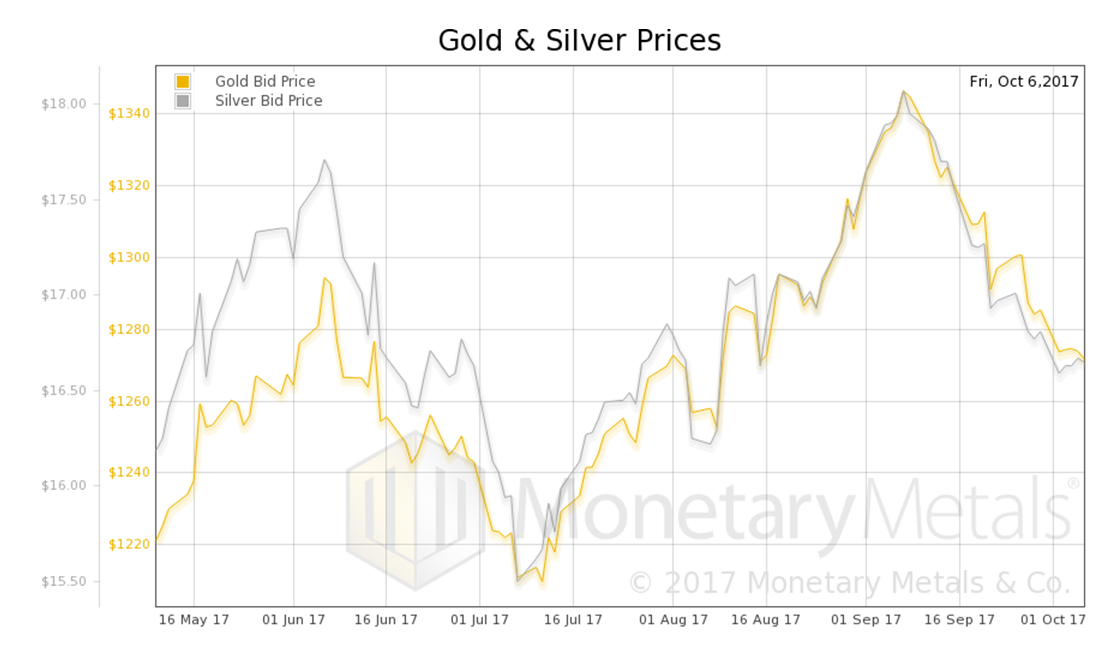 Gold and silver priced in USD - Click to enlarge |
| Next, this is a graph of the gold price measured in silver, otherwise known as the gold to silver ratio. The ratio fell.
|
Gold:Silver Ratio(see more posts on gold silver ratio, )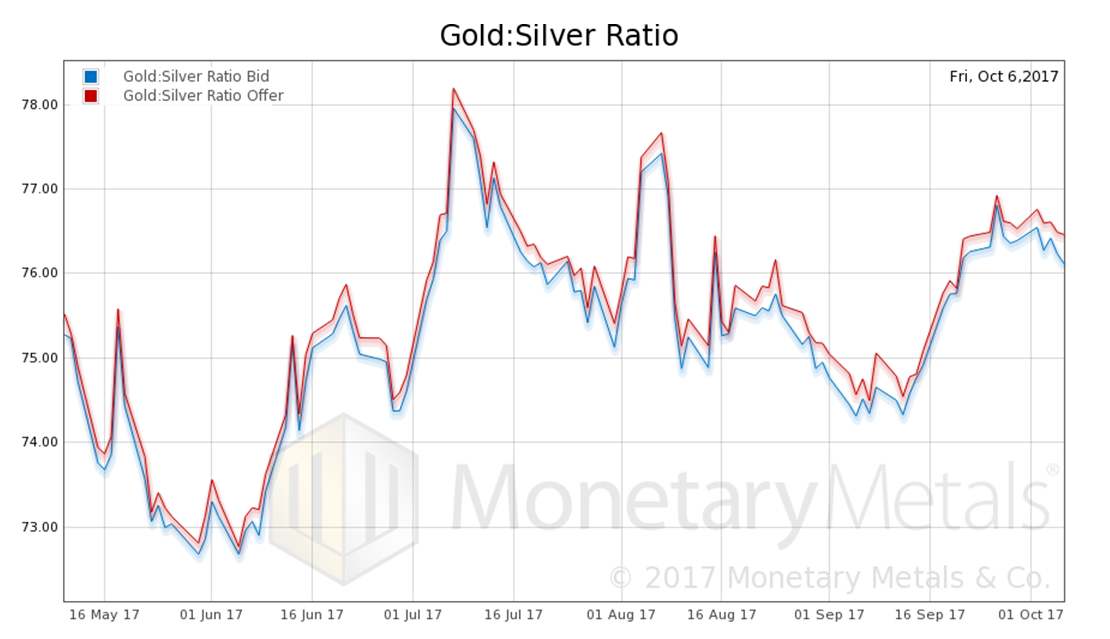 Gold-silver ratio, bid and offer - Click to enlarge |
Here is the gold graph. |
Gold Basis and Co-basis and the Dollar Price(see more posts on dollar price, gold basis, Gold co-basis, )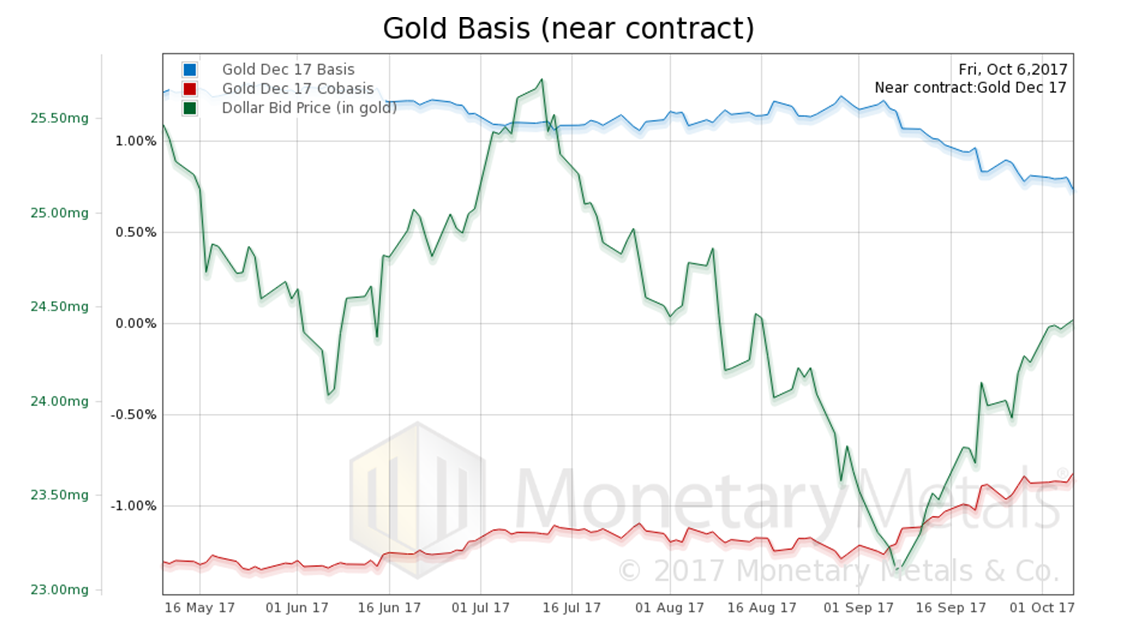 Gold basis and co-basis and the dollar priced in milligrams of gold - Click to enlarge |
| No surprise here. As the price of the dollar has risen (most people see the inverse, the price of gold measured in dollars, which has fallen) the scarcity of gold has risen too.
However, scarcity has not risen so much. On 7 Sep, the price of gold hit $1,347. The co-basis was -1.2%. On Friday, the price of gold was down $75. The co-basis was up to -0.82%. During that time, our calculated Monetary Metals gold fundamental price is down from $1,371 to $1,333. Now let’s look at silver. |
Silver Basis and Co-basis and the Dollar Price(see more posts on dollar price, silver basis, Silver co-basis, )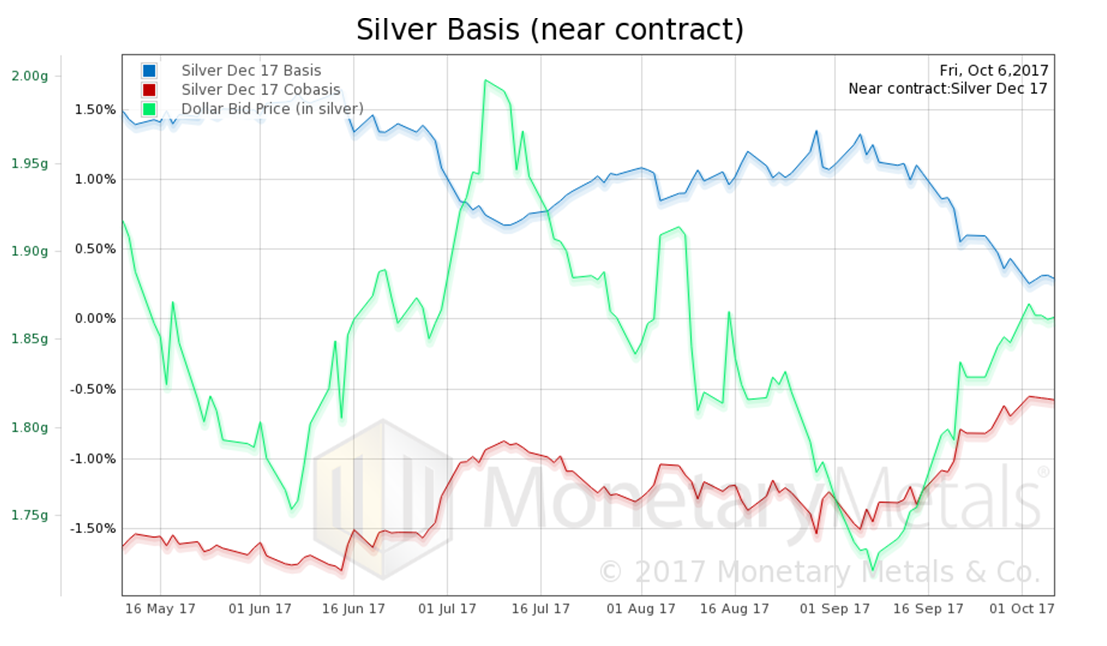 Silver basis and co-basis and the dollar priced in grams of silver - Click to enlarge |
It is the same picture in silver. The price has fallen from over $18. The co-basis has increased, but not that much. Keep in mind in silver, the near contract tends to move more towards backwardation sooner than gold. We are now within the zone for this.
Our calculated Monetary Metals silver fundamental price is down from $17.83 to $16.98.
Friday’s action was, to say the least, interesting. First the prices dropped sharply then rallied to a higher level. In Part II of this article, we have graphs of the Oct 6 Gold and Silver Intraday Basis and Co-basis.
© 2017 Monetary Metals
Full story here Are you the author?Tags: dollar price,gold basis,Gold co-basis,Gold prices,gold silver ratio,newslettersent,Precious Metals,S&P 500 Index,S&P 500 Large Cap Index,silver basis,Silver co-basis,silver prices,The Stock Market