Jeffrey P. Snider
My articles My offerMy siteAbout meMy videosMy books
Follow on:LinkedINTwitterSeeking Alpha
| Eleven days ago, we asked a question about Treasury bills and haircuts. Specifically, we wanted to know if the spike in the 4-week bill’s equivalent yield was enough to trigger haircut adjustments, and therefore disrupt the collateral chain downstream. |
US Treasury, Jan - Sep 2017(see more posts on U.S. Treasuries, )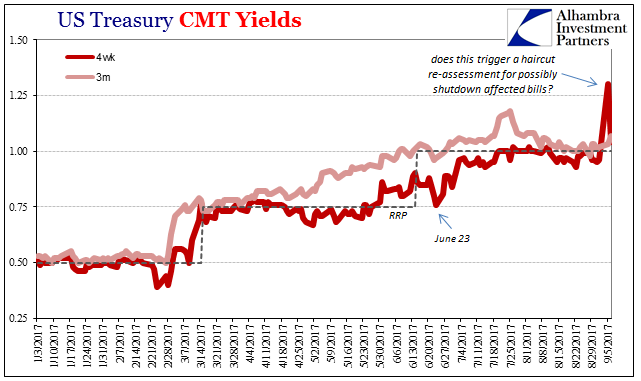 - Click to enlarge |
| Within two days of that move in bills, the GC market for UST 10s had gone insane.To be honest, it was a rhetorical exercise. |
US Treasury, Jan 2017 - Sep 2017(see more posts on U.S. Treasuries, )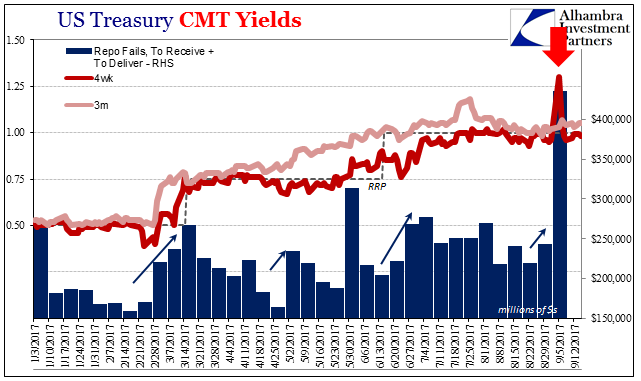 - Click to enlarge |
| It was perfectly clear there was a collateral problem that the system could not readily absorb whatever it was that might have caused the 4-week instrument to so deviate. Last Friday, FRBNY confirmed as much with its updated numbers on repo fails for that earlier week: |
US Repo Fails, Jan 2007 - Jun 2017(see more posts on repo fails, )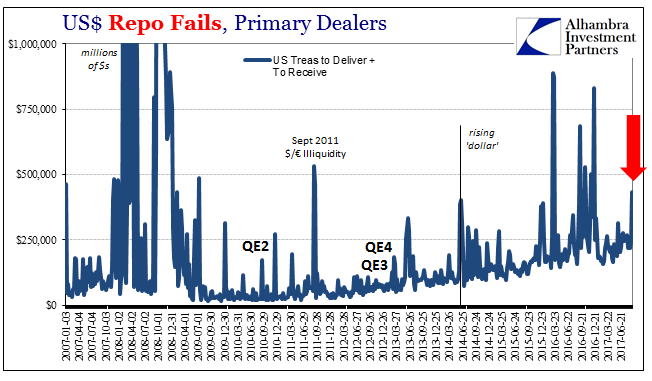 - Click to enlarge |
| The GC rate for the UST 10s falling as low as it did was, as I wrote elsewhere in another context, “another one of those ‘can’t happen’ kind of deals that often does in the context of monetary irregularities.” As an isolated instance, that week of repo and Treasury trading was peculiar and interesting, worthy of discussion and debate.
But it wasn’t isolated at all, a fact pretty well established by our own focus on bills long predating the second week in September. There is surely more here, and in review these specific irregularities match up well with others. I wrote earlier today (subscription required):
|
Reflation, Aug 2016 - Sep 2017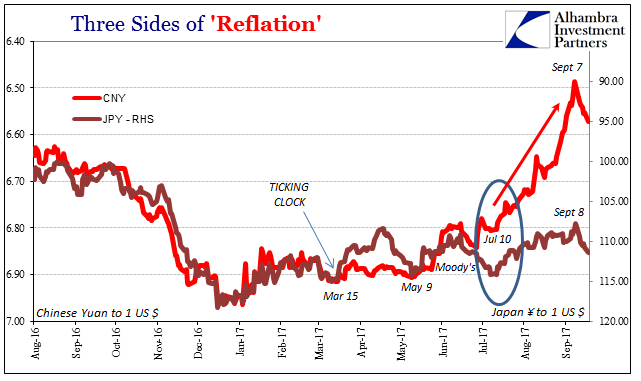 - Click to enlarge |
| Starting early to mid-July, there were but two conspicuous trends in markets. The first was RHINO, or falling bond yields and not just UST’s; the second was the rather amazing CNY appreciation. We were told the first was Korea or hurricanes, while the second was left unexplored because let’s face it even the media has learned to largely avoid stories about China and CNY.
A rising yuan is in many ways the contrary of a rising “dollar”; the latter being an acute shortage of them. And if they are opposites, the natural question to ask is where a surplus of “dollars” might be coming from. In this case, there is no way to answer that question directly. That doesn’t mean we can’t or won’t speculate. Our entire job is to do just that especially in the eurodollar space that is altogether opaque. Without (reasonable) conjecture we are nowhere. In truth, we have seen something like this before, just not in relation (that we know) to China. In late 2014, the Russians were very open about aggressively bidding for “dollars” using their central bank on behalf of local Russian banks increasingly shut out of eurodollar markets.
It’s as much a search for how things work in addition to why they turn out the way they do. |
US Treasury, Jan 2017 - Sep 2017(see more posts on U.S. Treasuries, )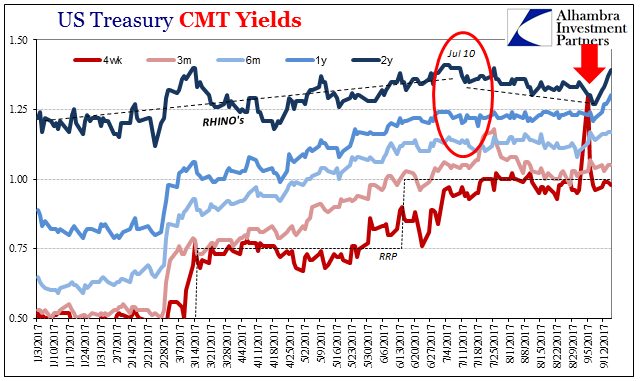 - Click to enlarge |
|
US Repo, Jan 2012 - Jul 2017(see more posts on repo, ) - Click to enlarge |
| To transport these contentions to the CNY context and recent, established collateral problems, if the PBOC is backing CNY with “dollars” on its way up, there are several options for the central bank to obtain them. It’s possible that is the private market growing comfortable with China again, but does anyone really believe that is happening here given what’s really going on over there? To put it in very simple terms, the PBOC could be crowding out the rest of the markets who struggle forward in very limited capacity. |
US Repo, Jan 2012 - Jul 2017(see more posts on repo, ) - Click to enlarge |
| Published DTCC repo volume for UST collateral was on October 1, 2013, $200 billion. On September 7, the day CNY stopped rising and GC 10s rates made no sense, DTCC reported volume of just $10 billion. That massive shift isn’t exactly what it seems, however, as the apparent 95% reduction represents the repo market moving some unknown level of capacity from exchange to further off-exchange (the majority of repo has always taken place off-exchange). As it does so, what’s really going on in repo becomes even more of a guess and not just for those looking from the outside. It’s indicating some level of lost capacity.
For repo participants, this could have some serious repercussions about flexibility and fluidity – especially of collateral. That’s the point of an exchange; if you have problems with one counterparty, you might find a replacement with relative ease. Or if you have an issue like T-bill haircuts off-exhange you can go to DTCC to find a workaround. It’s much harder even from the inside to assess any problems or disparities when everything is hidden. |
PBOC Balance Sheet, Jul 2011 - 2017(see more posts on pboc balance sheet, )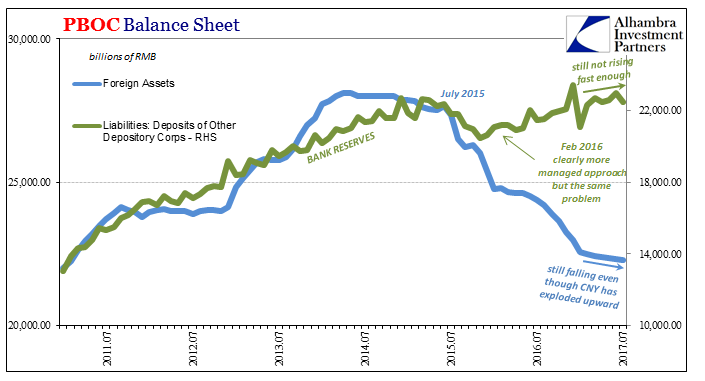 - Click to enlarge |
| Over the past few months as CNY has appreciated, on the PBOC’s balance sheet the central bank still reports falling levels of forex assets. So I ask again where are the Chinese coming up with their “dollars” to support the currency’s rise? They aren’t “selling UST’s” or the balance would be falling far more.
Might it be borrowing not just those “dollars” but also the collateral to obtain them, too? After all, unsecured lending to any counterparty is practically dead (which is why LIBOR is being scrapped as a derivative benchmark; more on that later). If you want marginal “dollars” you better have marginal collateral or else you won’t find them. |
US Repo Fails, Jan 2007 - Jun 2017(see more posts on repo fails, )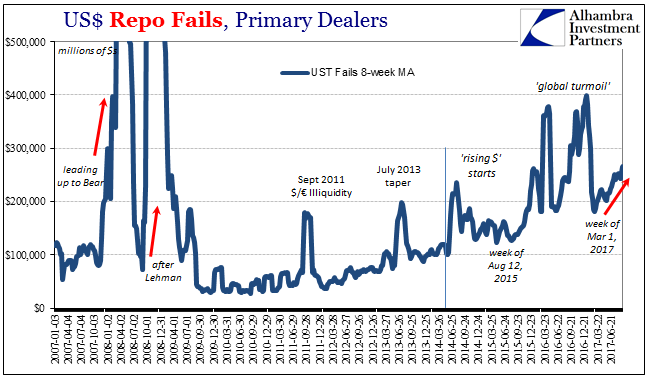 - Click to enlarge |
| There are, obviously, a lot of unfilled gaps in this picture. There is enough roughly filled in, however, to suspect quite a lot. It started with repo, and that part is confirmed. The real question is what this all means, up to and including whether it marks like fails in June 2014 the start of whatever the next phase of eurodollar decay might be. We obviously won’t know anything like that for some time (and we have to be very careful about bias, meaning that since I suspect it, it’s easy to believe and see what I think is already there), but the biggest clue will be in escalating warnings like this.
That’s really what the summer of 2014 was; from the first eruption in repo fails to oil to October 15, 2014 (collateral and Russia) to then junk bonds, rubles, and francs. By the time the Swiss National Bank broke the peg to the euro because of the “dollar” there was no longer any doubt. By that point, only an economist would believe the “rising dollar” was a good thing. |
US Personal Income, Jan 2010 - Jul 2017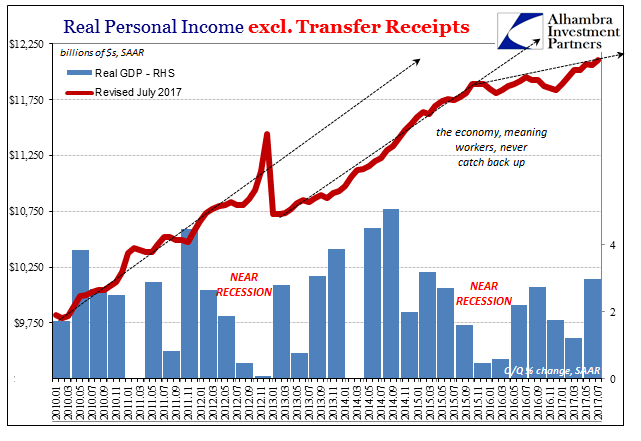 - Click to enlarge |
| From my view, we have witnessed since “Reflation” #3 small escalations already and more backsliding indications (swap spreads, for one). Nothing is as yet close to an October 15 UST buying panic, but given what transpired in early September would we be surprised if something like it were to develop over the next few months? Of course not, just as we aren’t surprised the global economy remains anchored to “something”, unable to ever ignite and carry out growth and recovery. |
Swap Spreads, Jul 2016 - Sep 2017(see more posts on swap spreads, ) - Click to enlarge |
Tags: $CNY,Bonds,China,collateral,currencies,economy,EuroDollar,eurodollar system,Federal Reserve/Monetary Policy,gc repo rate,Interest rates,Markets,money,newslettersent,pboc balance sheet,Reflation,repo,repo fails,rhino,RMB,Russia,swap spreads,T-Bills,U.S. Personal Income,U.S. Treasuries,yuan