Joseph Y. Calhoun
My articles My siteAbout meMy videosMy books
Follow on:LinkedINTwitterSeeking AlphaAmazon
| There is no change to the risk budget this month. For the moderate risk investor, the allocation between risk assets and bonds is unchanged at 50/50. There are no changes to the portfolios this month.
The post Fed meeting market reaction was a bit surprising in its intensity. The actions of the Fed were, to my mind anyway, pretty much as expected but apparently the algorithms that move markets today were singing from a different hymnal. The 10 year Treasury note moved nearly 5 basis points from bottom to top which would be nothing if rates were 5 or 6% but is a pretty big move when the yield starts the day at 2.24%. The dollar index rose over 1% after the announcement while the Euro, which traded as high as 120.34 early in the day, put on a 118 handle before the day ended. Meanwhile, gold has shed over $20 from this week’s high. What is most interesting about all that market sturm and drang is that it didn’t change any trends, at least not yet. The 10 year Treasury yield is still down on the year and well below the 2.6% level seen in early March. Indeed, rates haven’t even risen back to their highs of…July. Gold is still up from $1151.70 to start the year, a neat, non stock-correlated 12.5% return YTD. The dollar index, despite widespread expectations for more gains this year, is still down nearly 10% since the beginning of the year and in no danger – yet – of breaking its downtrend. The Euro, defying calls for parity with the dollar, is still up over 13% this year. And like the dollar index of which it is a large part, is in no danger of breaking its current trend. Perspective is a powerful thing and too often I think we develop a case of myopia when it comes to our portfolios. The post-Fed market moves knocked our portfolios down on the day (about 25 basis points for a moderate account) because we have some duration in our portfolios, we own gold and are generally positioned for a weak dollar. And to be truthful, it was more than a little upsetting because I saw nothing in the Fed’s statement that was surprising. It is at such times and in such conditions that portfolio mistakes are made so my response was to walk away. I was writing this update at the time the news was released and after watching the market for about a half hour, I closed my computer and worked on something else. A day later, my mood was better and a review of our positions shows that not all that much has changed. The trends that were in place before the Fed statement are still in place. They aren’t at exactly the same levels or rates of change but they are still intact. The dollar is still in a downtrend. Bond yields are still declining although inflation expectations have risen somewhat in recent days. Gold is still in an uptrend. Foreign stocks are still outperforming US stocks with emerging markets the biggest winners. Europe is still trending higher along with the Euro. Japan is still improving. We make changes to our portfolios based on a disciplined process, not emotion. When I have a day like Wednesday, when it feels like my 30 years or so of trading experience means nothing, I go back to the process. What would trigger a change in the portfolio? Have any of our main market indicators moved sufficiently to warrant a change in our strategic allocation? Has momentum shifted in some way that a tactical change within an asset class is warranted? As I said just above, the reality is that yesterday didn’t change much. |
Moderate Allocation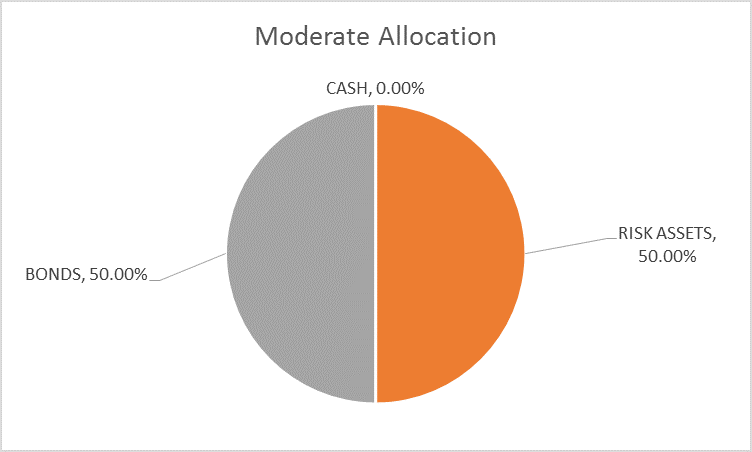 - Click to enlarge |
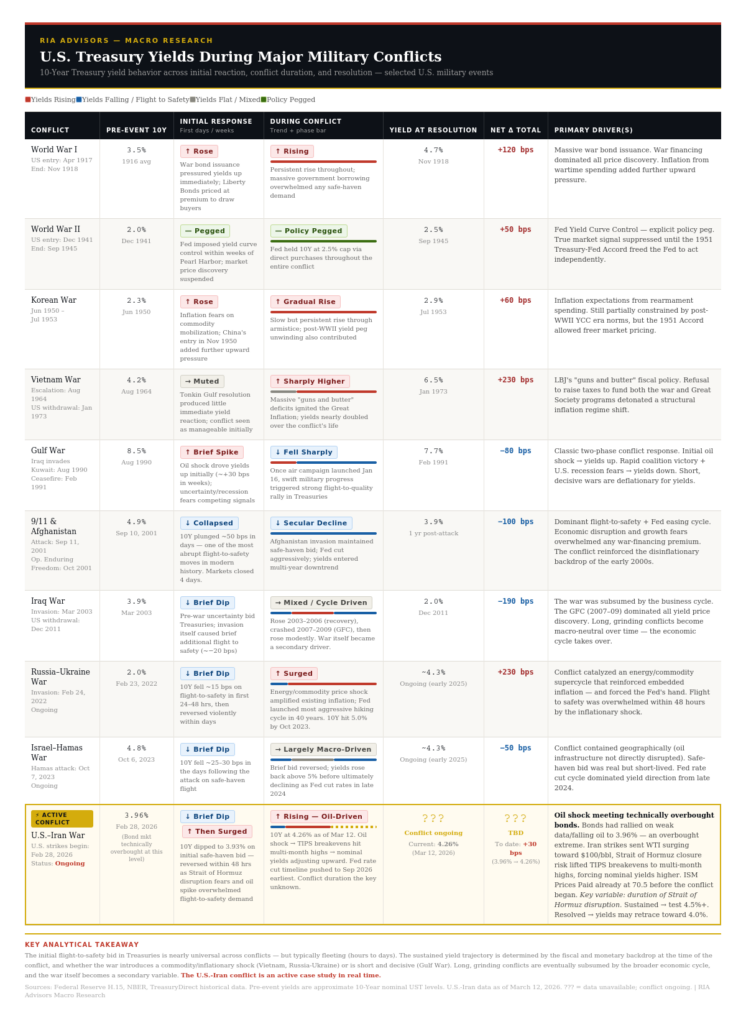
Yield CurveThe yield curve continued to flatten over the last month but only by another 4 basis points. At 83 basis points for the 10/2 spread we are near the flattest of the cycle (76 basis points, August 2016) but it is still not completely flat and of course not inverted. Short rates continue to rise, long rates continue to fall but we aren’t seeing anything in the yield curve that says recession is imminent. More recently, the 10 year yield did rise from the recent low of about 2.03% to the current 2.27%, a consequence mostly of a slight rise in inflation expectations. But it is the yield curve that provides the best information about future growth and that continues to point to slower not faster. |
US 10 Year Treasury Constant Maturity, 2000 - 2017(see more posts on U.S. Treasuries, ) - Click to enlarge |
Credit SpreadsCredit spreads are right back near their lows for the cycle, down 33 basis points since my last update. At 3.60% the spread is still above the lows for this cycle (3.35% 6/14) and the last two cycles (2.41% 6/07, 2.59% 9/97). The point being that, believe it or not, there is scope for a further compression of spreads before we hit peak exuberance. That doesn’t mean it will happen but I think it is important to realize that things can and have gotten sillier in the past. And the bottom of the cycle doesn’t necessarily mark the top for stocks either. If you sold out your stocks at the spread low in ’97 you missed a lot of upside before that bubble finally popped. I am not suggesting that will happen again but if you don’t know history…. Still, as I said last month, there isn’t much upside to holding credit at this point in the business cycle. Yes, spreads could go lower, but the risk/reward seems quite asymmetric at this point – a lot of risk to pick up very little reward. |
BofA Merrill Lynch US High Yield, 1998 - 2016 - Click to enlarge |
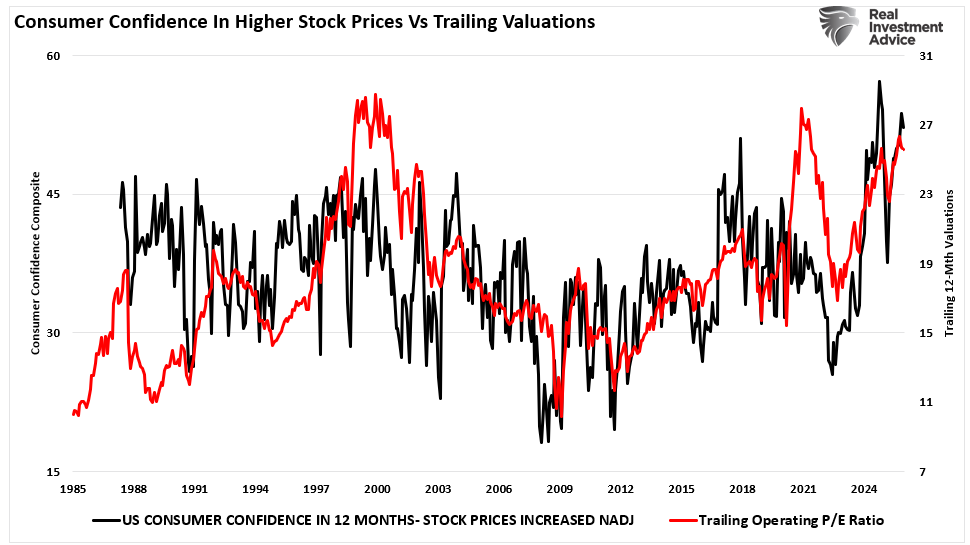
ValuationsUS stocks trailing P/E is 23, the Shiller P/E just hit 30 and market cap/GDP just hit an all time high. If you want to argue that US stocks are cheap based on forward earnings estimates that’s tough too at 18 times. And good luck at the turning point because Wall St. analysts are perpetually trying to catch up to reality. The cheapest stock markets continue to be found outside the US with emerging markets the cheapest. Europe is cheaper than the US but not as much as it once was. And European valuations are not uniform by any stretch. Emerging Europe is quite cheap (CAPE of 8, P/B of 1 and P/S of 0.8) while developed Europe is about twice the price (but still cheaper than the US). MomentumPerhaps the most important indicator we watch is the dollar and momentum has been down all year. The Fed’s announcement has so far produced only a one day pop that was overdue anyway. I’ve argued for a while now that the most likely short term outcome for the dollar is to consolidate near these levels before resuming its fall. Currency trends are not usually short term affairs and I suspect this one is just getting started; we haven’t even finished the first year of Trump’s term. And yes, as long as we have a President – and a Treasury Secretary -who thinks a cheap dollar is appropriate I think that’s exactly what we’ll get. For now, the dollar’s trend is pretty obvious but sentiment has lately turned quite negative, a near perfect inverse of sentiment at the beginning of the year when everyone thought it had no where to go but up. The crowd can be right for long periods though and so far a lack of bulls has not presented a problem. A pause here though – and short term momentum is waning – might cool things off enough for the downtrend to resume in earnest. I wouldn’t be surprised to see some kind of rally here just to shake out some of the weak bears. |
US Dollar Index, Dec 2016 - Sep 2017(see more posts on U.S. Dollar Index, )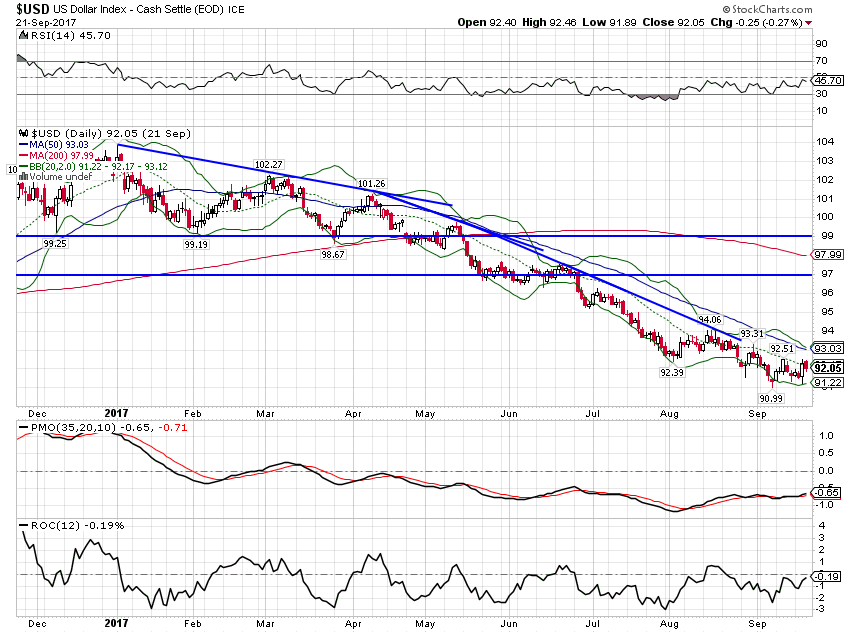 - Click to enlarge |
| The dollar index has broken weekly support. Next support is down in the 80s. |
US Dollar Index, Oct 2015 - Sep 2017(see more posts on U.S. Dollar Index, ) - Click to enlarge |
| Another way to look at the dollar is via the gold market. Gold has been in an uptrend all year (the flipside of the dollar’s decline). It had recently broken out above $1300 but short term momentum has waned as the metal pulled back, partially on the Fed action. Long term momentum, however, remains positive. |
Gold - Continuous Contact, 2005 - 2017(see more posts on Gold, )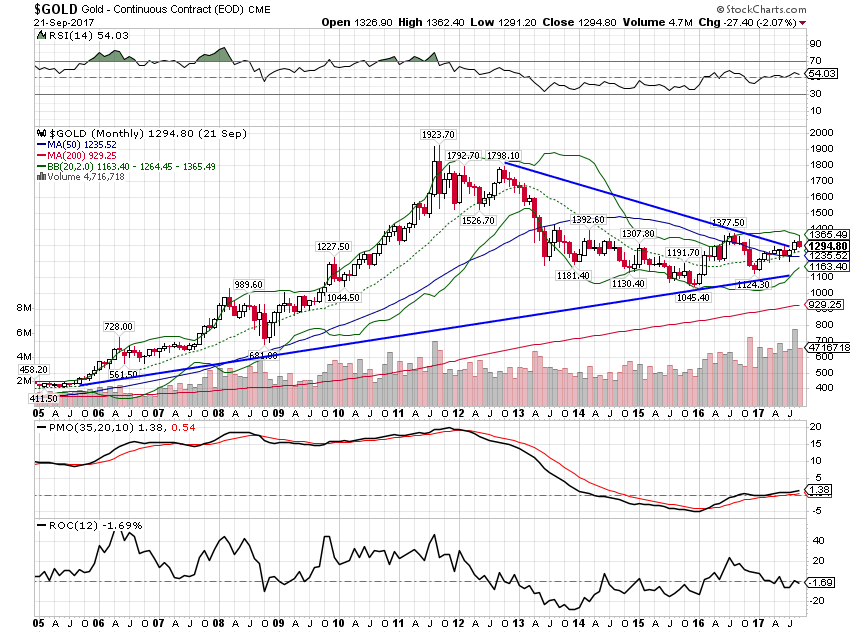 - Click to enlarge |
| Gold tends to lead real yields as represented by the 5 year TIPS yield. Recently a slight divergence has opened up between the two which I expect to be resolved through lower real yields. |
US 5 Year Treasury and Gold Fixing Price, 2010 - 2017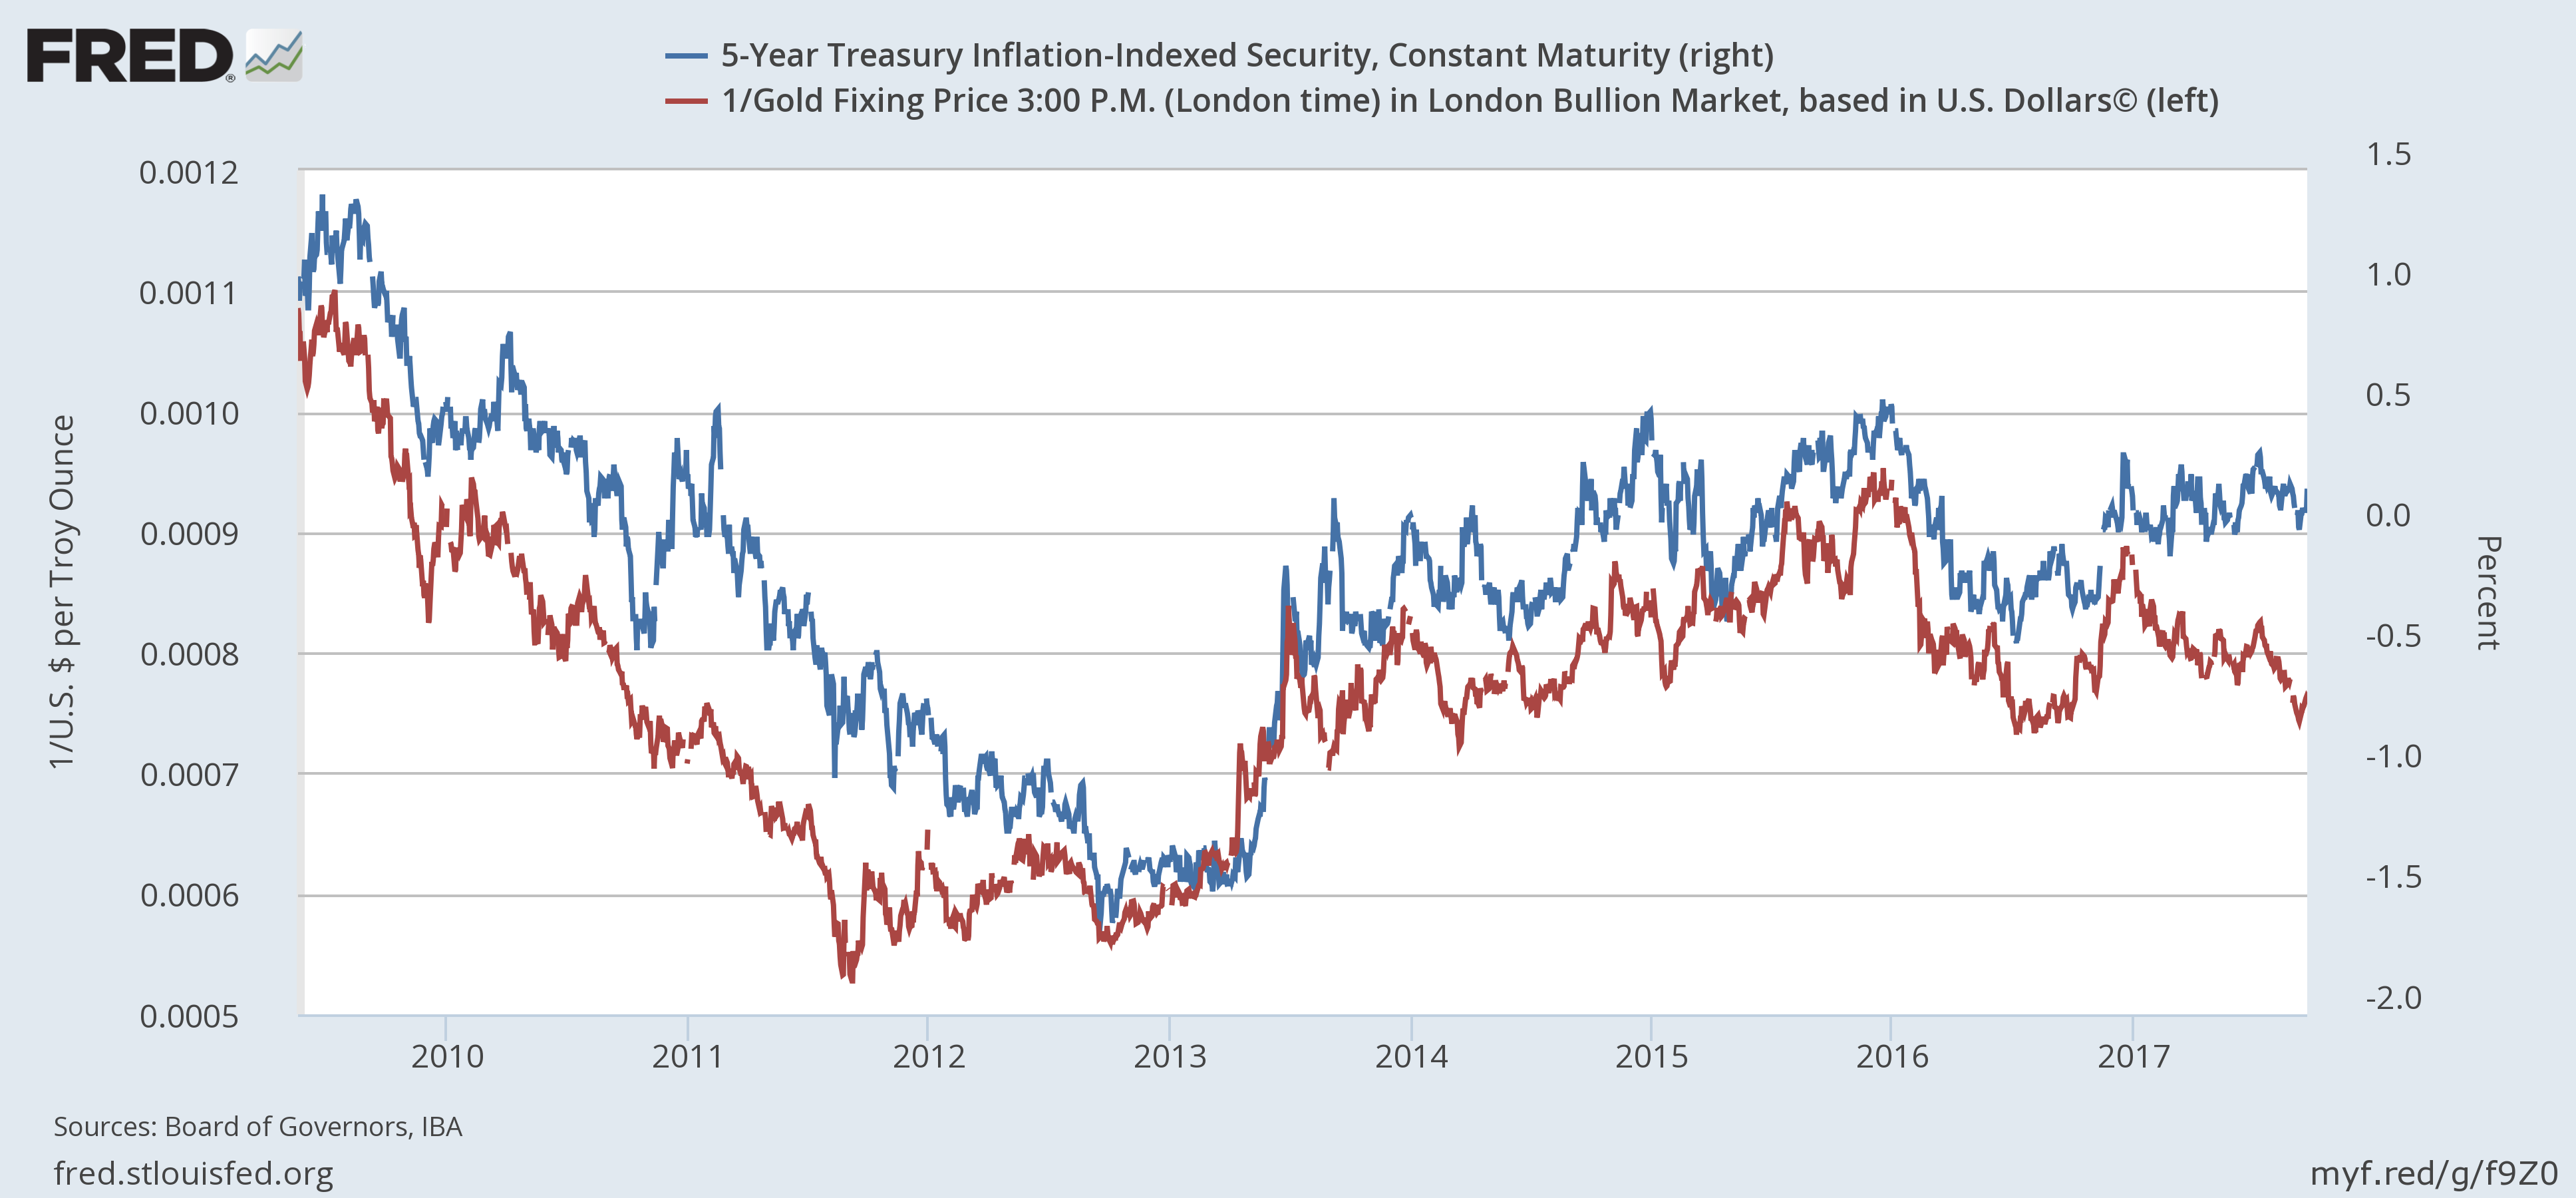 This chart shows the inverse of gold versus the 5 year TIPS yield. Gold is rising when the red line is falling. - Click to enlarge
|
| EAFE continues to outperform the S&P 500 YTD and over the past year but the trend has been stalled since May. |
EFA:SPY Daily, March - Sep 2017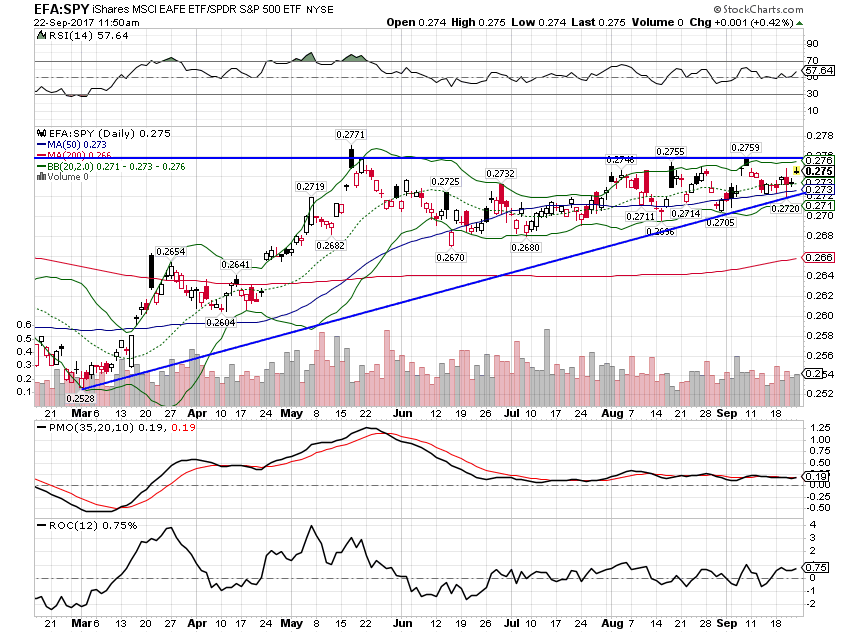 - Click to enlarge |
| Assuming the dollar trend is young – and as I said above these trends tend to be persistent – then this one is as well. |
EFA-SPY Monthly, 2005 - 2017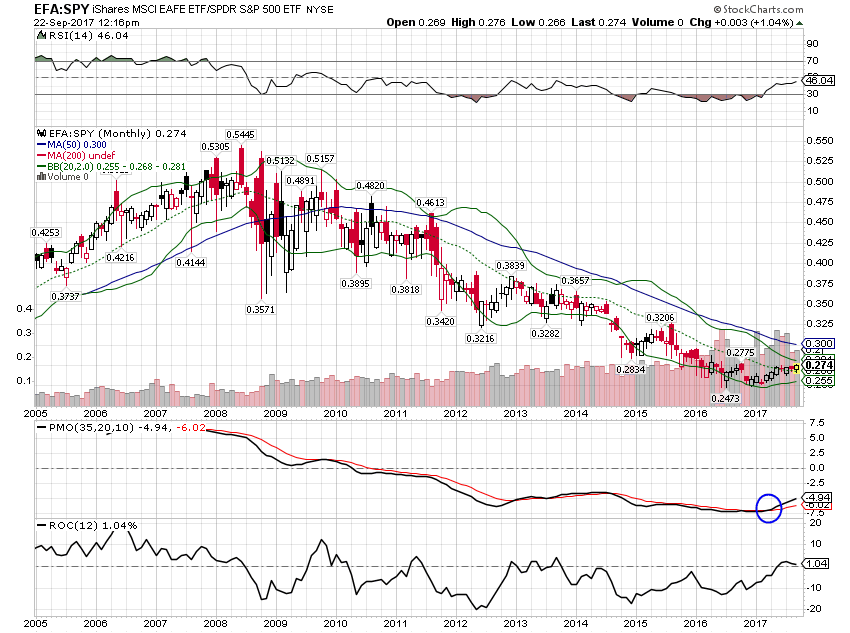 - Click to enlarge |
| The monthly movers are once again dominated by investments that benefit from a weaker dollar. The one exception is US small cap which played catch up with the S&P 500 over the last month. |
Monthly Movers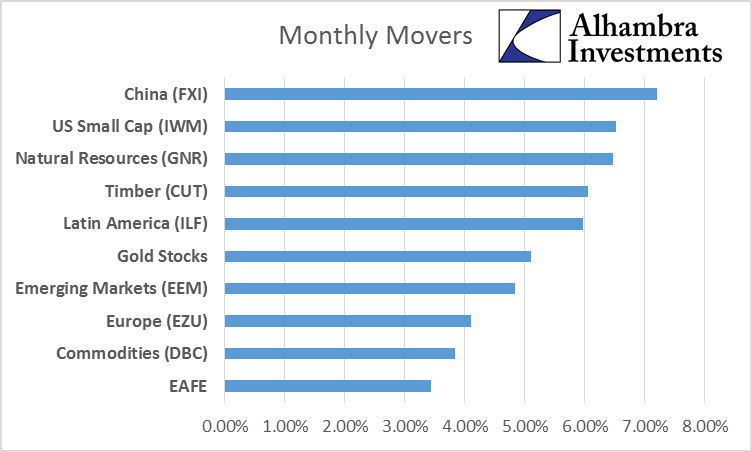 - Click to enlarge |
| Over the last three months there is a similar trend. Treasuries corrected over the last month as rates rose off their lows so they’ve dropped down the three month return list but commodities moved to the top. Like the trend of outperforming foreign stock markets, the commodity trend is dependent to a large degree on the dollar trend. |
3 Month Returns - Click to enlarge |
| Emerging market stocks continue to outperform the S&P 500 too: |
MSCI Emerging Markets ETF / SPDR S&P 500 ETF, Nov 2014 - Sep 2017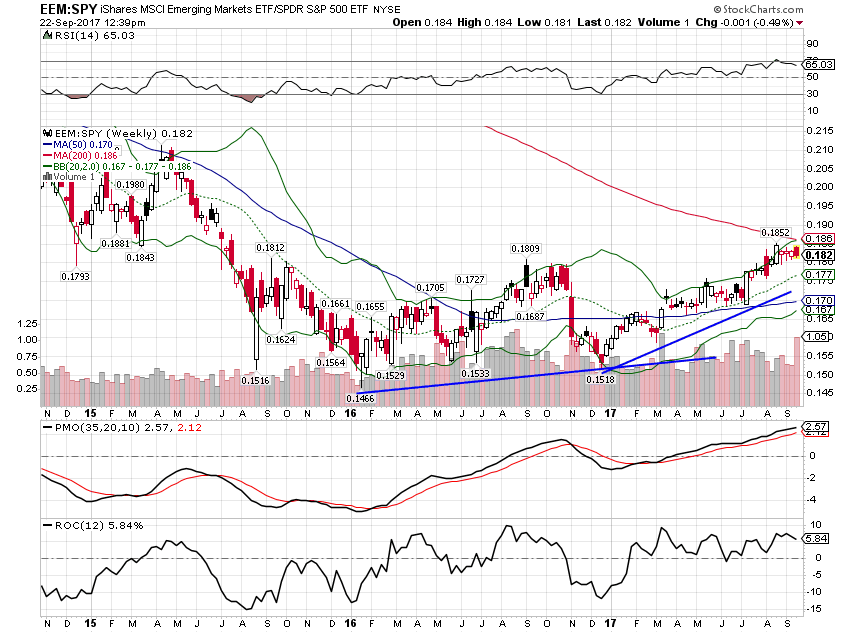 - Click to enlarge |
| EM stocks also continue to outperform EAFE stocks: |
MSCI Emerging Markets ETF/ MSCI EAFE ETF, Oct 2014 - Sep 2017 - Click to enlarge |
| Japan has not performed as well against the S&P or the EAFE. I still like the market because it is cheap and earnings growth has been quite good but the performance needs to pick up soon. Part of the problem has been the Yen which has not been as strong this year as I expected. The position hasn’t cost us much in terms of performance – it is still up just not as much as the alternatives – but if it doesn’t turn around soon, I’ll have to move on. |
MSCI Japan ETF / MSCI EAFE ETF, Nov 2014 - Sep 2017 - Click to enlarge |
| Europe continues to drive the performance of the EAFE: |
MSCI Eurozone ETF / MSCI EAFE ETF, March - Sep 2017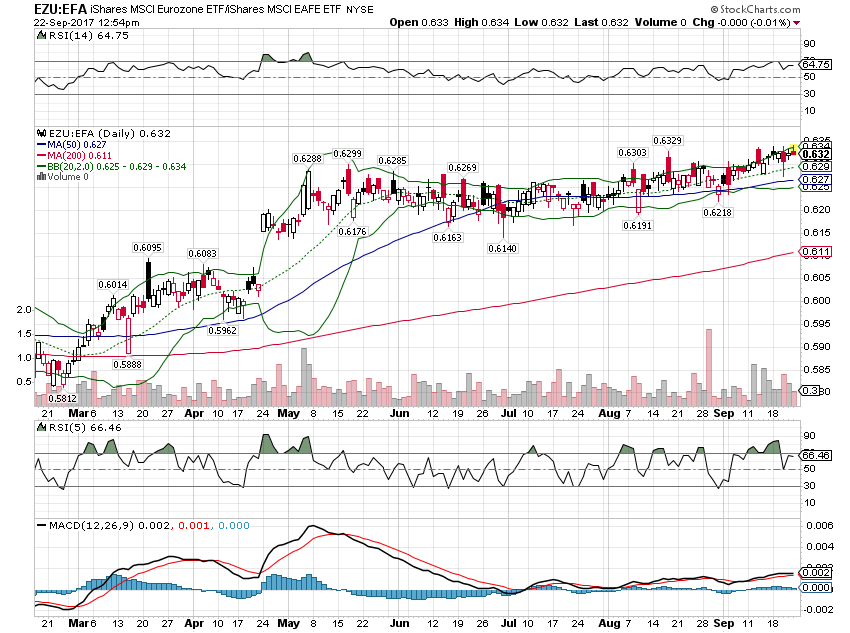 - Click to enlarge |
| In real estate, international is also outperforming but it isn’t by a lot. |
Dow Jones International Real Estate ETF, Jul - Sep 2017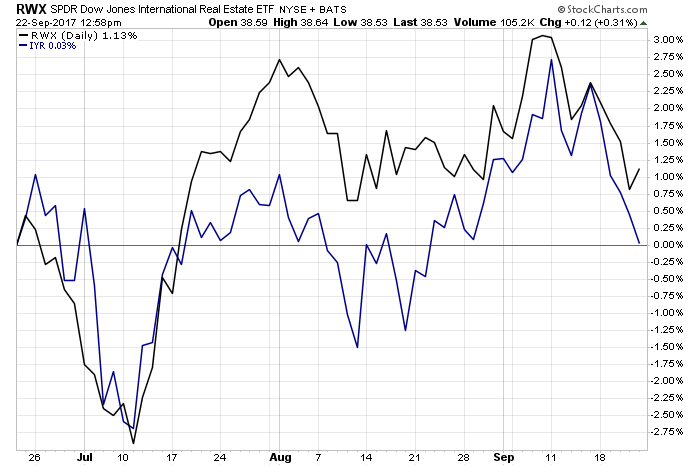 - Click to enlarge |
| The divergence in the copper:gold ratio I’ve been watching did close since my last update but not in the way I expected. Bonds and copper both sold off some but bonds were the bigger mover. I still don’t see a lot in the way of growth above trend though so we’ll see how this goes. |
Copper - Gold, March - Sep 2017(see more posts on Copper, Gold, ) - Click to enlarge |
| It is growth – or the lack of robust growth – that concerns me about the Fed’s continued march to tighter policy. The conundrum from the last tightening cycle appears intact to me. The Fed is trying to tighten policy – or at least doing the things that people believe are tightening – but the long end of the Treasury curve just isn’t cooperating. In the last cycle that turned out to be for good reason and it was the Treasury market that was right and the Fed that was wrong. I don’t think this episode will turn out any different.
As for Quantitative Tightening, or whatever you want to call the monetary liposuction of reducing the size of the Fed’s balance sheet, our view is that it won’t have much effect, at least not in the way the Fed believes. It seems to me that most of the effects of QE were psychological and distributional. Interest rates rose during periods of QE because it was expected to raise nominal growth (inflation). Interest rates fell when QE was suspended or ended. If that form holds true then we should expect rates to fall as the balance sheet shrinks. Will that happen? I can say with absolutely certainty that I have no idea. And I suspect the Fed doesn’t either. Their own internal research is contradictory when it comes to QE with one branch thinking it effective and another saying that its main effect was to make asset owners wealthier, a conclusion I find hard to argue with. There are also potentially some fiscal changes that could happen before the end of the year. I don’t think there is any way to handicap what Congress may or may not pass and what impact it might have on the economy. Generally, I would think a tax cut is positive but tax reform is not just a tax cut and it isn’t magic. The devil, as they say, is in the details. Any changes will take time to impact the economy and markets. Luckily, successful investing does not require us to divine the future, an impossible task. All it really requires is that we correctly perceive the present, a task that’s hard but at least not impossible. Right now, that present looks a lot like the recent past. No changes to the portfolios this month. |
Moderate Allocation - Click to enlarge |
Tags: Alhambra Research,Asset allocation,Bonds,commodities,Copper,copper to gold ratio,credit spreads,currencies,dollar,eafe,economy,Emerging Markets,Euro,Europe,Federal Reserve/Monetary Policy,Global Asset Allocation Update,Gold,Interest rates,Investing,Japan,Markets,Model Portfolios,momentum,newslettersent,Real Estate,stocks,Taxes/Fiscal Policy,TIPS,treasuries,U.S. Dollar Index,U.S. Treasuries,valuations,Yield Curve