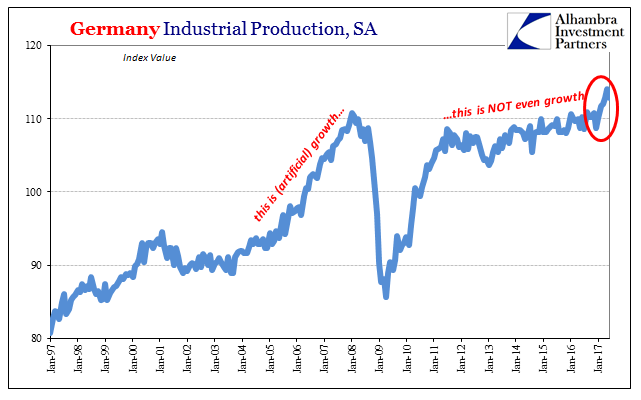
| Germany’s Federal Statistical Office (DeStatis) reported today disappointing figures for Industrial Production. The seasonally-adjusted series fell in June 2017 month-over-month for the first time this year, last declining in December 2016. The index had been on a tear, rising nearly 5% in the first five months of this year. The move was considered by many if not most in the mainstream a prime example of Mario Draghi’s pre-flip flop position – an economy in Europe if not already booming then at least on the cusp.
|
Germany Industrial Production, SA 1997-2017(see more posts on Germany Industrial Production, ) |
| It was another major difference with inflation estimates that still suggest instead lingering weakness. One or the other must be correct, so economists have been assuming that inflation rates will in short order rise to meet the proposed conditions of things like IP. But is European Industrial Production really inconsistent with inflation? |
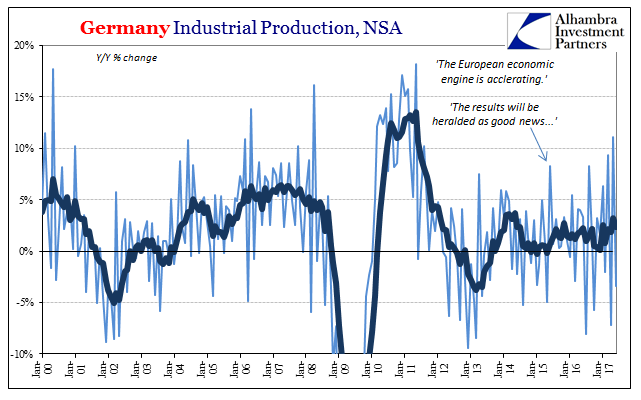
Germany Industrial Production, SA 1997-2017(see more posts on Germany Industrial Production, ) |
| There is here as everywhere else no arguing that the economy is moving upward and industry moving with it. Improvement is undeniable, though the actual degree of it is not nearly as straightforward. Unadjusted, German IP fell 3.4% year-over-year in June, but that followed an impressive 11% gain in May. This greater back and forth volatility has characterized German industry for all of 2017. That is why the 6-month average is just 2.36% (IP dropped more than 7% Y/Y in April but rose more than 9% in March). |
Germany Industrial Production, NSA 2000-2017(see more posts on Germany Industrial Production, ) |
| An average of 2% or 3% is like 2014 levels of growth rather than something truly robust. In February 2014, for example, the 6-month average for Germany IP was 3.47% on the “strength” of 5.8% (Y/Y) growth that month. The difference then compared to now was that the relativel improvement in industry was much more consistent three years ago.
That interpretation holds for more than just Industrial Production levels. German factory orders are like IP up and accelerating in 2017, but in almost identical fashion to 2014. Orders for new products, durable as well as nondurable and capital goods, were flat year-over-year in June after surging more than 9% in May (and falling 5% in April). |
Germany Factory Orders, NSA 2001-2017(see more posts on Germany Factory Orders, ) |
| More than revisiting 2014, however, “we” have to be careful in assuming that Germany is Europe. In many places the two are conflated often purposefully so as to present the best possible view of Europe’s economic conditions. If using German estimates as a proxy, they must be analyzed only as the upper boundary for European circumstances.
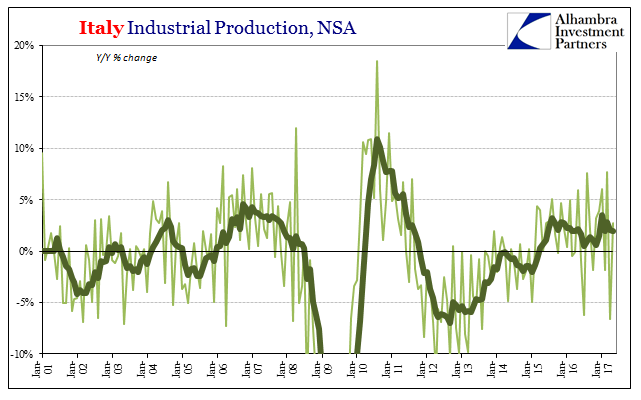
That is true even in comparison to countries below the so-called North/South divide. Up until this year, growth in Italian Industrial Production was outpacing (slightly) Germany’s. For Italy, the industrial sector has been growing consistently (more or less) since the middle of 2015 (no global downturn here). These are the best results since 2011, and a lot like 2006-07.
|
Italy Industrial Production, NSA 2001-2017(see more posts on Italy Industrial Production, ) |
| That would seem to argue against the weak inflation figures, however. If Italian as well as German industry is doing quite well in 2017, what is missing? The answer is, as always, context. Relative changes like we see here are most often confused for meaningful changes, and not just in how rates of expansion in 2017 look a lot like those in 2014. |
European Industrial Production, SA 2000-2017(see more posts on Eurozone Industrial Production, ) |
| Even on its latest win streak this year, German IP is only 1.9% above than the prior “cycle” peak set in January 2008 more than nine years ago. Italian industrial production, on the other hand, remains 22% less than its prior “cycle” peak set, unsurprisingly, in August 2007. German industry only looks good by comparison to the utter collapse in Italy. That both are now rising at the same time in 2017 really doesn’t mean nearly as much as is often claimed. |
European Monetary Adjustments 2000-2017 |
Similar disparities can be witnessed throughout European economic accounts of the various countries that often have had very different “recovery” experiences. In truth, none of them have actually recovered, and still aren’t doing so now. The most that can be said is that they aren’t at this moment getting worse (from a linear perspective). From this wider economic view, underwhelming inflation in Europe makes perfect sense for the monetary standpoint.
|
European Growth Baseline 1999-2017 |
Or, as Mario Draghi said himself at the last policy meeting:
There is also no boom in Europe, a result very much tied to inflation. It is misreading the situation in industry on relative terms that has led the media in particular to (grossly) mischaracterize the situation. As in the US, they have an agenda related to the politics of dissatisfaction; Brexit as well as any other possible national exits are to be characterized as inappropriate public responses to otherwise positive if uneven fruits of globalism. It sounds for the European Union and the euro much better than the truth – Europe has lost a whole decade under which its officials continued to claim it was getting nothing but better. |
European Growth Baseline 1995-2017 |
| The problem was never globalism except in the sense of global money. It (the eurodollar system) built the pre-crisis world up, and has now nearly destroyed many economies including some (like Italy’s) that didn’t much benefit from the buildup. We can’t simply ignore or set aside 2008 (or, in the case of Europe, also 2012) because we are not yet done with 2008. It still haunts the global economy. Time doesn’t erase this fact, it is instead a measure of the cost!
Low inflation rates all over the world loudly protest the more recent characterizations of economic conditions as robust, strong, or whatever other most positive qualifications. Those terms don’t even apply to German industry, which is the best of the best on the Continent. But they are wholly misplaced when trying to accurately figure and legitimately describe Europe. |
Inflation in Europe 2011-2017 |
Full story here Are you the author? Previous post See more for Next post
Tags: currencies,ECB,economy,Eurozone Industrial Production,factory orders,Federal Reserve/Monetary Policy,Germany,Germany Factory Orders,Germany Industrial Production,hicp,industrial production,inflation,Italy,Italy Industrial Production,manufacturing,Mario Draghi,Markets,newslettersent,QE


