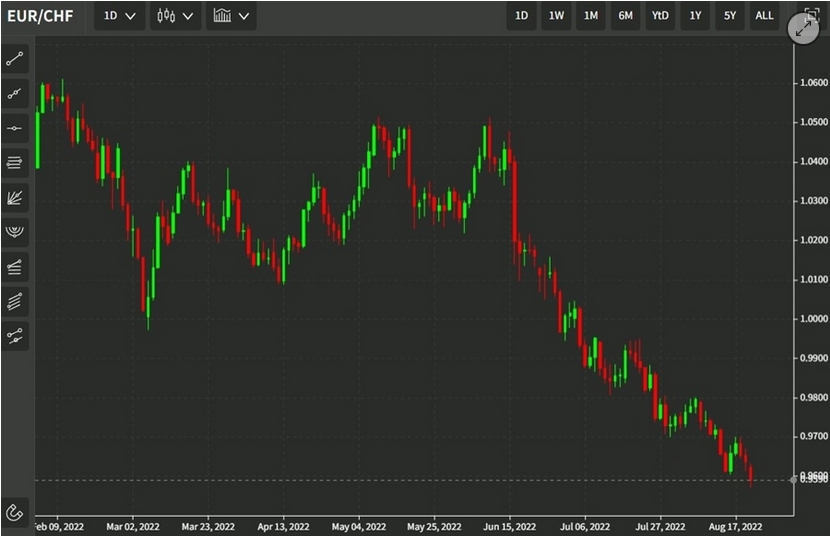
Swiss Franc vs USD and EURThe Swiss franc was the only major foreign currency that fell against the dollar last week. The 2.6% decline was the largest in two years. Stops triggered in the euro-franc cross, reports of direct investment-related franc sales for yen, and conviction that the SNB will lag behind the other central banks is thought to be behind the move. The dollar high in June was near CHF0.9785, and the band of resistance extends to CHF0.9810. The euro reached its best level against the franc since the cap was lifted in mid-January 2015.
The EUR/CHF might see a similar runup as the USD/JPY in 2013, when traders anticipated the Fed tapering.
While many have set their sights on CHF1.20, but we suspect strong resistance will be seen ahead of CHF1.17.
|
EUR/CHF and USD/CHF, July 29(see more posts on EUR/CHF, USD/CHF, )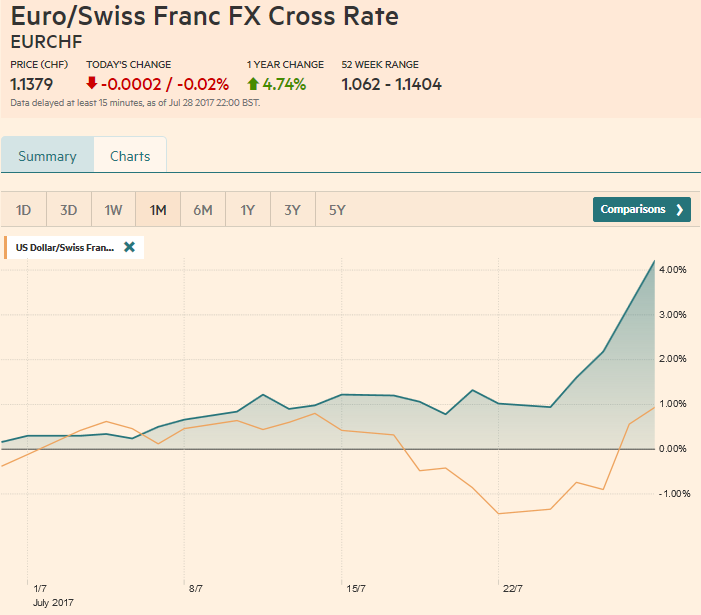 Source: markets.ft.com - Click to enlarge |
Will the ECB really taper and how quickly?
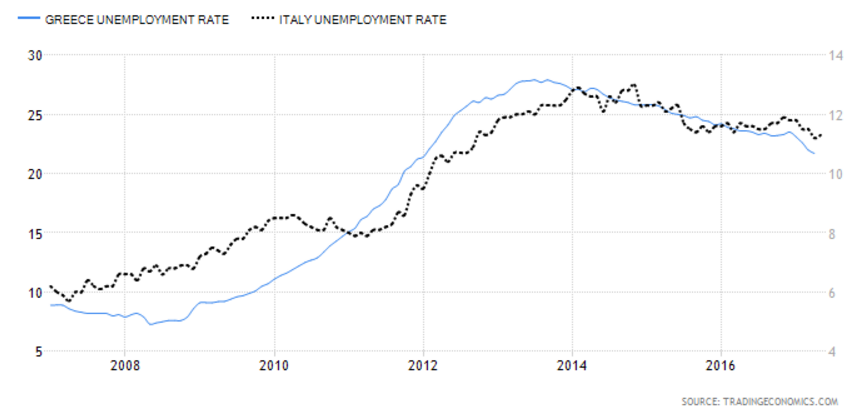
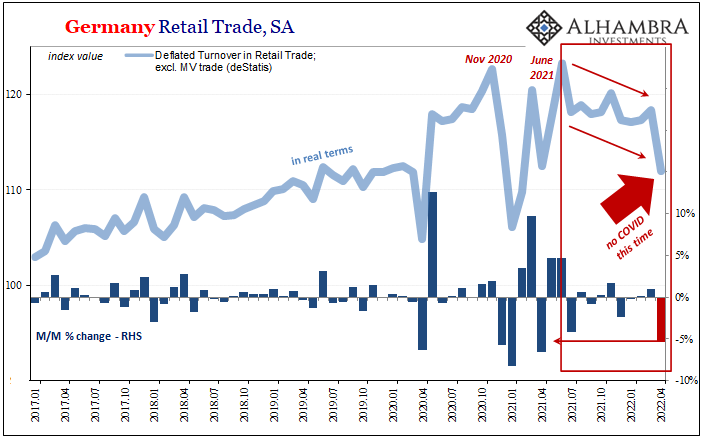
But the big difference, however, is the high unemployment rate in Greece, Spain, France and Italy versus 4.4% in the U.S. As for inflation the ECB research does not expect a big rise. We expect Euro zone headline inflation under 1% early next year.
|
Greece Unemployment Rate Compared To Italy |
Swiss Franc Currency Index (3 years)The Swiss Franc index is the trade-weighted currency performance (see the currency basket)On a three years interval, the Swiss Franc had a weak performance. The dollar index was far stronger. The dollar makes up 33% of the SNB portfolio and 25% of Swiss exports (incl. countries like China or Arab countries that use the dollar for exchanges). Contrary to popular believe, the CHF index gained only 1.73% in 2015. It lost 9.52% in 2014, when the dollar (and yuan) strongly improved. |
Swiss Franc Currency Index (3 years), July 29(see more posts on Swiss Franc Index, )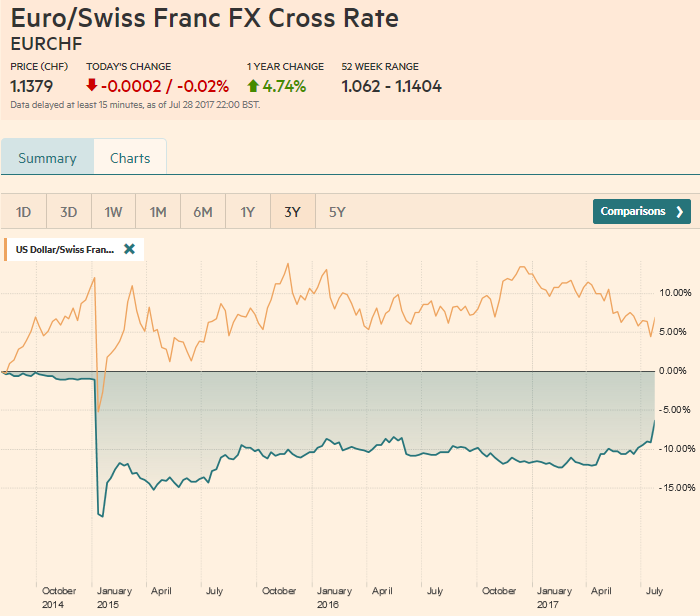 Source: markets.ft.com - Click to enlarge |
US Dollar IndexThe month ends on Monday, and the dollar is poised to finish the month lower against all the major currencies, but the Swiss franc.
Broadly speaking, the technical condition, which we will discuss below, remains fragile and there is a little sign a significant low is in place.
In terms of policy, investors appear to put more weight on the forward guidance of central banks that the Federal Reserve.
Meanwhile, the failure of the health care reform efforts not only leave the US system is poor shape but warns the Republican leadership may struggle to overcome the divide between moderate and conservative factions to pass the economic agenda of the new administration.
The same broad strategy that was tried with health care is being employed for tax reform: base approach solely on slim Republican majority, develop plan secretly with a small group of men, hope that it can bridge an intra-party divide that appears bigger than the inter-party rivalry.
The hubris of small differences can be formidable hurdles, and important legislative action is needed to lift the debt ceiling and to provide spending authorization for the new fiscal year that begins October 1.
Maneuvering around the debt ceiling is already distorting the bill market. The finesse will likely be exhausted in early October. If it is not resolved it could lead to prioritizing creditors and missing payments. The failure to agree on spending authorization could shut the government.
A push back against our argument since the June FOMC meeting that the Fed would announce the start of its balance sheet operations in September is that the Fed will not want to move if it looks as if there will be a government shutdown. The Federal Reserve seems to try to look past such short-run potential disruptions and focus its strategic goals.
|
US Dollar Currency Index, July 29(see more posts on U.S. Dollar Index, )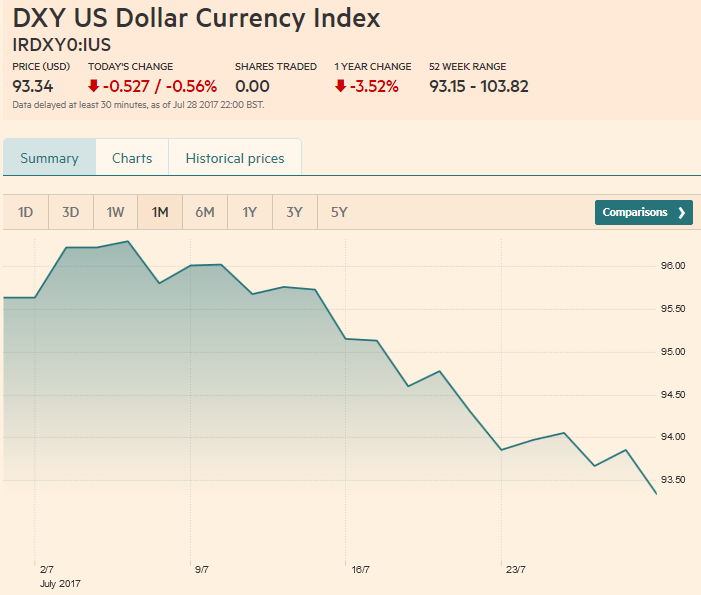 Source: markets.ft.com - Click to enlarge |
EUR/USDAlthough Macron’s honeymoon in France appears over, and Japan’s Prime Minister Abe’s support is at five-year lows, marooning his political agenda, the general euro-phoria and dollar-negativity remain intact.
The Dollar Index fell for its third consecutive week, and on Monday, will put the final touches on its fifth straight monthly loss. Our assessment is unchanged: the technicals are stretched, but there is nothing convincing to suggest a low is in place.
Previous support around 94.00 now becomes resistance, and a move above 94.30 would be encouraging. However, the downside beckons. The 93.00 area would be the next obvious target, but technical support may not be seen until closer to 92.60.
Before the last trading session, the euro was the strongest major currency year-to-date against the dollar.
However, the dramatic quarterly expansion in Sweden of 1.7% sparked a sharp rally in the krona, which has eclipsed the euro. In any event, the euro is up 11.5% so far this year and is closing out its fifth consecutive monthly advance with a three-week streak.
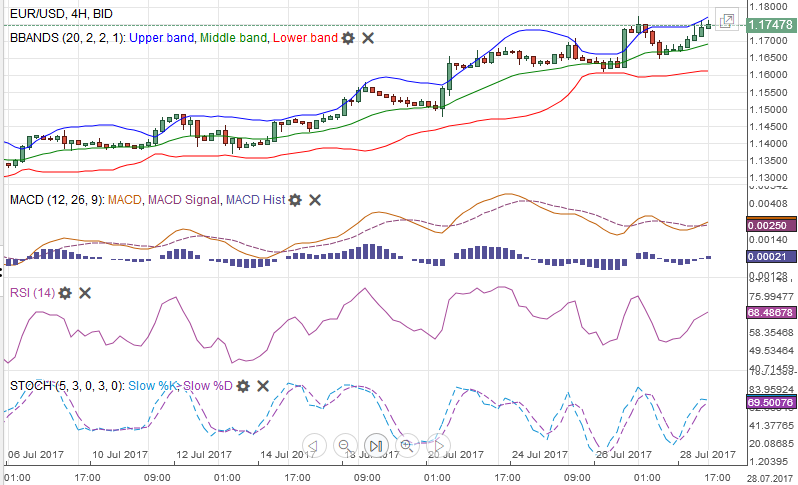
The euro approached $1.1780 before consolidating ahead of the weekend. The technical indicators are near extreme readings. The weekly RSI is at its highest level in a decade. Yet none of the indicators have turned down. As it has done for most of the month, it is climbing the alongside the upper Bollinger Band (~$1.1775).
Short-term traders seem quicker to take profits than they may have been before, and participants should continue to be sensitive to reversal patterns that would signal a potential pull back. The near-term trendline drawn off the lows from the second half of June and mid-July is found near $1.1550 to start the new week and nearer $1.16 at the end of the end.
|
EUR/USD with Technical Indicators, July 29(see more posts on Bollinger Bands, EUR/USD, MACDs Moving Average, RSI Relative Strength, Stochastics, ) |
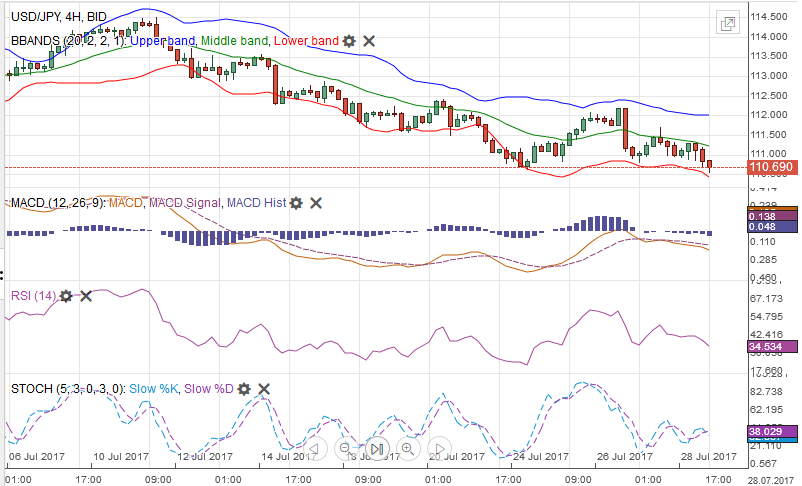
USD/JPYThe dollar is heavy against the yen, having been repulsed from the JPY112.20 area in the middle of the week. It closed below JPY111.00 for the first time since mid-June. The tone is heavy, even though the technical indicators are mixed. The RSI and MACDs are headed lower, while the Slow Stochastic is trying to turn higher from oversold. A break of JPY110.60 would likely spur a move toward psychologically important JPY110, though technically, more important support is near JPY109. The JPY112.00 area offers initial resistance, but it may take a move above JPY113.00 to be of technical significance.
|
USD/JPY with Technical Indicators, July 29(see more posts on Bollinger Bands, MACDs Moving Average, RSI Relative Strength, Stochastics, USD/JPY, ) |
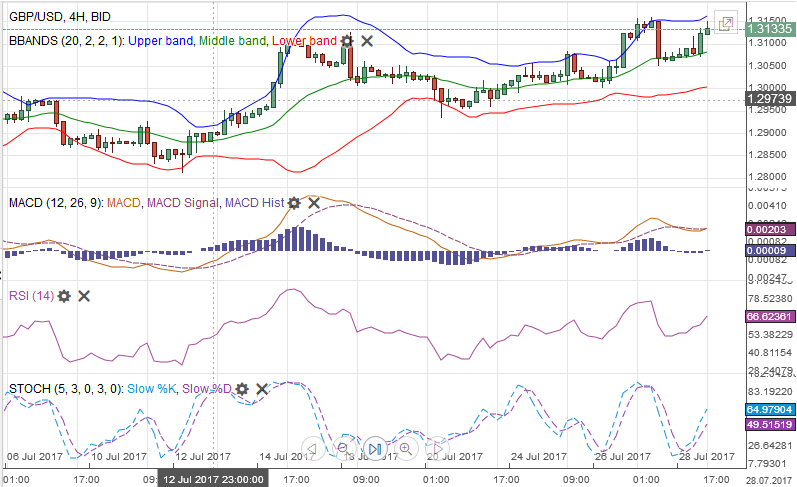
GBP/USDSterling climbed to new post-referendum highs last week. The technical indicators are not particularly strong, and the Slow Stochastic has not confirmed sterling’s rise. Sterling has been alternating between advancing and declining weeks since early May. This past week sterling advanced around 0.8% against the dollar, so next week it ought to fall to keep the pattern intact. The market’s response to the MPC meeting and the US jobs data may determine if the saw tooth pattern continues. Although support in around $1.2980 may be more important, we suspect that previous resistance and retracement objective near $1.3055 should hold if this is a breakout. The 50% retracement of the depreciation since the referendum is at $1.3430 (according to Bloomberg data). Meanwhile, the euro is consolidating a little below GBP0.9000. The market may make another attempt, but if penetration occurs, it may not be sustained. |
GBP/USD with Technical Indicators, July 29(see more posts on Bollinger Bands, GBP/USD, MACDs Moving Average, RSI Relative Strength, Stochastics, ) |
AUD/USDThe Australian dollar rallied to its best level since mid-2015 near $0.8065 before consolidating ahead of the weekend. Momentum and trend followers may try to run it higher ($0.8100-$0.8150 is the next important band of resistance), but the technical indicators warn that the correction or at least a consolidative phase is near. As we noted with the euro, the current conditions are often when reversal patterns. The $0.7875 area marks the lower end of the recent higher range. |
AUD/USD with Technical Indicators, July 29(see more posts on Australian Dollar, Bollinger Bands, MACDs Moving Average, RSI Relative Strength, Stochastics, ) |
USD/CADJust when it looked that the Canadian dollar, the best performing major currency since the beginning of May (10%) was going to fall victim to profit-taking, the stronger than expected May GDP (0.6% on the month and 4.6% year-over-year) gave it new life. The US dollar is found bids ahead of CAD1.2400. With the market more confident of a Q4 hike by the Bank of Canada than the Federal Reserve, the Canadian dollar can move higher. The technical readings are stretched. The Slow Stochastics have been moving sideways in the trough since the start of the month, and the weekly RSI is at its lowest level since 2007. However, the Canadian dollar enjoyed strong momentum ahead of the weekend and closed at its best level since the middle of 2015. The CAD1.2130-CAD1.2160 is the next important technical target. |
USD/CAD with Technical Indicators, July 29(see more posts on Bollinger Bands, Canadian Dollar, MACDs Moving Average, RSI Relative Strength, Stochastics, ) |
Crude OilThe continued dramatic slide in US crude oil inventories, the announcement of cuts in capex at several large oil companies, and new export restraint announced by Saudi Arabia (August) and UAE (September) spurred a rally in oil prices that carried the September light sweet contract to almost $50 a barrel ahead of the weekend. It is the highest the contract has been since the end of May. It surged through the trendline drawn off the April and May highs ($48.70 on July 31). It closed higher every day last week, and the nearly 8.5% gain over the stretch is the most since the end of August 2015. The gains ensure that the four-month declining streak is over. July will be the second month this year that oil prices rose. However, the technical indicators are stretched, and the Slow Stochastics are flat lining. Initial support is seen near $48, while the next target is around $52.00-$52.50. |
Crude Oil, July 2016 - July 2017(see more posts on Crude Oil, )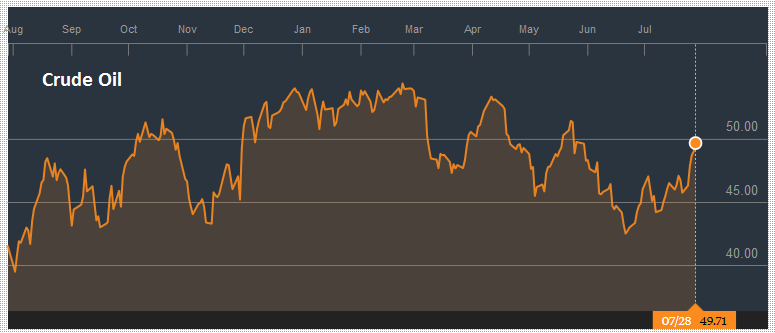 Source: bloomberg.com - Click to enlarge |
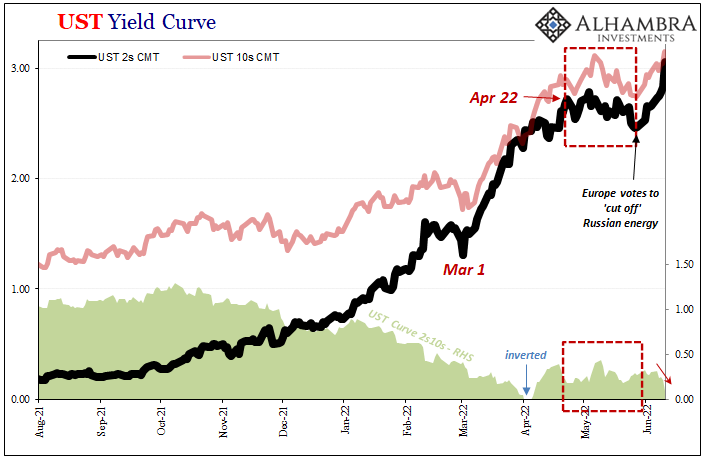
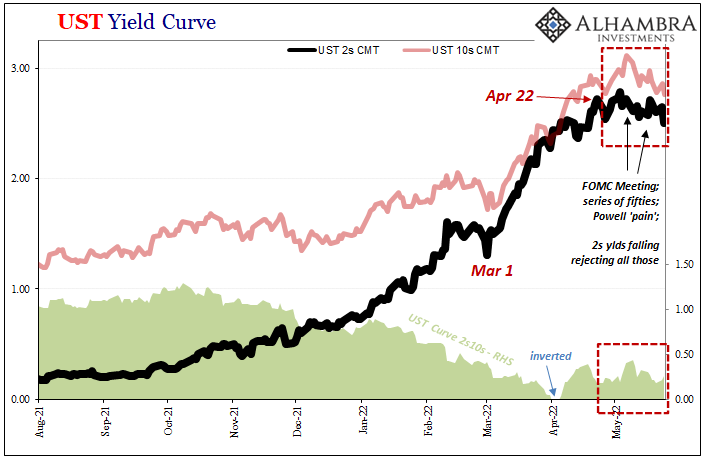
U.S. TreasuriesThe US 10-year yield has been in a 2.10%-2.40% range since the end of Q1. Most recently the range seems to be 2.20%-2.35%. Yields fell February through May and rose 10 bp in June. The generic 10-year yield rose nearly six basis points last week, which leaves the yield about a basis point lower than the level at the end of June. That means the last session of the month will likely determine the net result for the month. The technical condition of the September 10-year note futures contract is not particularly strong, though additional gains in the first part of next week are possible. The recent high was near 126-12. The Slow Stochastics have turned lower, and the MACDs are about to cross, suggesting some caution may be advised. |
Yield US Treasuries 10 years, July 2016 - July 2017(see more posts on U.S. Treasuries, )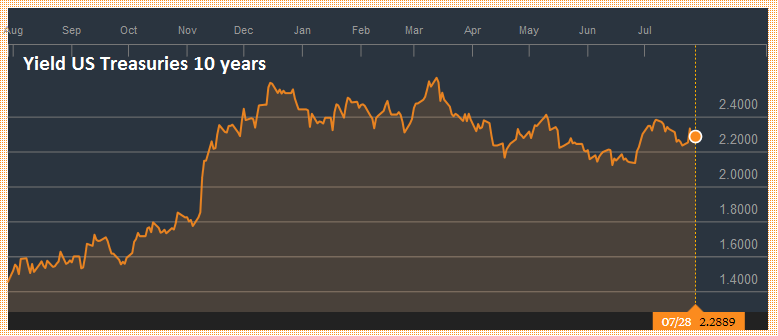 Source: bloomberg.com - Click to enlarge |
S&P 500 IndexUS stocks were mostly lower last week.
The Dow Jones rose nearly 1%, but the S&P 500 slipped marginally, due to the pre-weekend decline, and the NASDAQ eased around 0.3%, with technology a weight in the second half of the week.
The S&P 500 drop on July 27 filled the gap created by the higher opening on July 19. It proceeded to recovery before consolidating.
As we noted last week, the technical tone is deteriorating. The Slow Stochastics are rolled over, and the MACDs are poised to turn down. The RSI is at two-week lows. It is difficult to speak of meaning resistance at these uncharted waters.
The 2440-2450 area offers the first level of support. The 20-day moving average comes in just above there, and the S&P 500 has not closed below this average since July 11.
Separately, the Russell 1000 Value Index eked out a small increase to extend its advance for the third consecutive week.
Barring a sharp sell-off Monday, it will have risen for the second consecutive month. The technical condition looks vulnerable to a setback. The Russell 1000 Growth Index fell about 0.35% to break a three-week advancing streak. After slipping 0.4% in June, the first losing month since last October, the Growth Index returned to its winning ways in July with around a 2.8% advance.
|
S&P 500 Index, July 29(see more posts on S&P 500 Index, )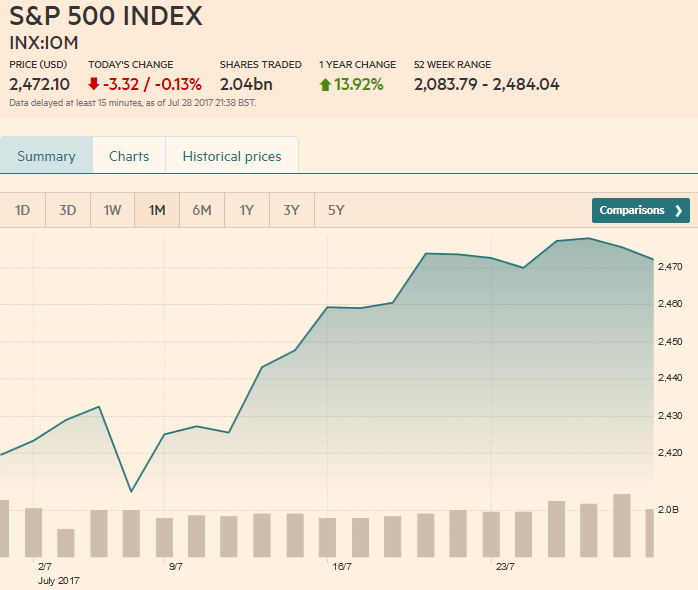 Source: markets.ft.com - Click to enlarge |
Are you the author? Previous post See more for Next post
Tags: Australian Dollar,Bollinger Bands,British Pound,Canadian Dollar,Crude Oil,EUR/CHF,EUR/USD,Euro,Euro Dollar,GBP/USD,Japanese yen,MACDs Moving Average,newslettersent,RSI Relative Strength,S&P 500 Index,Stochastics,Swiss Franc Index,U.S. Dollar Index,U.S. Treasuries,usd-jpy,USD/CHF,USD/JPY


