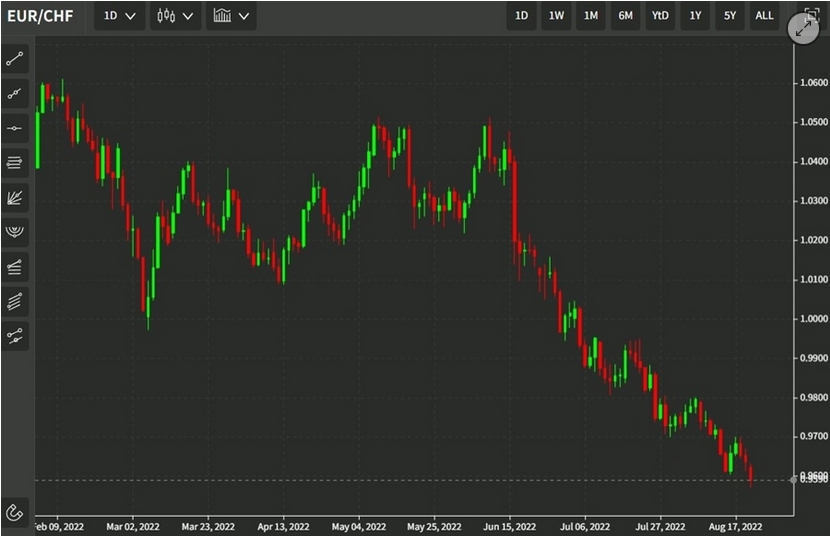
Swiss Franc vs USD and EURThe US Dollar has lost 4% against the franc since the beginning of May, while the euro is down only 1%. Most important events in this week were the ECB meeting and the UK elections. The inability of the Tory Party to secure a parliamentary majority spurred a sharp decline in sterling.
|
EUR/CHF and USD/CHF, June 10(see more posts on EUR/CHF, USD/CHF, )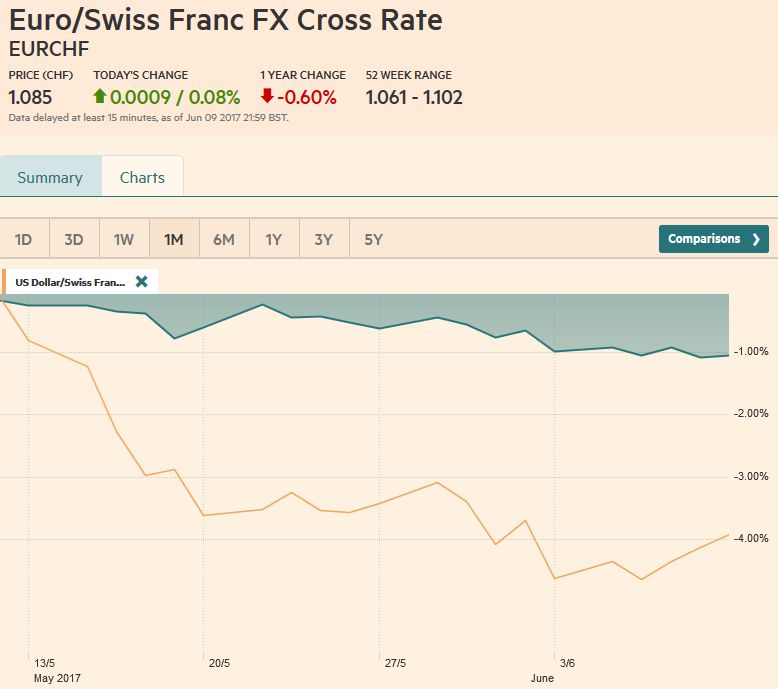 The picture shows that FX traders went long EUR against CHF. Source: markets.ft.com - Click to enlarge |
Swiss Franc Currency Index (3 years)The Swiss Franc index is the trade-weighted currency performance (see the currency basket)On a three years interval, the Swiss Franc had a weak performance. The dollar index was far stronger. The dollar makes up 33% of the SNB portfolio and 25% of Swiss exports (incl. countries like China or Arab countries that use the dollar for exchanges). Contrary to popular believe, the CHF index gained only 1.73% in 2015. It lost 9.52% in 2014, when the dollar (and yuan) strongly improved. |
Swiss Franc Currency Index (3 years), June 10(see more posts on Swiss Franc Index, )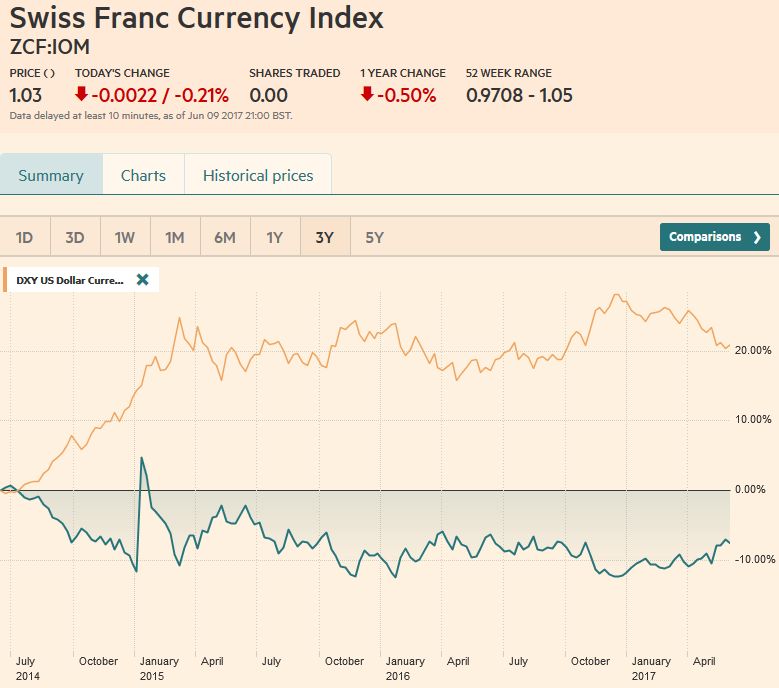 Source: markets.ft.com - Click to enlarge |
GBP/USD
The inability of the Tory Party to secure a parliamentary majority spurred a sharp decline in sterling. It helped complete a topping pattern that we had been tracking. Sterling had recovered smartly since dipping below $1.20 in mid-January. The rally stalled in front of $1.3055, which is the 38.2% retracement of the losses suffered since the UK referendum a year ago. More recently, it has appreciated this month ahead of election. It reached the high while the British people were going to the polls on June 8 near $1.2980.
Sterling carved a potential head and shoulders topping pattern. The left shoulder was shaped in the first half of May and topped before reaching $1.30. The head was the push in the second half of May to almost $1.3050. The right shoulder was formed in the past two weeks. The neck line appears to be around $1.2760. The measuring objective is in the $1.2450 area. On Bloomberg, which has the October low of $1.1840 (other services record a lower low), the 50% retracement of the rally since is $1.2445.
From another perspective, sterling initially held the 38.2% retracement of this year’s rally. That retracement is found near $1.2640. The 50% retracement is about $1.2520 and the 61.8% retracement a little below $1.24. The RSI and MACDs favor additional losses, while the Slow Stochastics are lagging. Of course, such a dramatic move has pushed sterling well below its lower Bollinger Band (~$1.2775), which is where its bounce after the low was recorded stalled. It should offer initial resistance. The high since the first exit poll-inspired drop was almost $1.2830.
|
GBP/USD with Technical Indicators, June 10(see more posts on Bollinger Bands, GBP/USD, MACDs Moving Average, RSI Relative Strength, Stochastics, ) |
US Dollar IndexThe Dollar Index moved higher for the last three sessions. It is the longest streak in a month. The Dollar Index held the lows seen last November below 96.00. It finished the week above its 20-day moving average for the first time since peaking on May 11. Initial resistance is seen near 97.75-97.80. A move above there would likely coincide with the crossing of the five and 20-day moving averages. The recovery can run toward 98.60 before more difficult questions about the medium-term outlook may be raised. |
US Dollar Currency Index, June 10(see more posts on U.S. Dollar Index, )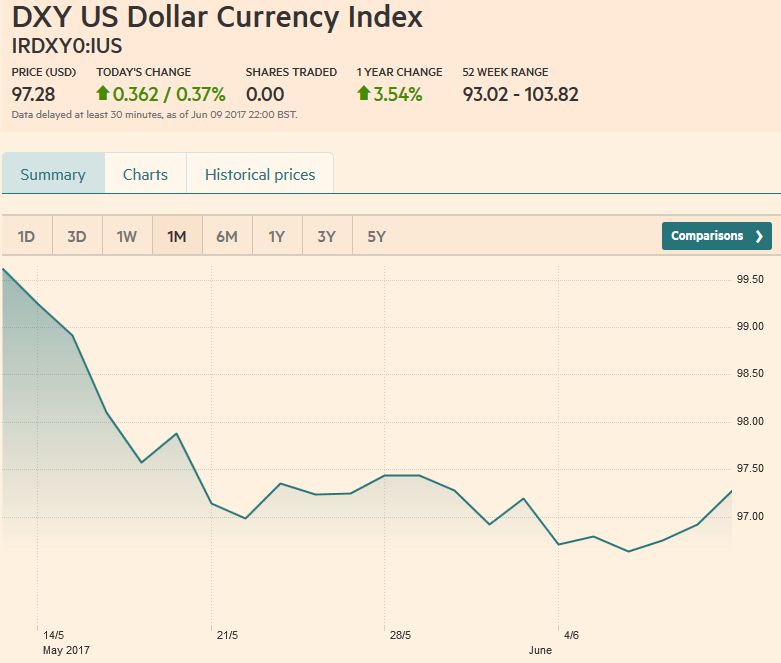 Source: markets.ft.com - Click to enlarge |
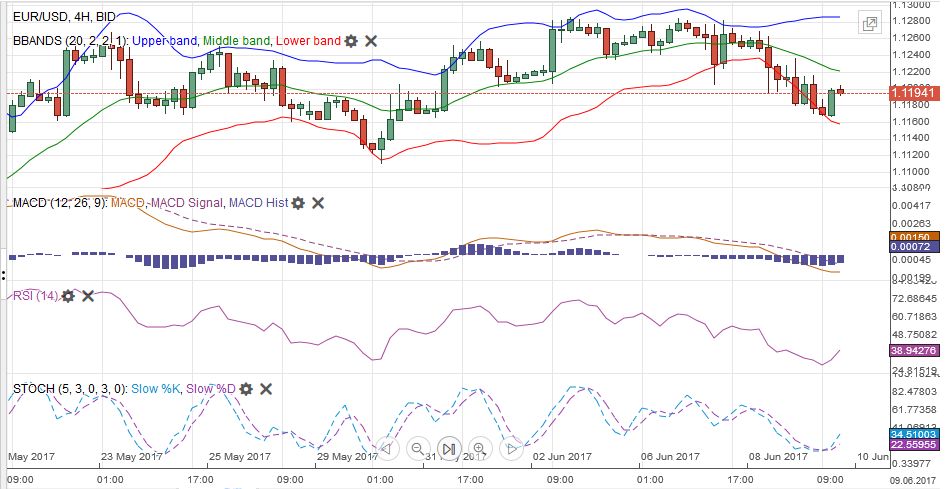
EUR/USDThe euro appears to be potentially turning. For four sessions it knocked on $1.1285, trying to clear $1.13, with some talk of a move back to $1.16, last year’s high. The euro is softening and the RSI and MACDs warned of more downside risk ahead of next week’s FOMC meeting. The euro slipped below its 20-day moving average (~$1.1190) for the first time since April 18, but managed to finish the week a couple ticks above it. It has retraced more than 61.8% of the last leg up that began at the end of of May from $1.1110. That retracement objective was $1.1180. A break of the $1.1100 area could quickly see $1.1050.
There is a potential double top in the euro and the $1.1110 is the neck line. If valid, the measuring objective of the pattern is near $1.0935, which corresponds to the 38.2% retracement objective of the rally since the start of the year and the 50% retracement of the rally since the April 10 low (~$1.0570). The widening premium the US also offers over Germany should also weigh on the euro. On the other hand, a move above $1.13 will excite the bearish dollar consensus that has emerged, and spur talk of a move to $1.15-$1.16, the latter being last year’s high.
|
EUR/USD with Technical Indicators, June 10(see more posts on Bollinger Bands, EUR/USD, MACDs Moving Average, RSI Relative Strength, Stochastics, ) |
USD/JPYThe US 10-year premium over Japan widened 7.5 bp over the past week and may be helping the dollar recover against the yen. The greenback fell to almost JPY109 in the middle of last week, and rebounded smartly to approach JPY111 before the weekend. It retraced 61.,8% of the loses suffered since the tepid US employment report on June 4. The technical indicators are supportive. A move now above JPY111.20 would bolster confidence that a low is in place, and could signal a move back toward JPY113.00.
|
USD/JPY with Technical Indicators, June 10(see more posts on Bollinger Bands, MACDs Moving Average, RSI Relative Strength, Stochastics, USD/JPY, ) |
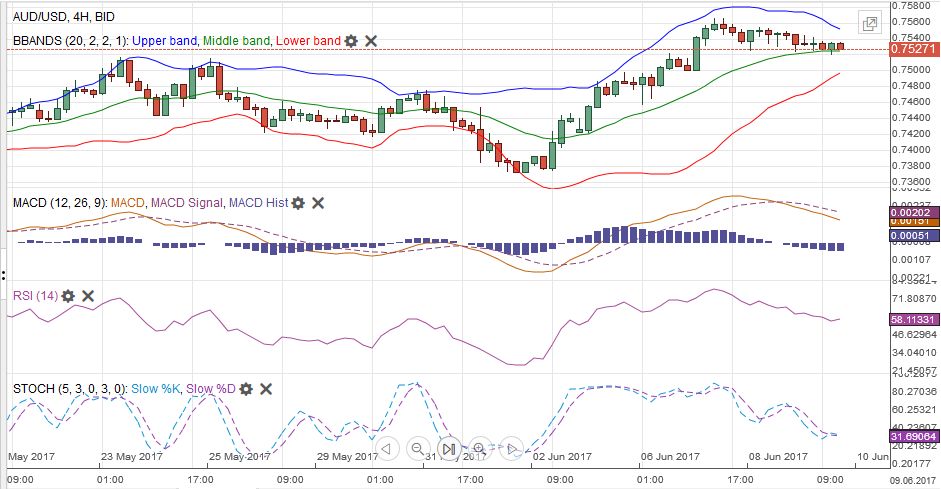
AUD/USDThe Australian dollar was the strongest of the majors last week. It gained 1% against the greenback, and that is after it eased over the last two sessions. Initial support is pegged near $0.7500, and it may require a break of $0.7450-$0.7470 to signal a top is in place. Here in Q2, the Australian dollar has only advanced in three weeks. One week in April. One week in May, and now one week in June.
|
AUD/USD with Technical Indicators, June 10(see more posts on Australian Dollar, Bollinger Bands, MACDs Moving Average, RSI Relative Strength, Stochastics, ) |
USD/CAD
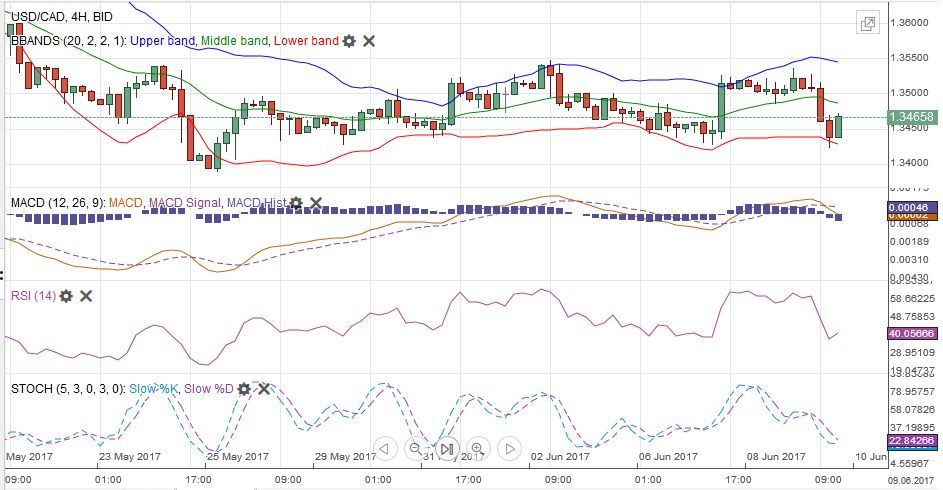
A strong employment report helped the Canadian dollar ahead of the weekend, when it was the only major currency to advance on the greenback. Canada created more than three times the number of jobs that were expected (54.5 vs 15.0). It was the most jobs since last September (64.6k), which itself was the highest since April 2012. These were all full-time positions (77k), and the participation rate increased to 65.8 % from 65.6% while the unemployment rate tick up only 0.1% to 6.6%. The US dollar posted a outside down day against the Canadian dollar. The technical indicators are mixed. The most important technical consideration may be the proximity of the uptrend line drawn off the mid-Feb and mid-April lows that caught the late-May low and last week’s low. It is found near CAD1.3440. Below there, CAD1.3380 may offer support and then CAD1.3280.
|
USD/CAD with Technical Indicators, June 10(see more posts on Bollinger Bands, Canadian Dollar, MACDs Moving Average, RSI Relative Strength, Stochastics, ) |
Crude OilThe July light sweet crude oil futures contract fell for the third consecutive week. The unexpected US oil (and energy) inventory build, coupled with higher output from Libya and Nigeria took a toll In the second half of last week, the momentum slowed, but recovery upticks were minimal. Initial resistance is seen near $48. It is difficult to see chart-based support until last month’s spike low near $44 a barrel |
Crude Oil, June 2016 - June 2017(see more posts on Crude Oil, ) Source: bloomberg.com - Click to enlarge |
U.S. TreasuriesUS 10-year yields rose from 2.13% on June 6 and finished the week around 2.22%. The 10-year yield has been below its 20-day moving average (now ~2.23%) since May 17. The Fed has hiked rates three times in the cycle so far, and each time bond yields have moved lower. Both in December 2016 and March 2017, the 10-year yield had risen markedly and was near the upper end of a broad range when the Fed cut. This time yields are at the lower end of a six-month range. The September note futures posted an outside down day before the weekend. The technical indicators favor follow through selling next week. A break of 125-30would strengthen the case of a top in price (low in yield).
|
Yield US Treasuries 10 years, June 2016 - June 2017(see more posts on U.S. Treasuries, )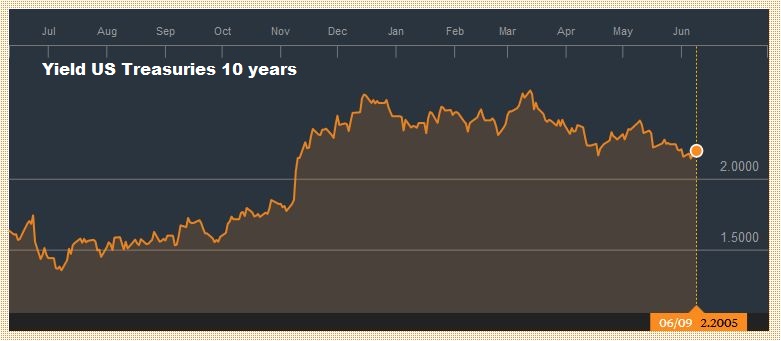 Source: bloomberg.com - Click to enlarge |
S&P 500 IndexThe S&P 500 reached new record highs before a retreat, punctuated by a sharp drop in large cap technology names. By the close it recouped about half of its intraday losses. It fell to 2415 and rallied 16 points to closed at 2431, but it was not sufficient to give a positive close for the sessions, and reversed and a little more the gains that it had coming into Friday’s session. It is difficult to talk about meaningful resistance in these uncharted waters. The technical indicators are mixed. A test for the bulls will be if they can still push equities higher if bond yields do rise further as we expected. The loss on the week, pushed the S&P 500 into third place among G7 markets this year, with an 8.6% gain. It lags behind Germany (11.6%) and France (9%). MSCI Emerging Market equity index is up 18.4%.
|
S&P 500 Index, June 10(see more posts on S&P 500 Index, )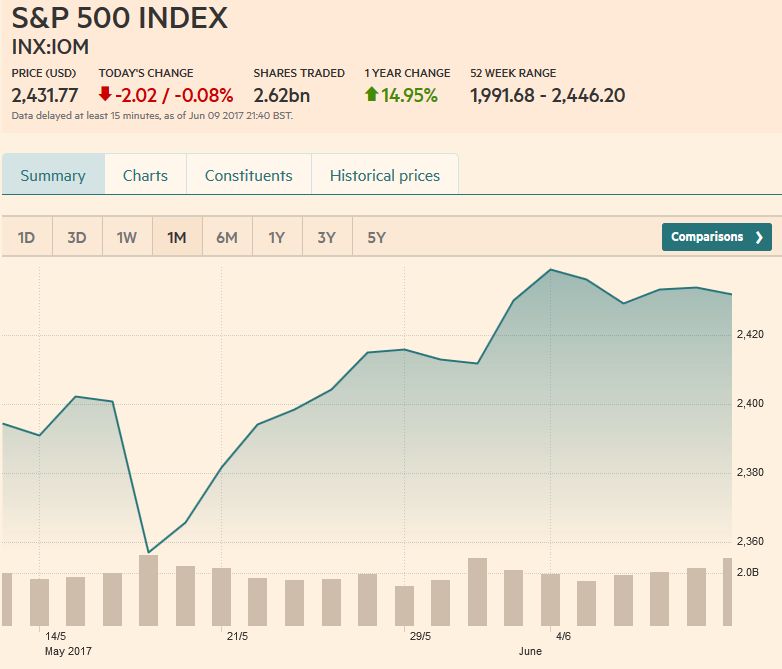 Source: markets.ft.com - Click to enlarge |
Are you the author? Previous post See more for Next post
Tags: Australian Dollar,Bollinger Bands,British Pound,Canadian Dollar,Crude Oil,EUR/CHF,EUR/USD,Euro,Euro Dollar,GBP/USD,Japanese yen,MACDs Moving Average,newslettersent,RSI Relative Strength,S&P 500 Index,Stochastics,Swiss Franc Index,U.S. Dollar Index,U.S. Treasuries,usd-jpy,USD/CHF,USD/JPY


