Marc Chandler
My articles My offerMy siteAbout meMy videosMy books
Follow on:LinkedINTwitterSeeking AlphaAmazon
| This Great Graphic was tweeted by Martin Beck, and it comes from Oxford Economics, using Haver Analytics database. It shows the relative economic growth since 2008 for the US, UK, Japan, and EMU.
It will not surprise many to learn that US contraction was not as deep as in the areas. It also would not be surprising to learn that the US economy has grown the most since 2008. This is part of the material basis for the divergence of monetary policy and the third significant dollar rally since the end of Bretton Woods. On the other hand, many might suspect Japan has been the worst of the bunch, but in truth, it is the eurozone that has been the laggard. However, that is about to change. Real GDP growth in the eurozone is about to overtake Japan. Controversy has emerged over the outlook for the US and UK monetary policy. There is nothing in the red line depicting the US, which suggests the eight-year recovery is about to end. There are no significant imbalances. While the Fed has hiked, the real Fed funds and two-year note yields are still negative. The Fed has not tightened so much as removed some accommodation. The US economy slowed from 3.5% in Q316 to 2.1% in Q4 and then 1.2% in Q1 17. However, the slowdown is likely behind the US as GDP appears to have accelerated in Q2. After being widely criticized for being too dovish, the Federal Reserve has become subject to widespread criticism that is was too hawkish last week in announcing a rate hike and details of its unwinding of QE. Some argue the economy is slowing, but this assessment is made by looking at the rear-view mirror. The Fed does not target GDP.Its mandate is full employment, and that has been approached. It has a mandate for price stability. Inflation has softened in recent month, but Yellen and the Fed’s leadership wants to look through it as it has been primarily driven by the fall in energy prices and wireless communication. There are some other quirky things, dragging down core inflation, like owner equivalent rent (falling while rents are rising). The prices received from the Philly, and NY Fed surveys reached new five-year highs. |
Real GDP of US, UK, Japan and EMU Compared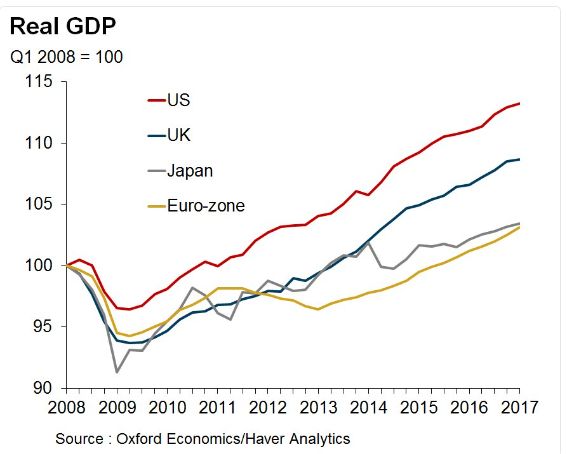 Red Line: US, Blue Line: UK, Gray Line: Japan, Yellow Line: Eurozone - Click to enlarge |
Underneath Yellen and Dudley’s recent comments is a faith in the Phillip’s curve, which essentially asserts that businesses will raises prices to offset rising labor costs. This is a debatable point. Is labor really simply another input, like raw materials? Some argue that wages did not fall as much as the economic conditions would have suggested during the crisis given the slack and deflationary conditions. Others argue that wages should be rising faster now, even though they are growing faster than productivity. In any event, as long as the labor market is absorbing its slack, at least some Fed officials will be confident that price pressures will rise even if there are unpredictable lag times.
At the same time, some Fed officials, like Chicago’s Evans, have expressed concern about “technological deflation.” It appears, for example, that Amazon can deliver food items at around 20% lower than one can buy them in the store from Whole Foods. Uber, now Lyft, can undercut traditional taxi cabs and black cars. The idea is that new technology is disruptive, enhances competition and drives prices lower.
On the other hand, the kinds of goods that are covered do not seem to be large weights in CPI or core PCE basket. And the enhanced competition might be a short transition phase. Consider that Google accounts for nearly 90% of search advertising. Facebook accounts for almost 80% of mobile social media traffic. Roughly three-quarters of e-books are sold by Amazon.
For its part, the Bank of England has whipsawed the markets. Last week’s 5-3 vote was closer than expected. We had correctly anticipated Carney would set the market straight. Indeed Carney played down the need to raise rates soon. However, Haldane, the BOE chief economist, came out today, seemingly allying himself with the Hawks over Carney.
One could reconcile Carney and Haldane. Carney did suggest that the economic data in the coming months would beparticularly important. Haldane said that if data “are still on track” that unwinding the accommodation provided last August (after a referendum) “would be prudent moving into the second half of the year.” Haldane’s comments are all the more important because he is seen as part of the dovish contingent at the BOE, unlike say McCafferty who had dissented last year in favor of an immediate hike on a few occasions.
However, Carney seems considerably more concerned about the economy going forward. He noted the squeeze on earnings that could weaken consumption and output. He also put an emphasis on the uncertainty (Brexit, politics) that increase the range of possible outcomes. Despite the slowing of the UK economy, the slowing earnings growth and the loss of momentum of the PMIs, Haldane insists that the overall economic picture is a “reasonably reassuring one.”
Looking at the OIS, a week ago, before the BOE meeting, there was about a 6.5% chance of a hike before the end of the year. At the end of last week, there was almost a 24% chance discounted. It now stands near 36%. Sterling has encountered offers about a cent lower than it did last week on the MPC vote. Haldane’s comments did not completely unwind Carney’s effect. Yesterday’s high was almost $1.2760. Today’s high has been $1.2710. Sterling has already unwound about half of its Haldane-inspired gains. A break of $1.2630 warns of a retest of the lows.
Full story here Are you the author?Tags: #GBP,Bank of England,Federal Reserve,GDP,Great Graphic,Growth,newslettersent