Selling in May, With PrecisionIf you “sell in May and go away”, you are definitely on the right side of the trend from a statistical perspective: While gains were achieved in the summer months in three of the eleven largest stock markets in the world, they amounted to less than one percent on average. In six countries stocks even exhibited losses! Only in two countries would an investment represent an interesting proposition, as I have shown in the last issue of Seasonal Insights via back-test calculations for the time period 1970 to today. |
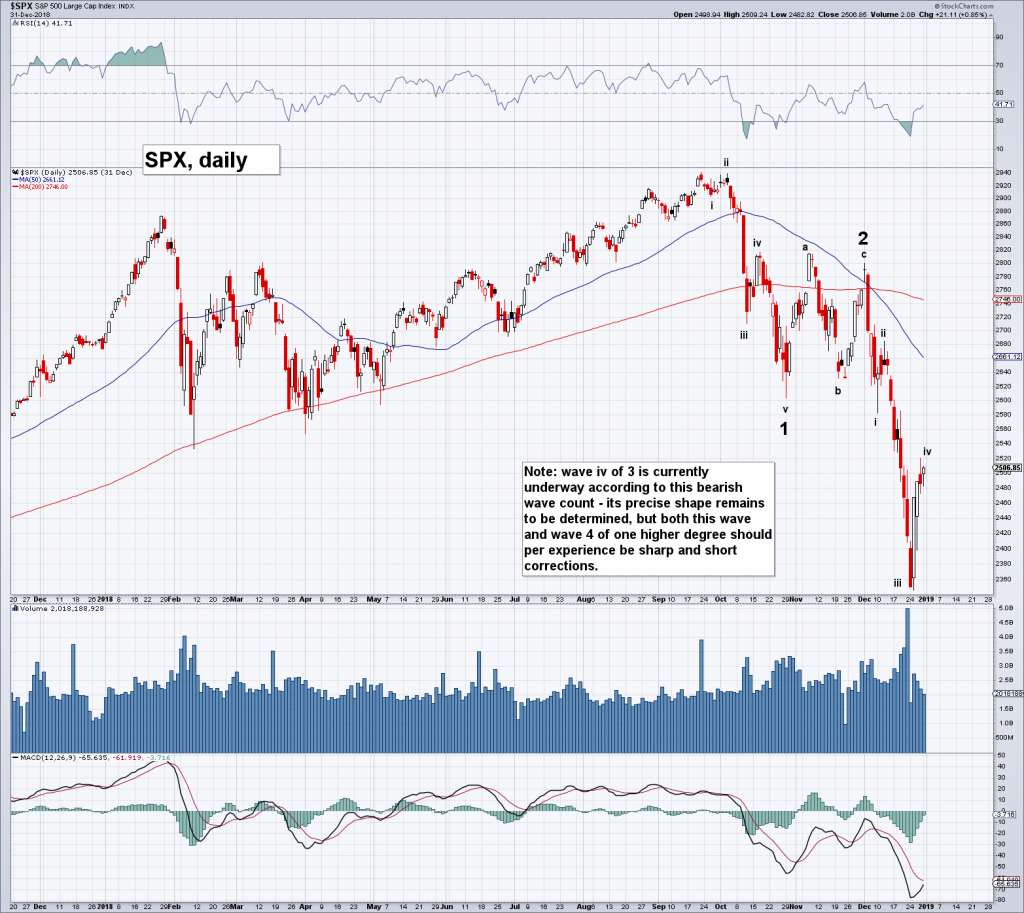
 The perennial stock market question: when is the right time? [PT] - Click to enlarge |
| But does it really make sense to sell at the beginning of May and buy one’s position back again after six months? After all, it seems a bit strange to assume that stock market behavior will adhere precisely to a time period of six months.
Below we will take a look at how one can improve investment results in this context by applying a modified set of rules. |
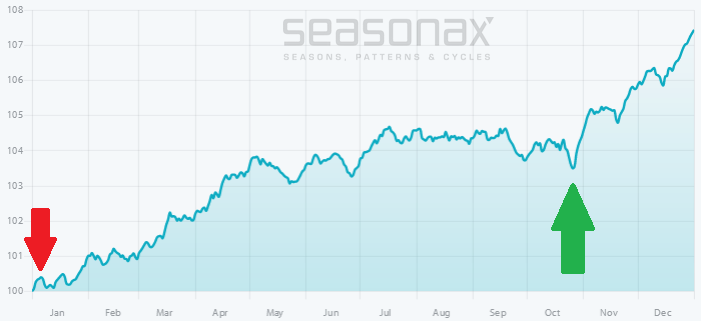
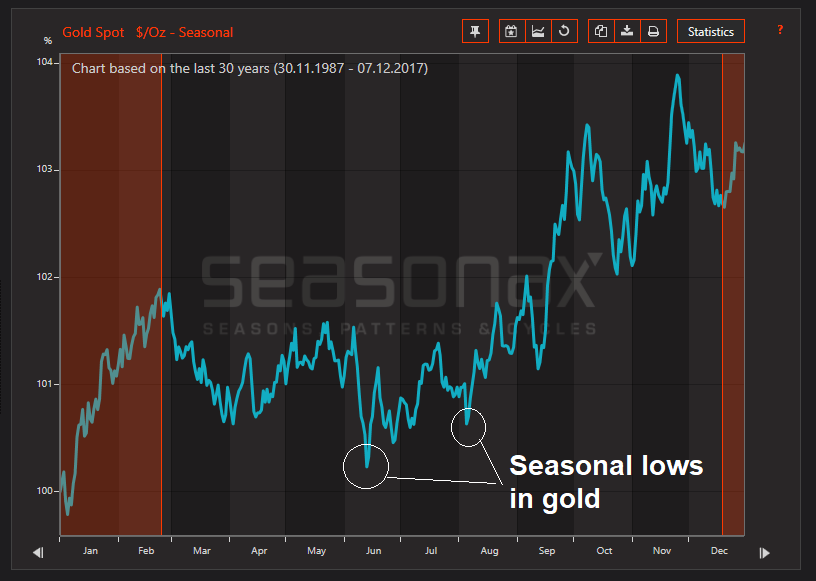
S&P 500 Index: Seasonal Average(see more posts on S&P 500 Index, )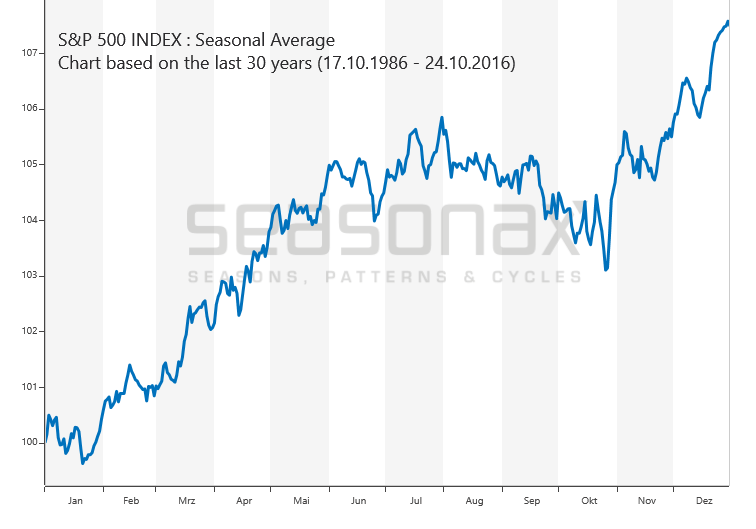 A 30 year seasonal chart of the S&P 500 Index – as you will see further below, its behavior in the weak seasonal period is very similar to that of the market Dimitri picked as an example. Said example has a few interesting idiosyncrasies though that traders will surely find very interesting [PT] - Click to enlarge |
“Sell in May” in Germany’s DAX IndexAs an example I have picked the German Dax Index, which is one of the biggest losers during the six summer months. The chart below shows its seasonal pattern in the course of a year. The horizontal axis shows the time of the year, the vertical axis depicts the 30 year seasonal index since 1987. The six summer months are highlighted in blue. According to the “Sell in May” rule, one should not be invested in this time period. As a matter of fact, the seasonal index does stand at a lower level in early October than at the beginning of May – thus, following the “Sell in May” rule would have been profitable. The seasonal chart confirms the back-test calculation presented in the previous discussion of the “Sell in May” adage, which arrived at the same conclusion. However, one can also see that the DAX actually reaches its seasonal peak in mid July. It would therefore obviously have been even better to sell at a later point in time. |
DAX Index - Seasonal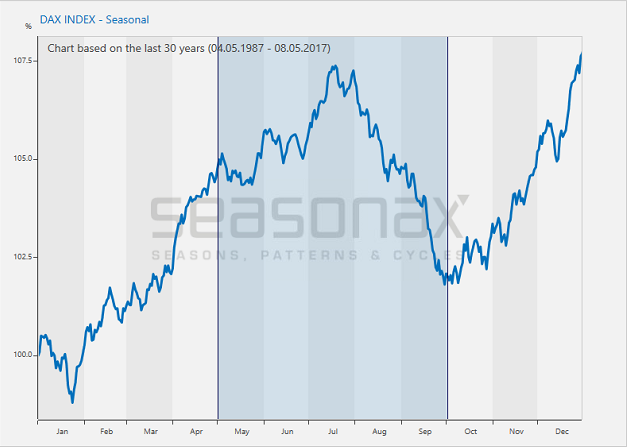 DAX, seasonal pattern, calculated over a time span of 30 years. After May 1, the index continues to rise, until it peaks in mid July (note that the SPX pattern is quite similar in that respect [PT]). - Click to enlarge |
Optimal Seasonal Turning Points in the DAXLet us look a bit more closely at the actual weakest seasonal phase in the DAX. The next chart shows the 30-year seasonal pattern of the DAX again, with only the weakest part of the pattern highlighted instead of the entire six summer months. The seasonally weakest trend begins precisely on July 19 and ends on October 02. The average loss generated by the DAX in this time period over the past 30 years amounted to a quite astonishing 5.18 percent. By contrast, the loss over the entire six month period in line with the “Sell in May” rule only amounted to 3.75% on average. Ultimately it was definitely worthwhile to time the exit with a bit more precision and remain invested for longer. |
DAX, seasonal pattern, calculated over a time span of 30 years.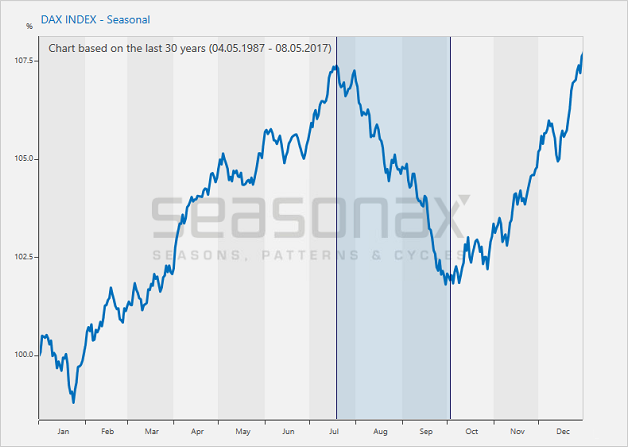 The weakest seasonal phase lasts only slightly over two months (Readers familiar with seasonal charts will immediately recognize that the extent of the weakness in the index during that time period is quite stunning [PT]). - Click to enlarge |
The DAX Declined Only Every Other Time – But Often Quite DramaticallyBut did it always make sense to sell? The bar chart below shows the return generated by the DAX in the seasonally weak time period July 19 – October 02 in every single year since 1987. By dehomogenizing the 30 year average one learns a few quite interesting details. Red bars indicate losses, green bars indicate gains. The surprising result: the DAX actually declined in only in half of all cases in the seasonally weakest period, i.e., on 15 out of 30 occasions. However, the losses were at times mindbogglingly large, amounting to up to 35.79 percent, as the rather conspicuous red bars illustrate. In other words, when it did decline, it often did so dramatically, saddling investor with quite painful losses. While gains occurred at the exact same frequency, they were far smaller than the losses by comparison – hence the surprising extent of the weakness in the seasonally weakest period on the long term seasonal chart. As an aside, readers can check out the charts of the remaining countries at www.seasonalcharts.com free of charge. Thise of you who have access to a Bloomberg Terminal or Thomson-Reuters Eikon, can check them out via the Seasonax app. |
Return of the DAX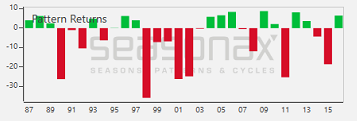 Return of the DAX between 19. July and 02. October in every single year since 1987. Downward moves in this seasonally weak time period were often huge. - Click to enlarge |
Conclusion, by PT
First of all, the old “Sell in May and Go Away” adage is indeed valid. If one were to adhere to it in a disciplined manner as a long term investor, it would tend to improve one’s long term results while at the same time lowering one’s risk (due to being exposed to market risk for only 50% of the time). In the past, transaction costs would have erased this advantage, but luckily that is nowadays no longer the case.
However, if employing statistical edges in investing is one’s thing, one can obviously do even better by applying more precise timing based on well-worn seasonal patterns. Note in this context that many of these patterns have proved to be quite persistent over very long time periods, in spite of the fact that several of them are widely known. For some reason they have not been arbitraged away yet. Of course, sometimes such patterns do shift in time or in extent if more people try to take advantage of them, but that is something a high-precision seasonal algorithm like the one employed by Seasonax will catch and reflect.
Charts by: Seasonax
Chart and image captions by PT where indicated
Full story here Are you the author?
Tags: Chart Update,newslettersent,S&P 500 Index,The Stock Market