Joseph Y. Calhoun
My articles My siteAbout meMy videosMy books
Follow on:LinkedINTwitterSeeking AlphaAmazon
| The economic data releases since the last update were generally upbeat but markets are forward looking and the future apparently isn’t to their liking. Of course, it is hard to tell sometimes whether bonds, the dollar and stocks are responding to the real economy or the one people hope Donald Trump can deliver when he isn’t busy contradicting his communications staff. Politics has been front and center recently but frankly I’m not sure that would have made any difference to stocks. We got a one day selloff last week that felt a lot more like some opportunistic profit taking than the precipice of a Constitutional crisis.
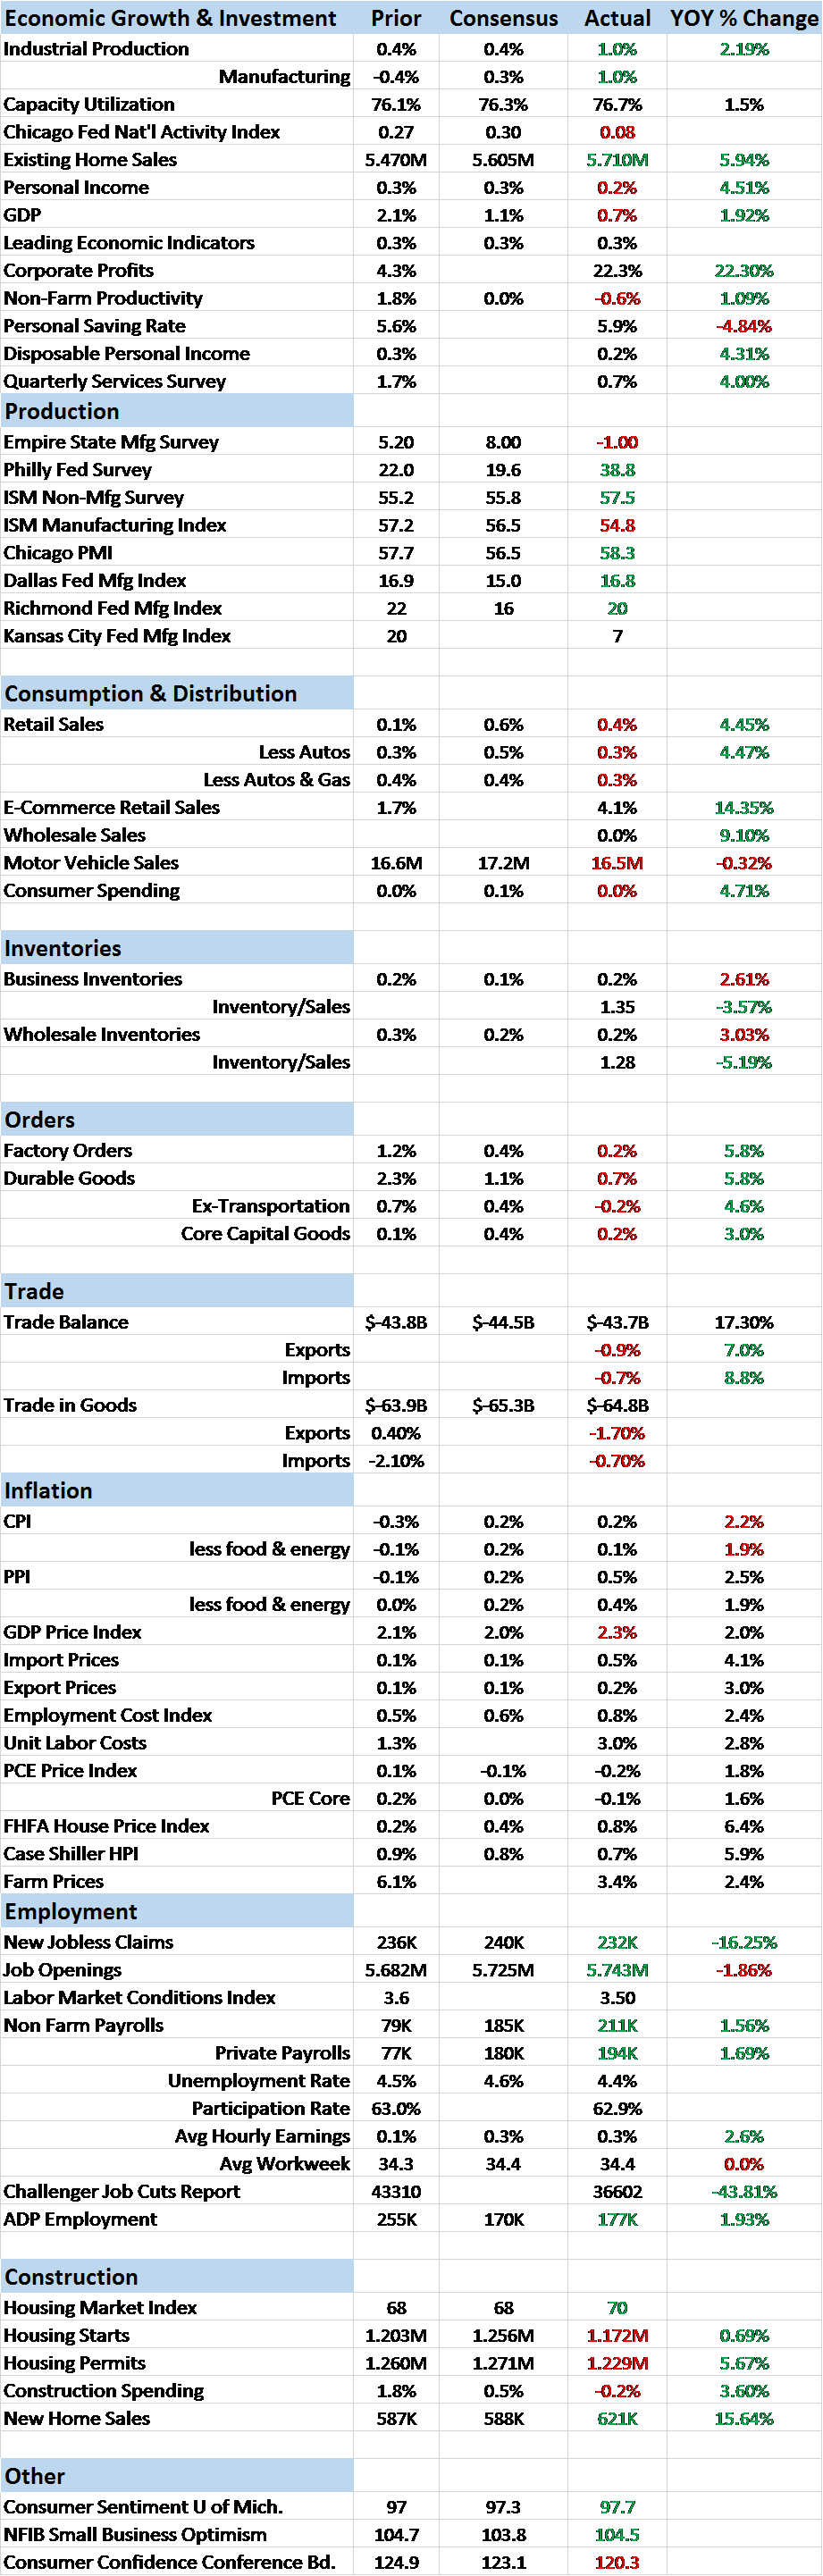
The actual economic data wasn’t all that bad but really just in the same mushy range we’ve been stuck in for several years now. The employment related items continue to look decent but that seems to be coming at the expense of productivity so I’m not sure all that much is being gained. The Labor Market Conditions Index was revised higher and the most recent read was right square in the middle of meh, although that is an improvement from the recent blech. The JOLTS report was also better than expected…and less than a year ago, still trending sideways for almost two years. Unemployment claims continue to scrape new lows though so any angst from jobs seems far away. Retail sales were less than expected but at a year over year rate of about 4.5% aren’t all that bad. Well, not all that bad for this cycle. Prior expansions would have been thought to be in trouble at that rate of growth. Inventories were up a bit but inventory/sales ratios were basically unchanged even with business sales unchanged last month. Auto dealer inventories continue to look worrisome. The regional Fed surveys were schizophrenic with the Empire State survey turning negative while the Philly Fed version zoomed back higher. Industrial production didn’t clarify things much even though it was better than expected. It probably says more that better than expected was also less than September…2007. Lost decade indeed. |
10 - Year Treasury Constant Maturity Minus 2 - Year Constant Maturity, 1994 - 2017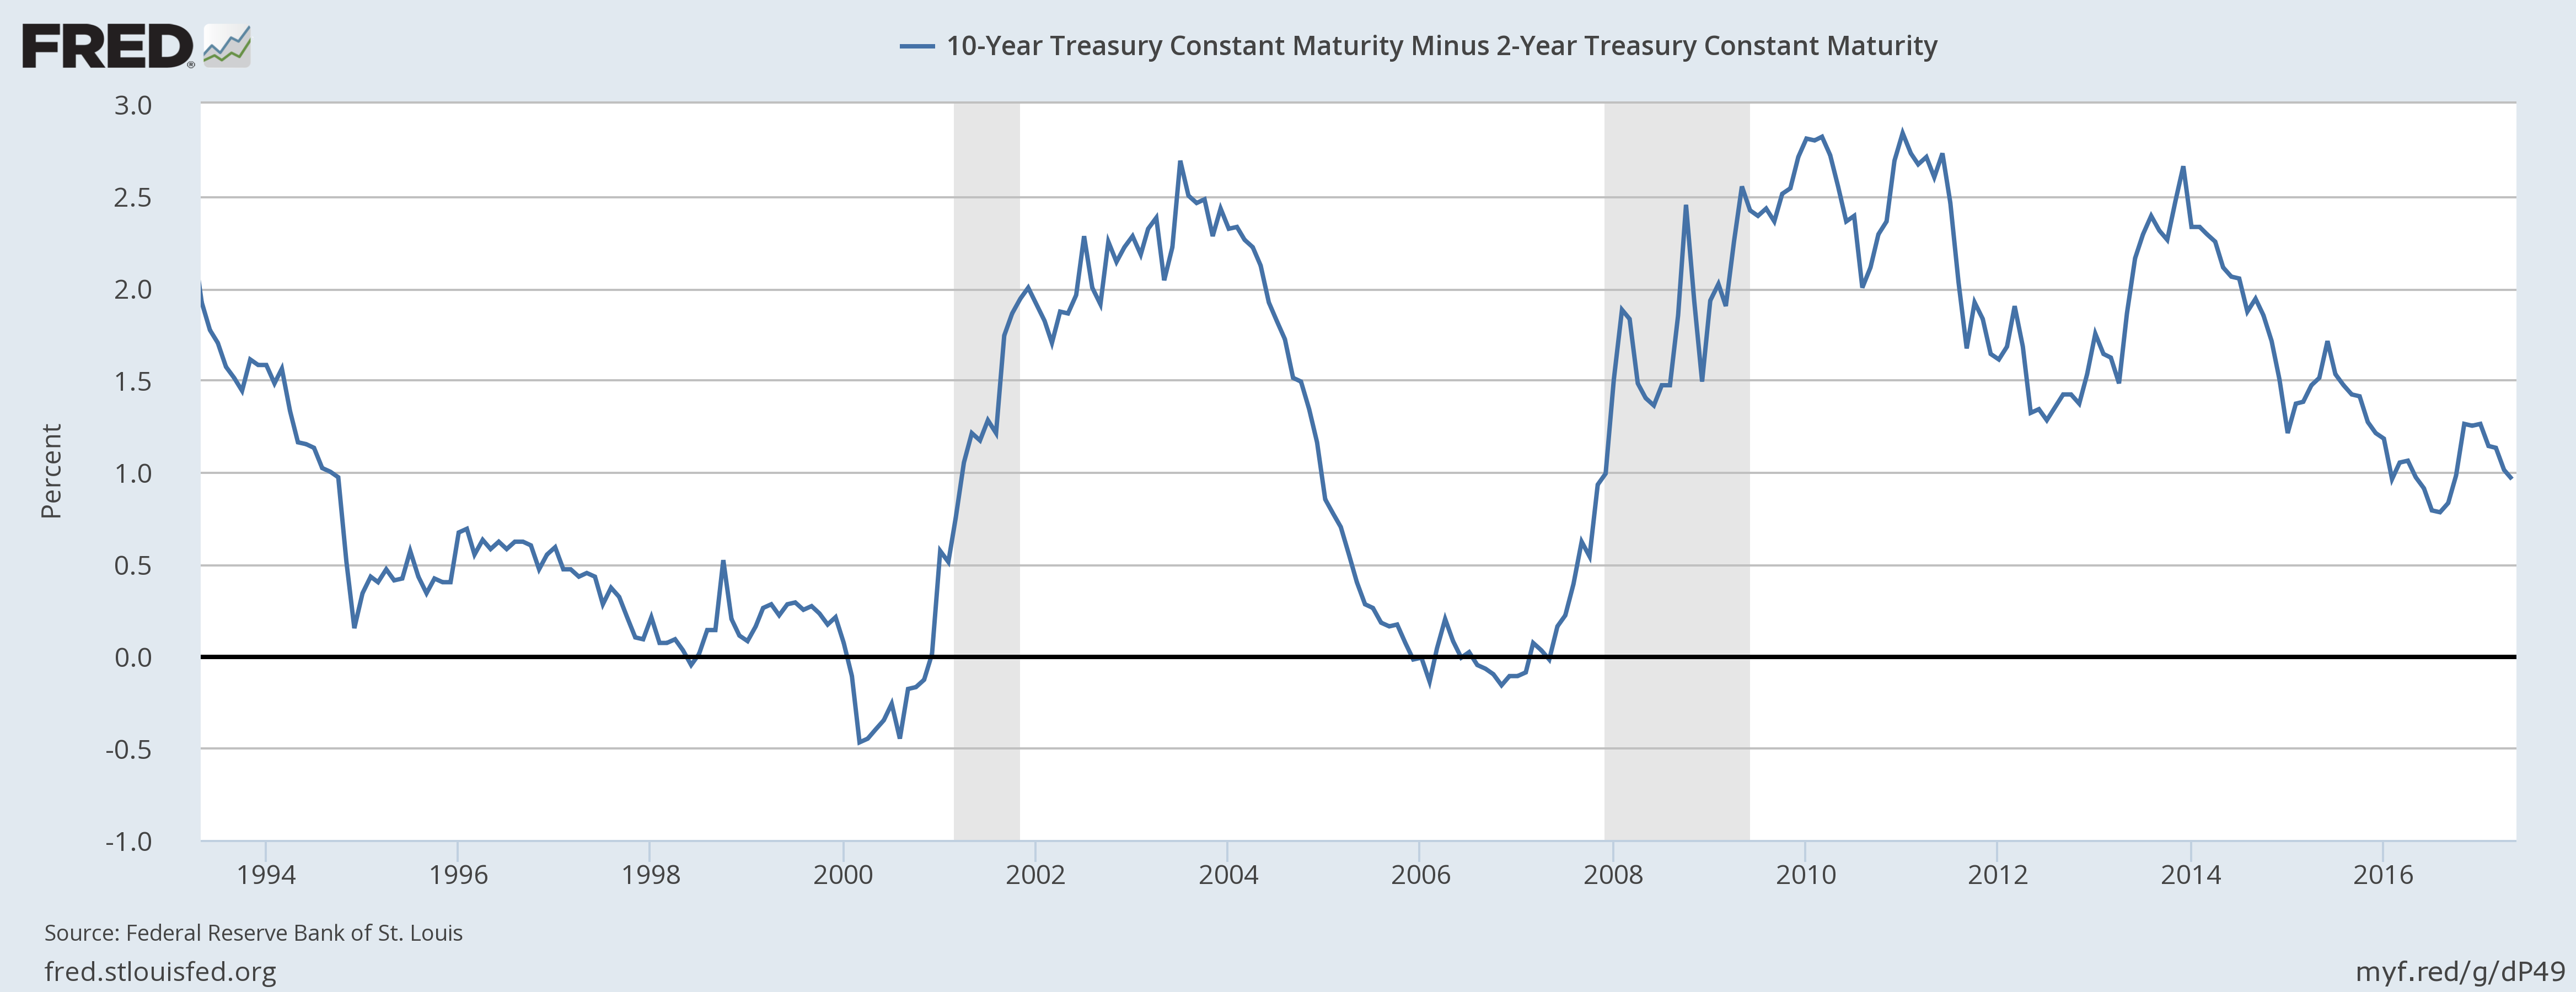 - Click to enlarge |
| The market got a little antsy with a PPI report that came in quite warm as did import and export prices. But a much calmer CPI put the bond market at ease. Market based measures of inflation expectations continue to fall although I am still concerned about the recently weak dollar and what impact that might have on inflation and Fed policy.
The last remaining sturdy leg of our economic stool I discussed in the last update might prove a tad short. Housing starts and permits were both less than expected. The culprit was in the multi-family segment, down 9.2%. MF completions were down 17.2% in what looks like the end of the apartment building boom. SF is picking up though as first time buyers appear to be finally emerging from Mom and Dad’s basement. Markets reflect a waning of growth and inflation expectations over the last two weeks. Whether that is due to Trump’s political troubles or just an acknowledgement of the current situation is hard to say. Likely a bit of both. The yield curve continued its slow march toward recession, flattening by 8 basis points since the last update. The curve continues to reflect mostly falling inflation expectations but the last two weeks also saw real growth expectations fall. 10/2 yield curve: not flat yet but heading inexorably in that direction. Inflation expectations speak for themselves. |
5 - Year Forward Inflation Expectation Rate, January 2004 - May 2017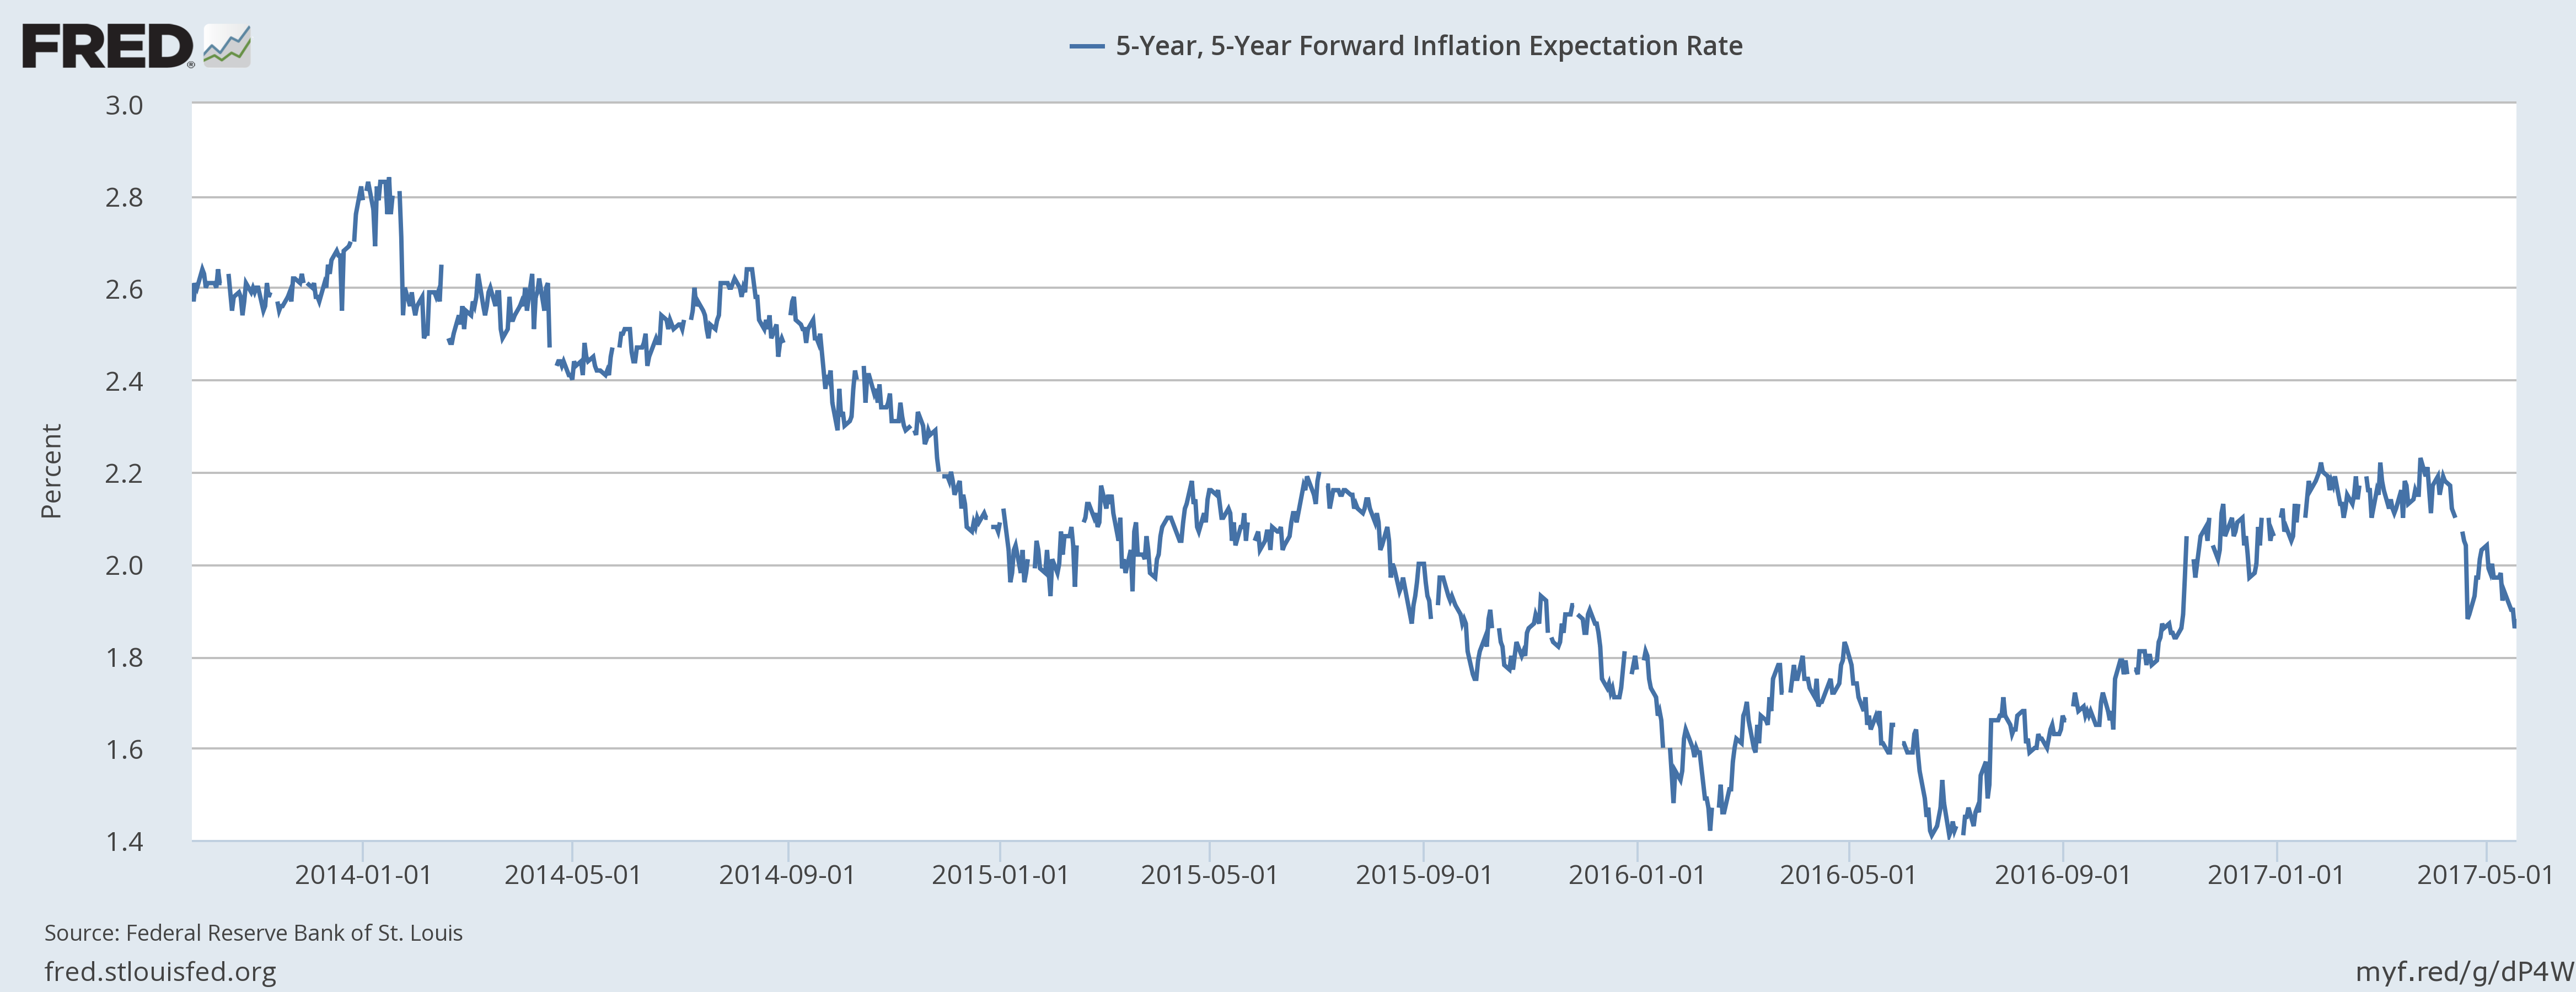 - Click to enlarge |
| The nominal 10 year yield fell 13 basis points over the last two weeks: |
10 - Year Treasury Constant Maturity Rate, January 2003 - May 2017 - Click to enlarge |
| While real yields on the 10 year TIPS fell by 7 basis points: |
10 - Year Treasury Inflation - Indexed Security And Constant Maturity, July 2013 - May 2017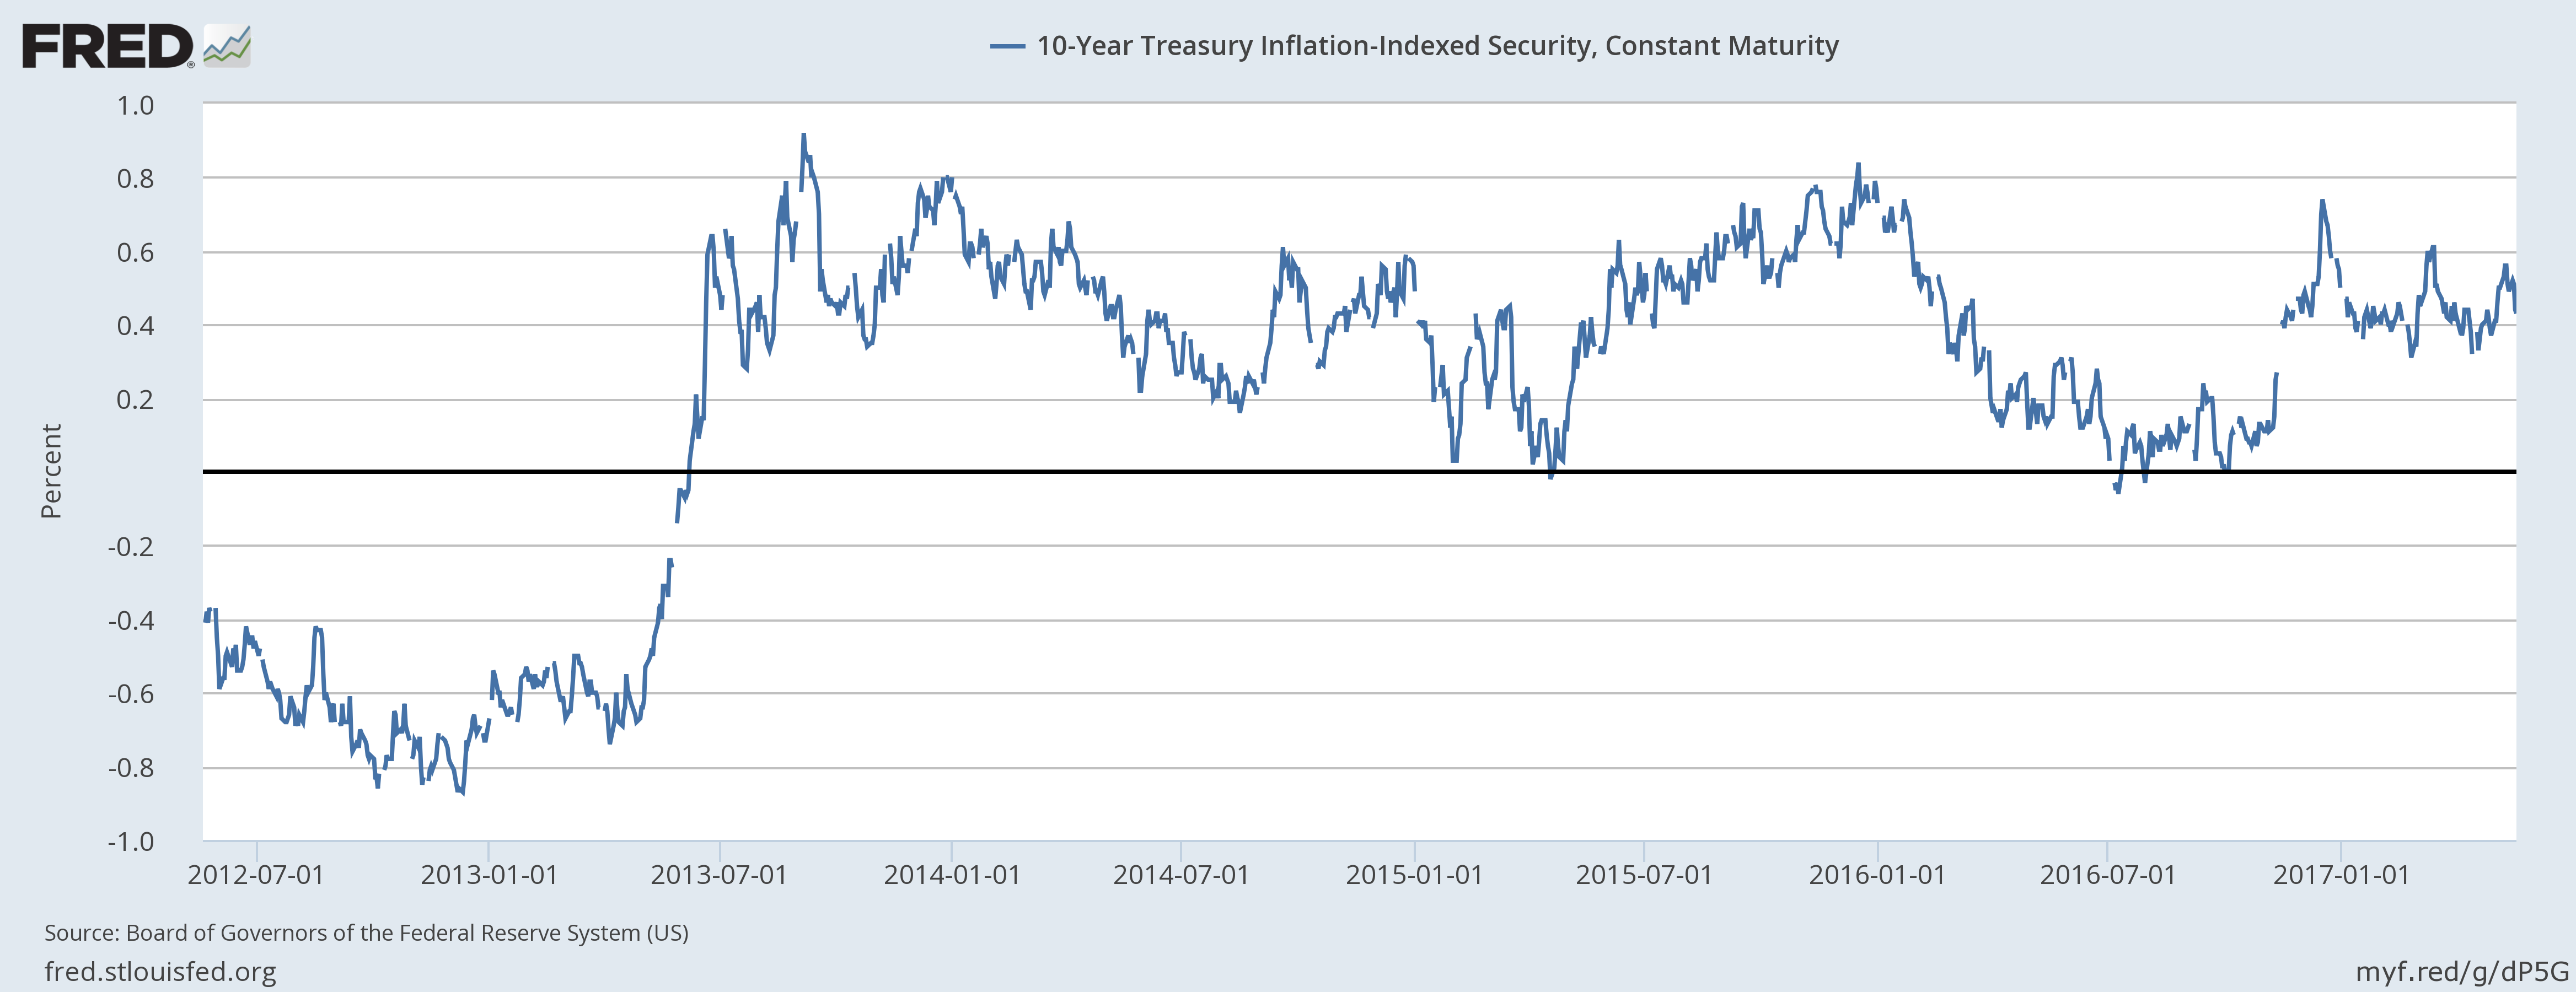 - Click to enlarge |
| So both nominal and real growth expectations fell over the last two weeks. Credit spreads were basically unchanged. There is no stress in credit right now or at least none that has gotten the attention of the market. |
BofA Merrill Lynch US High Yield Option Adjusted Spread, July 2012 - May 2017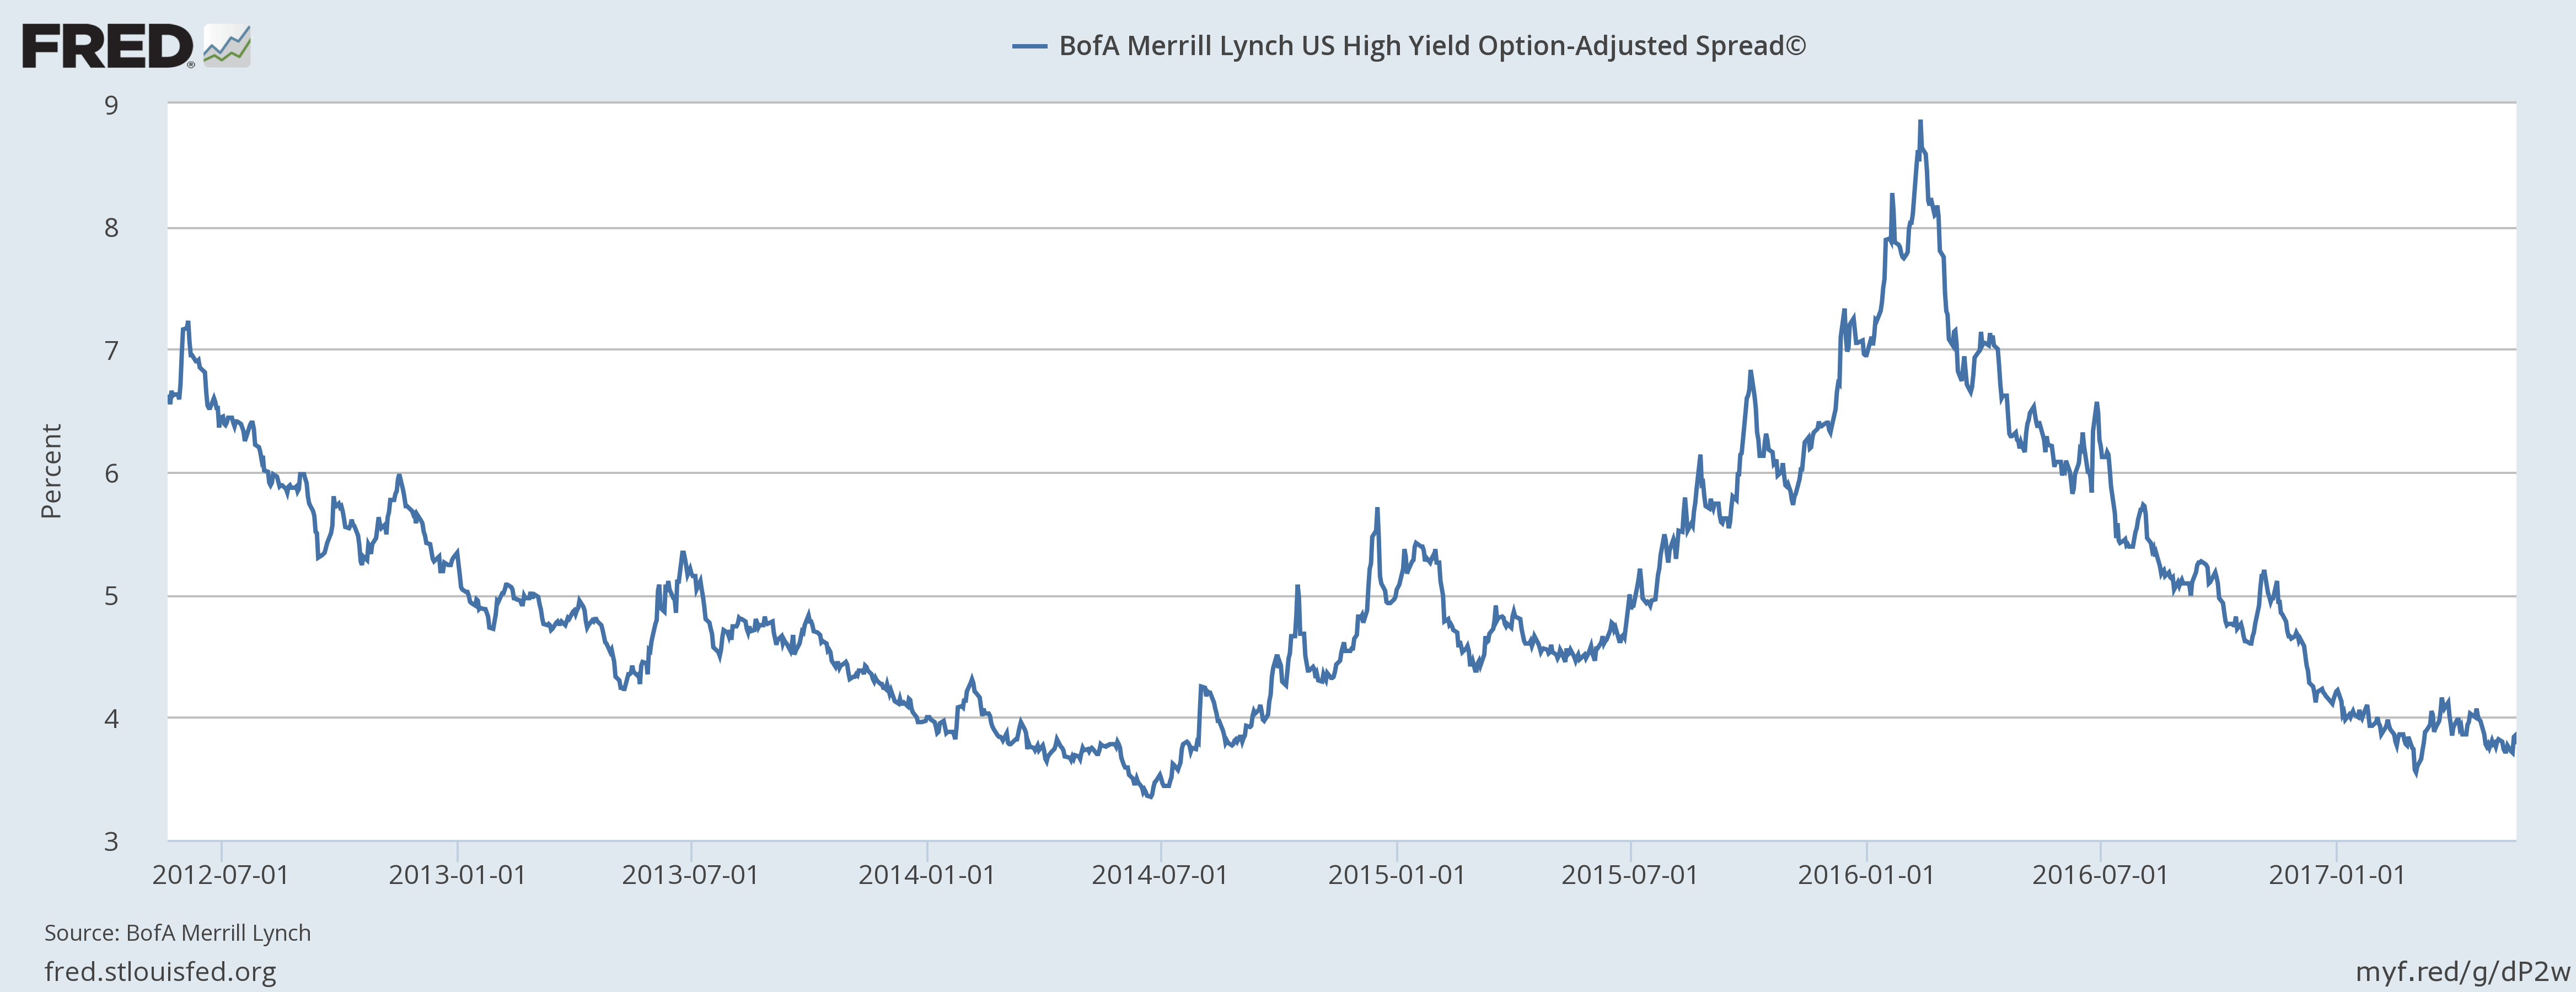 - Click to enlarge |
| Probably the most significant change since the last update was the drop in the dollar. After finally falling through the 99 level I’ve been harping on for months, the index fell in a straight line to the next support at 97. Next downside target, probably after a counter-trend rally, is around 93. Obviously, that has investment implications. |
U.S. Dollar Index, August 2016 - May 2017(see more posts on U.S. Dollar Index, )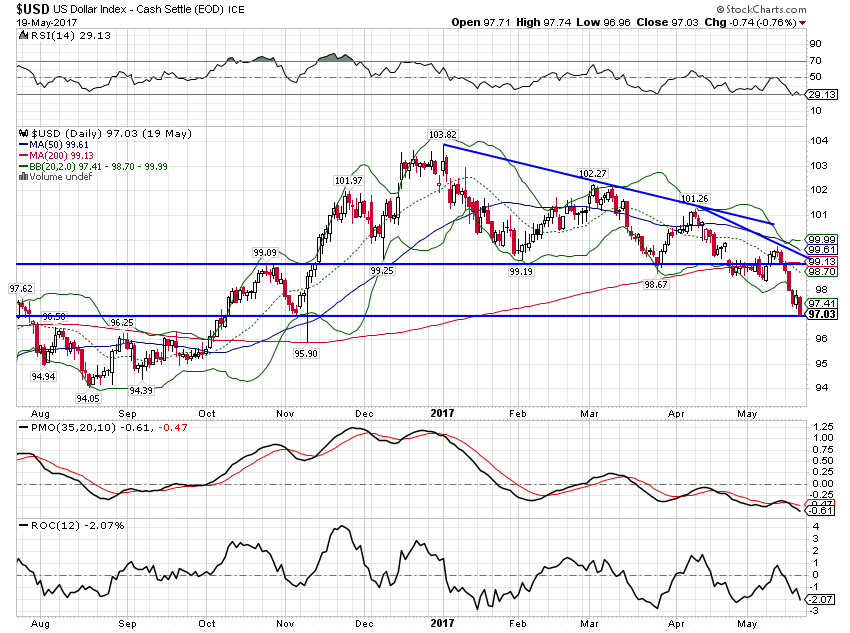 - Click to enlarge |
| Gold rallied as the dollar fell. Considering the rate at which the dollar has fallen though, the move in gold actually seems rather muted. Still a lot of speculative longs in the futures market. |
Gold Continuous Contract, November 2016 - May 2017(see more posts on Gold, )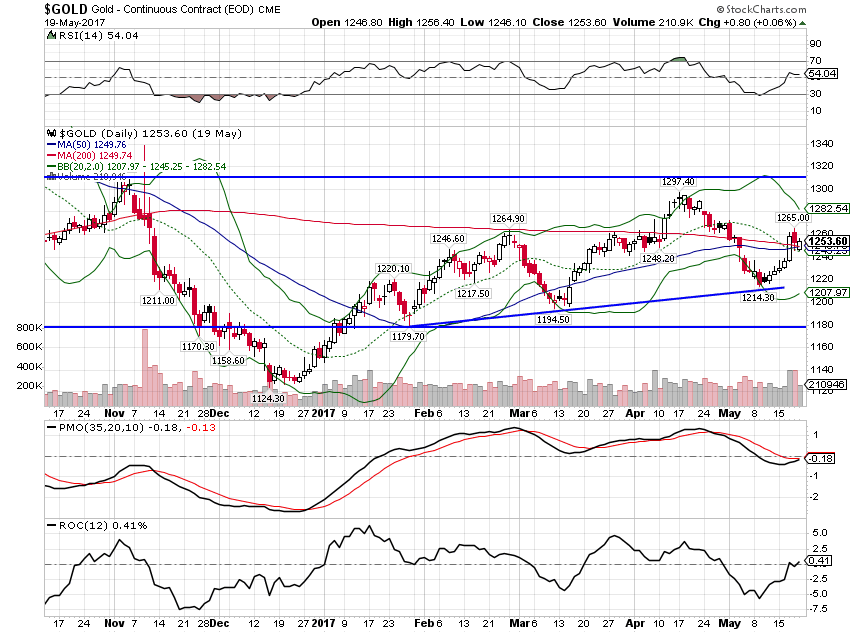 - Click to enlarge |
| Commodities also moved higher as the dollar fell. |
Bloomberg Commodity Index, November 2016 - May 2017(see more posts on Bloomberg Commodity, )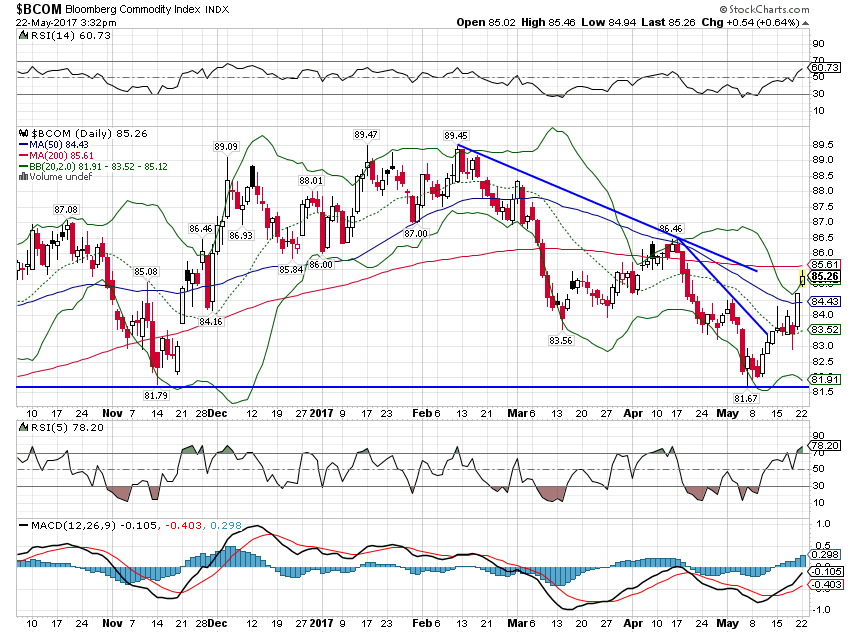 - Click to enlarge |
| I continue to see little change in the overall arc of the US economy. The growth slowdown of the last few years has moderated but we are still stuck in a 2% growth world. Markets clearly don’t expect much change either although stocks do still act quite well. That is mostly a function of improving earnings which is more about better growth outside the US. Europe is in the midst of a cyclical rebound and even Japan reported better than expected real growth last week. But the emphasis in Europe should be on cyclical and Japan real growth was all about continued deflation and no nominal growth.
Emerging market economies are also improving although Brazil’s latest political uproar may put that on hold for a bit. EAFE had already started to outperform EM before Brazil’s latest president got caught with his hand in the cookie jar. But if capital continues to flow into EM funds the Brazil mess may not matter all that much. The slide in the dollar is a negative long term but may act to extend this business cycle even further. Capital flows matter a lot to the emerging world. I have no idea how the political arena will evolve here in the US but so far it hasn’t had much of an impact. Or at least that’s the consensus. If you’ve been reading me for any length of time you know I’m not all that comfortable with consensus ideas. I suspect that the political troubles of the Trump administration are already having an impact although I don’t think it has much to do with Russia. Is the recent slowdown in lending growth tied to the delay in enacting tax reform? Will companies commit to investments when they don’t know their future tax rate or depreciation schedule? Will companies invest if US growth isn’t expected to accelerate? Whatever is causing it, the demand for C&I loans is dropping. History says that should be of concern. |
Commercial And Industrial Loans, 1950 - 2017 - Click to enlarge |
| Banks are reporting waning demand for loans: For now, all I can say is that growth and inflation expectations are falling. Some of that is probably due to the political turmoil but most of it is just an acknowledgment of reality. No matter |
Net Percentage Of Domestic Banks Reporting Stronger Demand For Commercial And Industrial Loans From Large And Middle - Market Firms, 1992 - 2017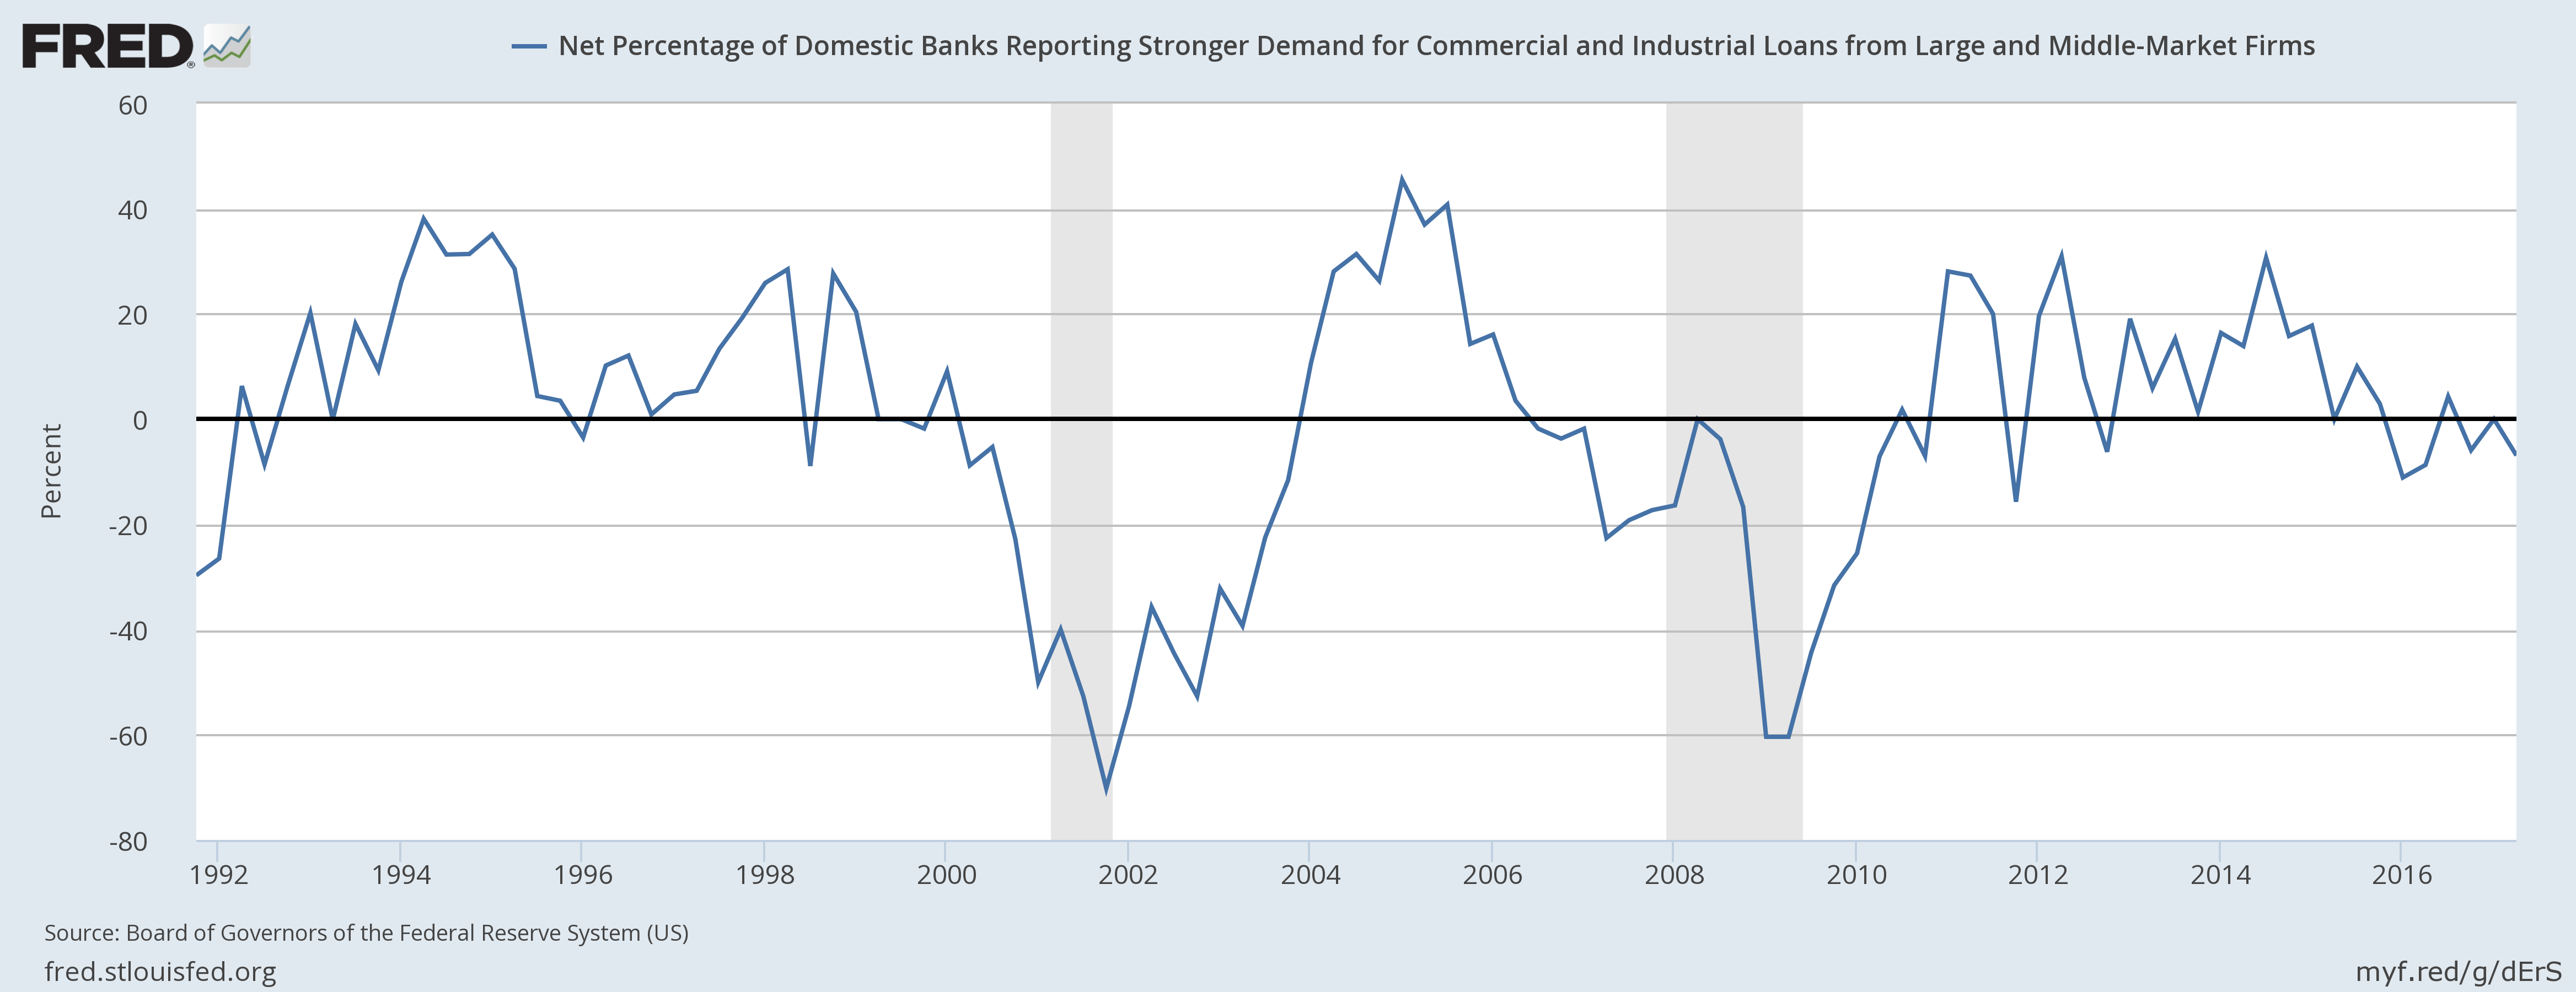 - Click to enlarge |
Tags: Alhambra Research,Bi-Weekly Economic Review,Bloomberg Commodity,Bonds,commodities,credit spreads,currencies,economic growth,economy,employment,Gold,Housing,inflation,inflation expectations,Investing,Markets,newslettersent,Politics,Retail sales,stocks,Taxes/Fiscal Policy,TIPS,U.S. Dollar Index,Unemployment,US dollar,Yield Curve