Jeffrey P. Snider
My articles My offerMy siteAbout meMy videosMy books
Follow on:LinkedINTwitterSeeking Alpha
| According to the headline TIC statistics, foreign central banks have in the past six months sold the fewest UST’s since the 6-month period ended November 2015. That may indicate an easing of “dollar” pressure in the private markets due to “reflation” sentiment. They are, however, still selling. In February 2017, the latest month available, the foreign official sector disposed of another $10.7 billion (net) after -$44.9 billion in January. The difference this year versus last year is that in 2016 the incidences of heavy “selling” were relentless whereas in 2017 it has been irregular. |
US TIC Official Buying Of US Treasury Bonds And Notes, February 2013 - February 2017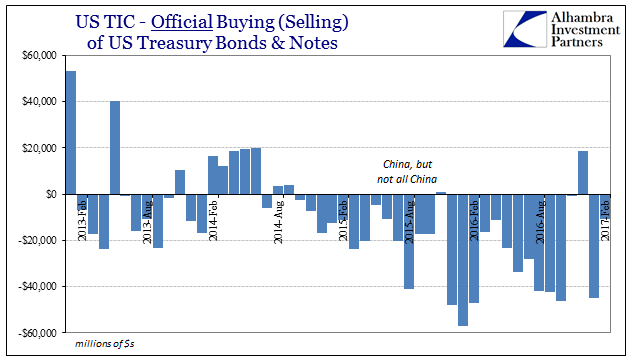 - Click to enlarge |
| Including the private sector, overall there is the opposite indicated, though the negative 6-month total is due primarily to the “dollar” warning (broad “selling”) in September 2016. The aggregate net total in February remained negative including both private as well as official activity, suggesting that marginal changes in systemic availability are small and of the same general circumstances rather than representing a wholesale inflection (to rising capacity). |
US TIC Cumulative Change Official Holdings Of US Treasure Bonds And Notes, February 1996 - February 2017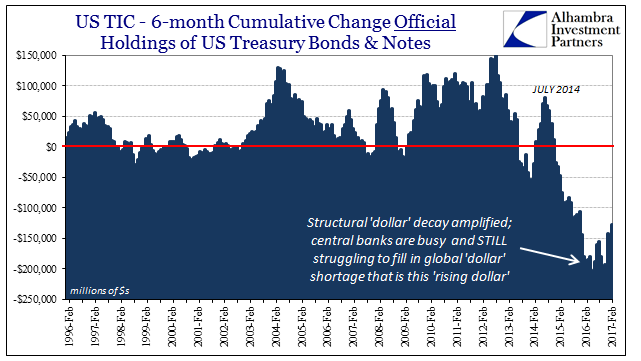 - Click to enlarge |
| There does seem to be a different pattern emerging in bank liabilities, though in its third quarter of such a state the implications are unclear (as are the motivations). The month of February, which had been as a middle month each quarter one for subtraction, was positive again for the second straight. That may be “reflation”, too, as the middle month of those last two quarters have hinted at behavior perhaps like the period before the “rising dollar.” |
US TIC Cumulative Change Holdings Of US Dollar Assests, February 1996 - February 2017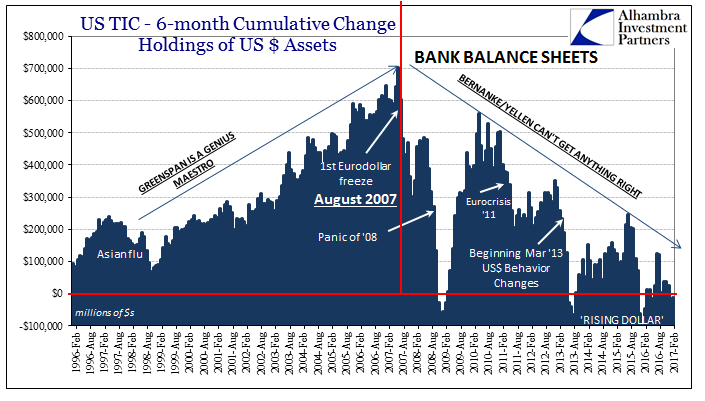 - Click to enlarge |
| It is impossible to say for sure based on the middle month alone, as it is the ending month every quarter that determines the overall “dollar” measurement or at least our imperfect inference of capacity in bank liabilities. |
US TIC Monthly Change Bank's Own Dollar Liabilities, January 2012 - January 2017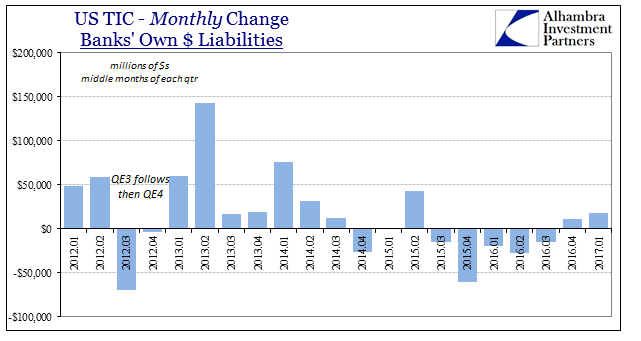 - Click to enlarge |
| As discussed earlier today, the primary focus for “dollars” in total continues to be Asia, meaning Japan. The TIC breakdown for that country continued to support the direction of the rising rather than falling yen. The Bank of Japan either together with or in parallel to Japanese banks dispose of UST assets seemingly to keep the yen lower against the dollar (going back to the end of 2014, which in Japanese terms has been a “falling dollar”), meaning that in the world of FX they are being forced to accommodate at some great expense of “dollar” resources in order for the yen to continue on in, or just near, the “right” direction. As the yen rises, as it did throughout much of 2016, Japanese dollar assets rise with it (path of least resistance?). |
US TIC Monthly Change Bank's Own Dollar Liabilities, January 2012 - January 2017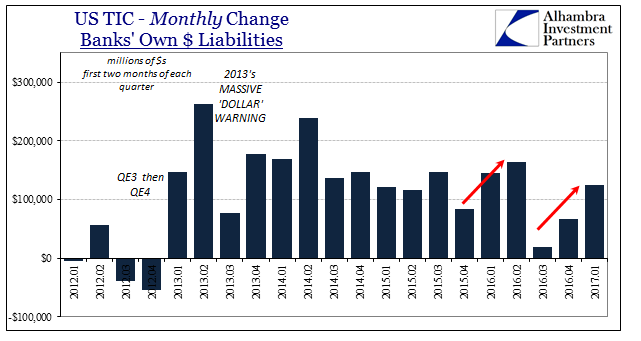 - Click to enlarge |
| The other side of this Japan “dollar” scenario is surely China, for the Chinese have to get their “dollars” from somewhere and it isn’t directly from US banks. In terms of TIC, Chinese holdings have been holding steady since October. The figures for Belgium, though, do show some decline, and given that Belgium is the location of Euroclear it does propose the possibility of more opaque “dollar” means these past few most stable currency months. |
US TIC Holdings OF UST, February 2013 - February 2017 - Click to enlarge |
| It all suggests “reflation” as it has been rather than what everyone really wants. I mean by that things are improved only in the narrowest sense of the word; the “dollar” system in early 2017 isn’t actively getting worse like it was to start 2016. The lack of further damage doesn’t introduce the opposite direction, which appears to be the standard expectation. Instead, all it really suggests is that the “rising dollar” is at a pause, or maybe even has ended. But if it has ended, that still amounts in all likelihood to a pause just waiting in limbo for whatever catalyst to kick off the “next” one (whatever form that might take). |
Two Sides Reflation, January 2014 - February 2017 - Click to enlarge |
| The TIC data for Switzerland might be the perfect example of all this, an important jurisdiction for the Swiss position in the eurodollar system as well as the role of the Swiss National Bank toward the beginning of the “rising dollar.” |
TIC US Banking Data, February 2013 - February 2017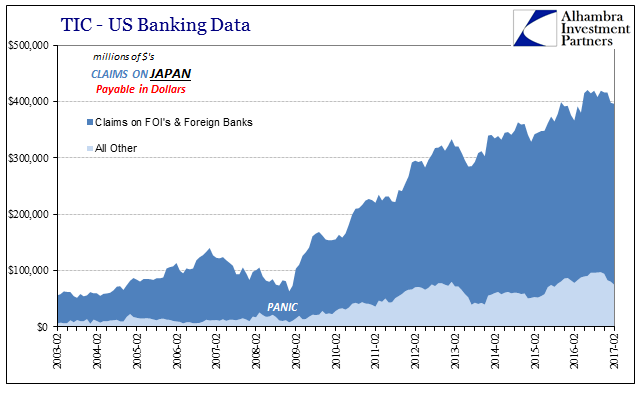 - Click to enlarge |
| The breakup of the franc’s peg to the euro was deeply destabilizing particularly in FX, with that central bank having been gravely affected by the “rising dollar” first. |
US TIC Holdings Of UST, February 2012 - February 2017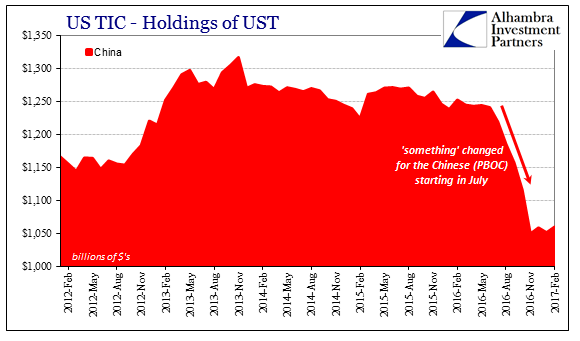 - Click to enlarge |
| Since early 2016, Swiss holdings of UST’s have been sideways rather than unwinding – pause rather than recovery; “reflation” instead of reflation. The indicated global “dollar shortage” is still a shortage, just not more of one this year versus last year. This is not unusual, as it describes the whole history of the eurodollar system dating back to 2007; vacillating between active decay and unenthusiastic rebound. |
US TIC Holdings Of UST, February 2013 - February 2017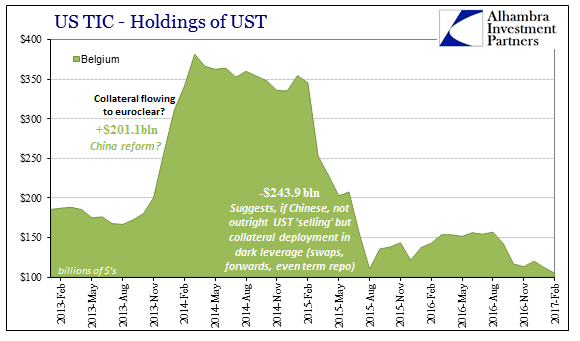 - Click to enlarge |
| The primary difference this time, as reflected in the behavior of funding and yield curves, for example, is that the rebound or “reflation” has been as lethargic as all the TIC data in its relative improvement. |
US TIC Holdings Of UST, February 2013 - February 2017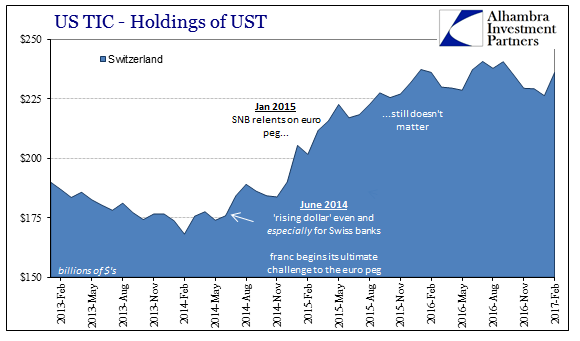 - Click to enlarge |
Jeffrey P. Snider is the head of Global Investment Research of Alhambra Investment Partners (AIP). Jeffrey was 12 years at Atlantic Capital Management where he anticipated the financial crisis with critical research. His company is a global investment adviser, hence potential Swiss clients should not hesitate to contact AIP
Tags: $CNY,$JPY,China,currencies,dollar,dollar shortage,economy,EuroDollar,eurodollar standard,Federal Reserve/Monetary Policy,Japan,Markets,newslettersent,rising dollar,Switzerland,tic,U.S. Treasuries,Yen