Jeffrey P. Snider
My articles My offerMy siteAbout meMy videosMy books
Follow on:LinkedINTwitterSeeking Alpha
| First quarter GDP in China rose 6.9%, better than expected and above the government’s target (6.5%) for 2017. It stands to reason, however, that if Communist officials thought they could get 6.9% to last for the whole year they would have made it their target, especially since 6.5% would be less than the GDP growth rate for 2016 (6.7%). In only that one way is China’s GDP statistic meaningful. Due to unanswered questions about its accuracy, it barely rates any mention at all.
The problems with China GDP appear to be spreading to other statistics, particularly Industrial Production. IP had been almost perfectly stable exhibiting, like GDP, very little variation. Prior to this latest update, it was steady between 6% and 6.3% for eleven months in a row, and going back to the start of 2015 only twice did it vary so much on the high side (6.8% in both June 2015 and March 2016). It seems quite reasonable that given global conditions particularly for manufacturing and then the trade of goods during that period China was overstating its industrial production to like GDP make a bad situation appear to be at least somewhat more balanced than it might have been (to be clear, this is speculation on my part as there is no evidence there is any directive for IP). |
China Industrial Production 2009-2017(see more posts on China Industrial Production, )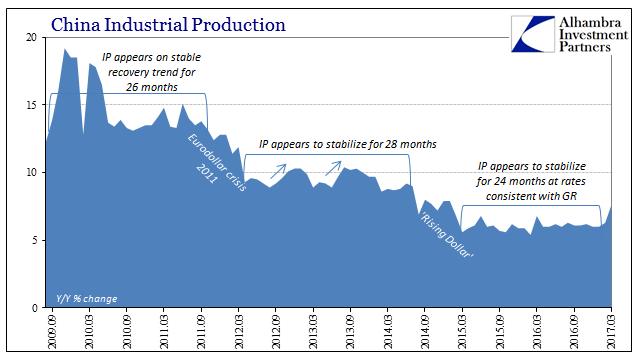 - Click to enlarge |
| Therefore, the IP figure for March 2017 of 7.6% clearly stands out not just for being the highest growth rate since January 2015 but because it seems to relate to other statistics like export growth. Judging by Chinese exports, industrial production by early 2016 might have been as low as 3%, perhaps even 2%. The acceleration in the IP rate for March 2017 is then the correlation to exports which in Q1 2017 were positive for the first time (on a quarterly basis) in several years. |
Chinese Industry 2010-2017(see more posts on China Exports, China Industrial Production, )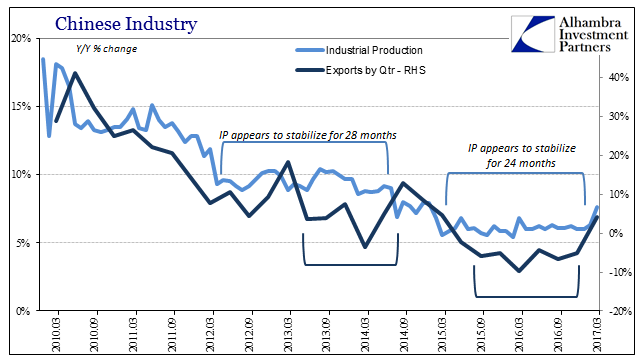 - Click to enlarge |
As I wrote last month:
Sure enough, as exports turn positive IP might have been “allowed” to at last turn upward with them. The problem, then, is if export growth isn’t actually sustained beyond base effects or the temporary basis for sentiment or whatever else. As above-target GDP, in all likelihood this burst of activity will prove to be an aberration. That was the case the last time Chinese IP was above 6.5%, in March 2016, when in the same month Chinese exports suddenly grew by 11.2% rather than contract as in all the other months around that time. The rest of the Big 3 economic statistics were more of the same. Retail sales grew by 10.9% in March after rising by just 9.5% in the combined January-February period. That only sounds like appreciable improvement because the latter estimate was the lowest in well over a decade. Instead 10.9% is right about average for retail sales going back to the last slowdown in the summer of 2014. |
China Retail Sales 1999-2017(see more posts on China Retail Sales, ) - Click to enlarge |
| The government continues to “stimulate” through the capital expenditures of State-owned Enterprises. Though nowhere near as heavy as the beginning of 2016, FAI through this official channel continues to grow at a double digit percentage rate. The accumulated growth rate was 13.6% for SOE’s for the first three months of 2017, and 13% year-over-year in March. Private FAI ticked up to 7.7% on an accumulated basis, 8.6% year-over-year.
Total FAI was 9.2% on an accumulated basis, meaning vital productive investment has increased by less than 10% for the past 11 months. For all the “stimulus” of last year and what might be continued this year, fixed asset investment remains subdued, including the clear improvement in private sector activity. Three years ago, at the outset of the “rising dollar”, FAI overall was growing by 17% with 20% growth on the private side – and those rates were down already quite significantly from the year before which was nearer the well-established historical baseline. The accumulated growth rate for 2017 so far is actually less than in first three months of 2016. From a more optimistic perspective, it would seem that China’s economy has weathered the storm of the “rising dollar” and at least stabilized without more immediate downside danger. The textbook, orthodox approach attributes that position to the success of “stimulus” both monetary and fiscal. |
China Fixed Asset Investment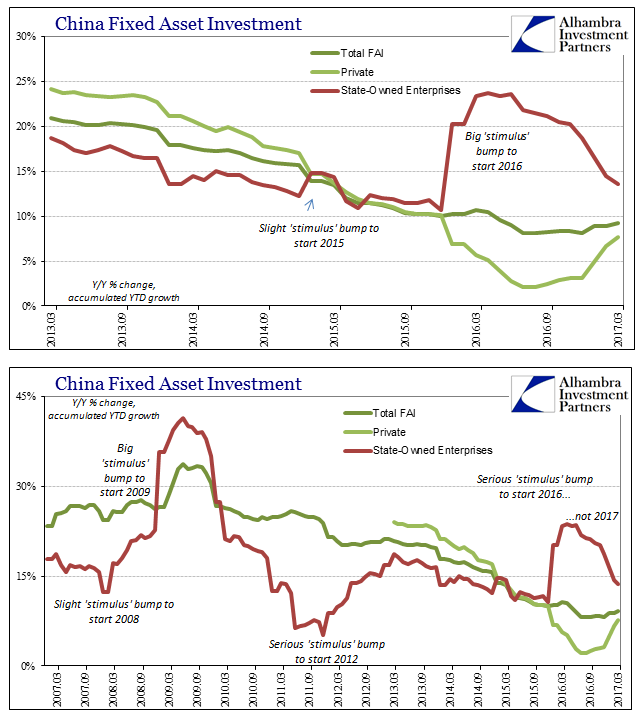 - Click to enlarge |
A “dollar” perspective might differently look at these same statistics and suspect nothing more than a repeat of 2013-14, only at a lower landing. With global monetary decay in a pause so to speak, China’s economy was like the global economy afforded a reprieve from further erosion and/or attrition which is not at all the same as resurrected growth prospects. I wrote earlier today (subscription required) from that orientation:
That was certainly the case several other times over the past several years. Chinese industrial production slowed to 8.9% growth in August 2012, for example, only to then accelerate as far as 10.3% at the end of that year and still it meant little or nothing for China (or the global economy) overall (and it was also attributed to the “success” of “stimulus”). Chinese IP at 7.6% only seems to be a step forward because the 10% growth of 2012-13 seems like so long ago, and the 15% growth of 2011 and before an entirely different world. Thus, the only way 7.6% growth in IP can actually indicate something meaningfully positive is if it is but the first step in that direction, a trend for acceleration that becomes durable and sustainable. Given the rest of China’s economic statistics that still fail to show symmetry, including how IP might have been artificially held up for almost two years, it seems unlikely that is the case. |
Eurodollar Futures June 2020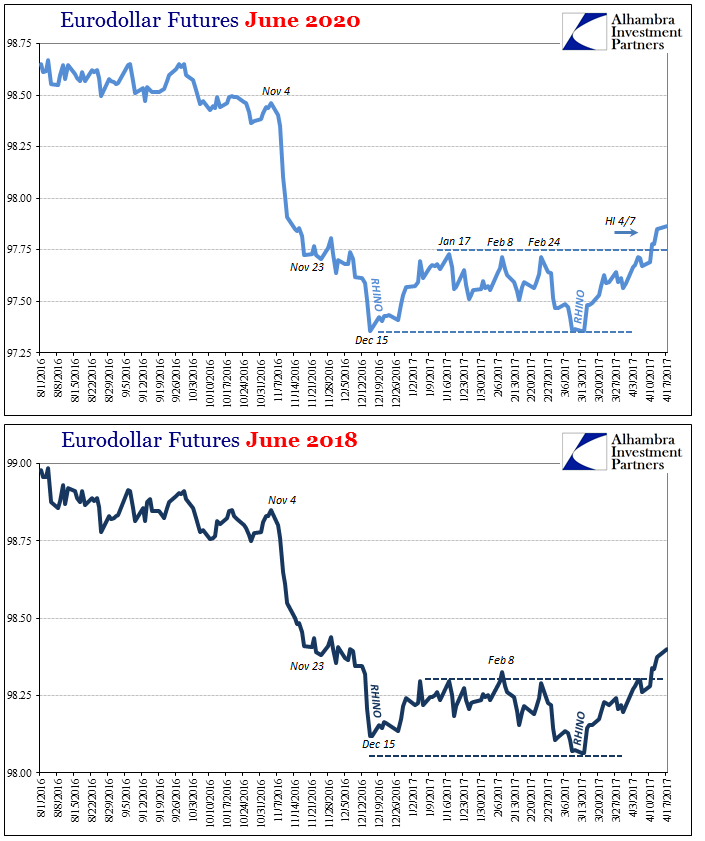 - Click to enlarge |
Tags: China,China Exports,China Industrial Production,China Retail Sales,consumer spending,currencies,depression,dollar,economy,EuroDollar,eurodollar standard,Federal Reserve/Monetary Policy,fixed asset investment,GDP,industrial production,Markets,newslettersent,PBOC,rebalancing,Retail sales