Joseph Y. Calhoun
My articles My siteAbout meMy videosMy books
Follow on:LinkedINTwitterSeeking AlphaAmazon
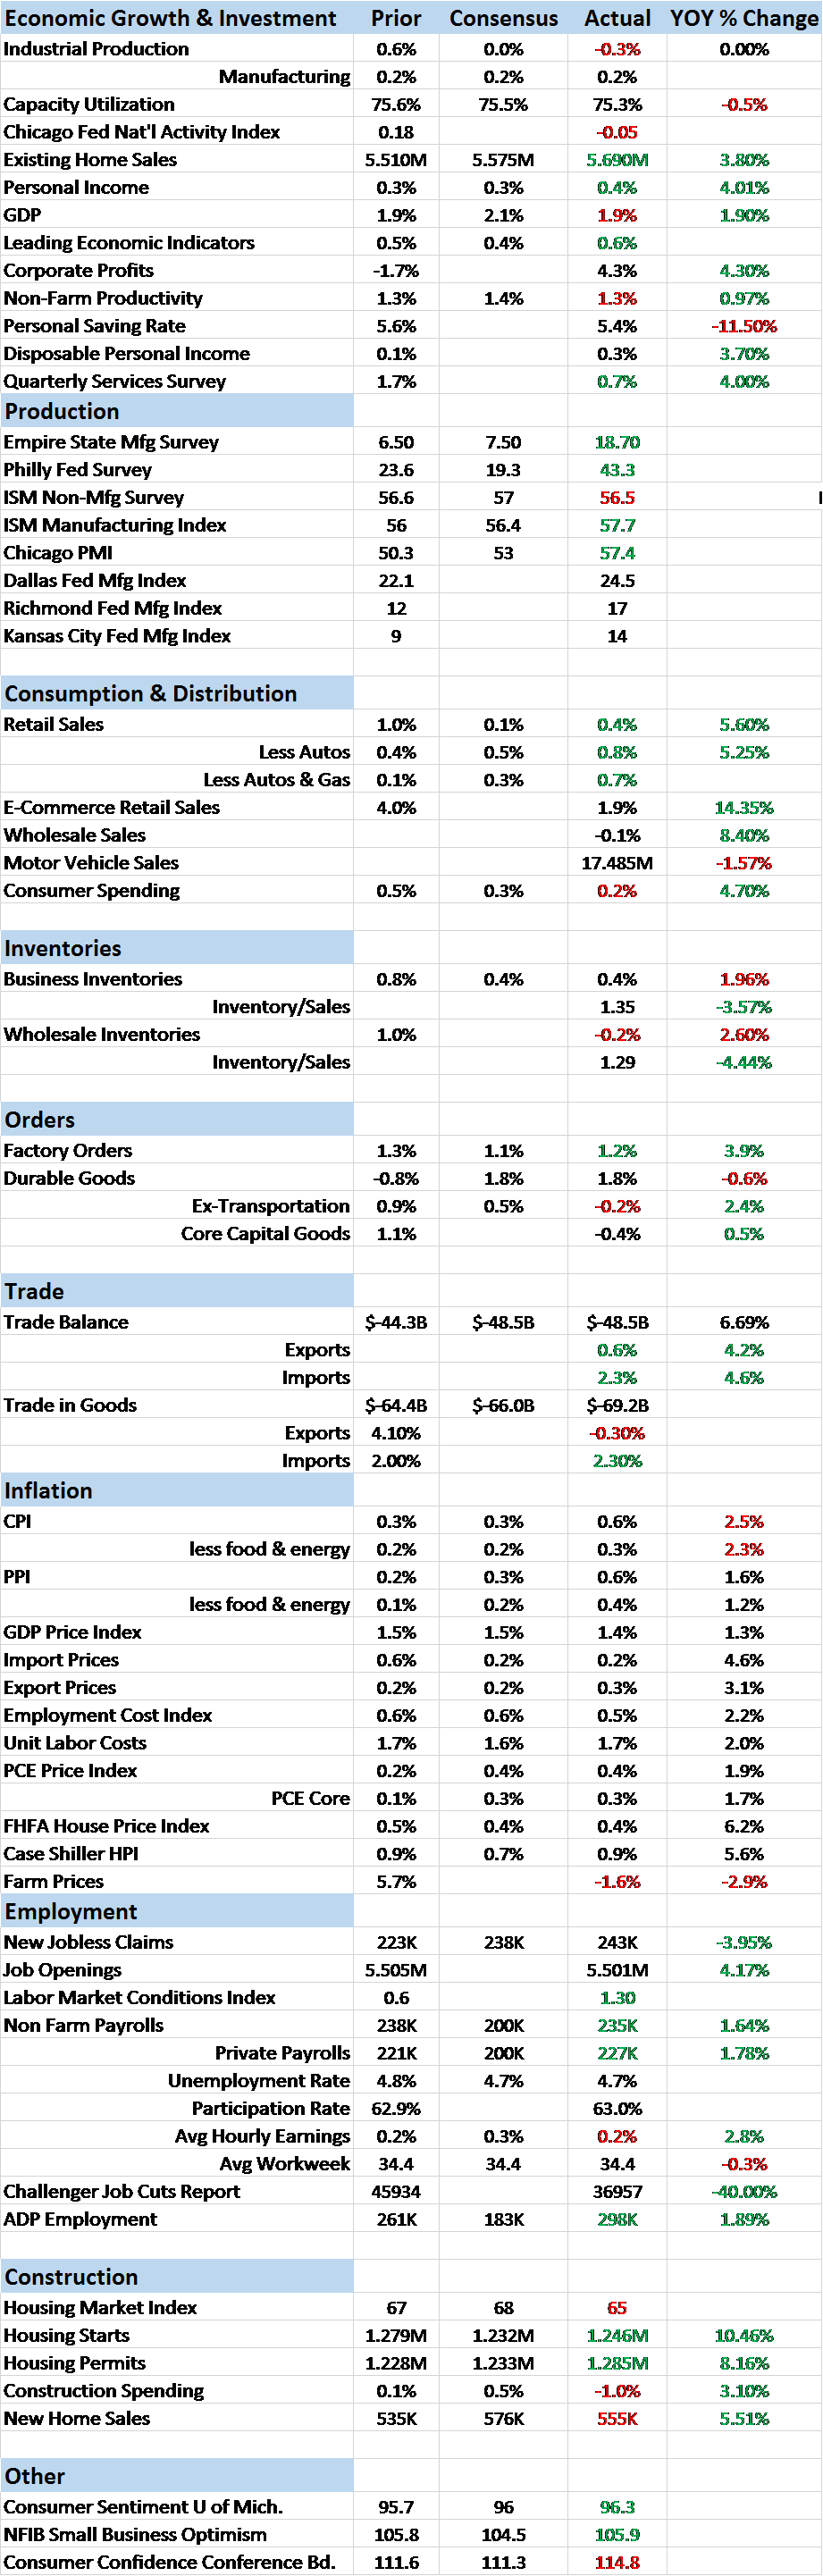
Economic Reports Scorecard
The Federal Reserve is widely expected to raise interest rates again at their meeting next week. They obviously view the recent cyclical upturn as being durable and the inflation data as pointing to the need for higher rates. Our market based indicators agree somewhat but nominal and real interest rates are still below their mid-December peaks so I don’t think a lot has changed. More interesting will be how the markets react after the Fed does what everyone expects it to do. I suspect we will soon be hearing – again – about the conundrum of long term interest rates.
The economic data in any case hasn’t really been all that strong. Yes, the first derivative does seem to have turned higher but the incline is still pretty gradual. The jobs report is a good example, where the monthly average has moved up since the election but is still well within the range we’ve seen this entire expansion. President Trump and his supporters have been quick to take credit – I’m pretty sure Joe Kernen fainted on CNBC when the number was announced Friday – but there may be less there than meets the eye. As many others pointed out, February was unusually warm – 7 degrees above average – which probably means there are some seasonal adjustment issues with the headline number. I seriously doubt the economy produced anywhere near 58,000 construction jobs last month.
The election may be having an impact too but probably not in the way the President thinks. It is quite possible – I think likely – that some hiring was put on hold in the run up to the election. With so many pundits talking about crashes and other disasters if candidate Trump somehow turned into President Trump, I can certainly see how that might make companies a little gun shy in their hiring. Or maybe the hiring slowdown we saw last year was concern about Mrs. Clinton getting elected. Take your pick but the point is made; election uncertainty probably had some impact on hiring last year. The last few months of better than expected hiring may well just be catch up. That is, of course, conjecture on my part but we’ll know the answer soon enough.
As I said, the data has been better but certainly nothing that indicates a surge in growth. Interestingly, as all this “strong” economic data has been coming in, the Atlanta Fed’s GDPNow real time forecast for Q1 GDP has fallen from over 3% at the end of January to 1.2% today. The last two weeks, as the Fed has been preparing the market for another rate hike, the forecast was cut in half. Data dependent? I suppose but in this case I think what that means is that the data is good enough to provide cover for a rate hike the Fed desperately wants so they accumulate some ammunition before the next downturn. If that sounds crazy to you – we’re hiking rates so we’ll have room to cut them in the future – you aren’t alone.
There has been some decent data such as the employment report but there have also been some pretty negative ones as well. Durable goods orders seemed okay – up 1.8% – until you dug in and discovered that ex-aircraft had an entirely different sign, -0.2%. And year over year, even the headline was negative at -0.6%. The report also showed a drop in core capital goods orders which had been on a three month roll of positive numbers. Investment has been the missing ingredient for almost this entire expansion and it doesn’t appear ready to change.
The income and spending report was also a bit disappointing. Income rose a better than expected 0.4% on the month and over 4% year over year. That’s a decent growth rate and certainly welcome. But the spending side was less impressive, up only 0.2% and negative after you subtract the 0.4% PCE inflation rate. Construction spending also came in less than expected, down 1%, although that was entirely due to weakness in public spending. I do wonder if local and state projects are being put on hold in anticipation of some federal dollars from the much discussed infrastructure spending plan. If so, I wouldn’t expect that to change anytime soon.
| Interest rates have moved up since my last update but like the economic data, markets – other than stocks – are not pointing to a surge in growth. That may change if the 10 year breaks out above the 2.62% level reached in mid-December but it hasn’t yet. Resistance after that would not become apparent until around 3%. I’m a bit skeptical though since the market is still overwhelmingly short bonds but we’ll see how it goes after the Fed meeting next week. |
10 Year Treasury Yield Index, Aug 2016 - Mar 2017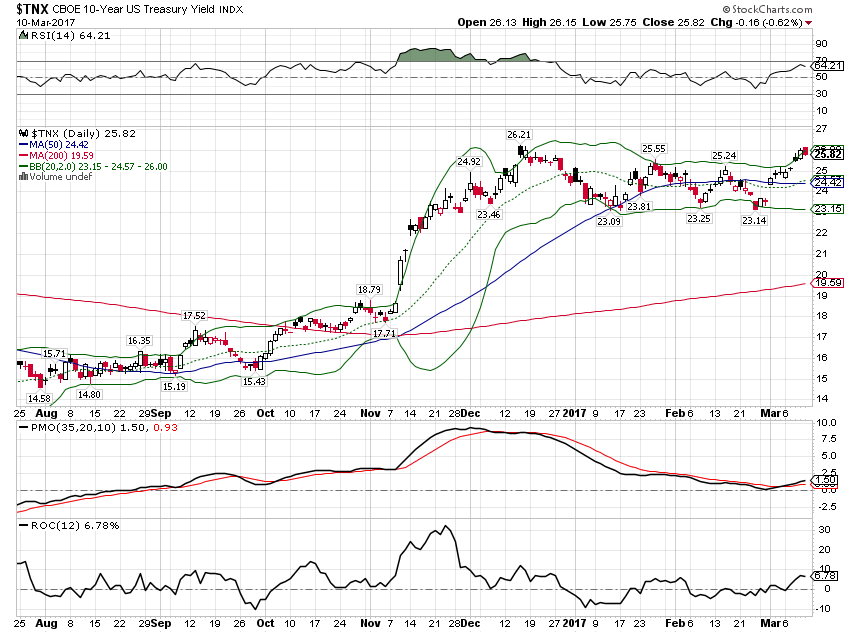 - Click to enlarge |
| 10 Year TIPS yields also moved higher over the last two weeks but as you can see below are still well within the recent range. Real 10 year yields at 60 basis points are not pointing to a boom of any kind. |
10 Year Treasury Inflation, Jul 2012 - Jan 2017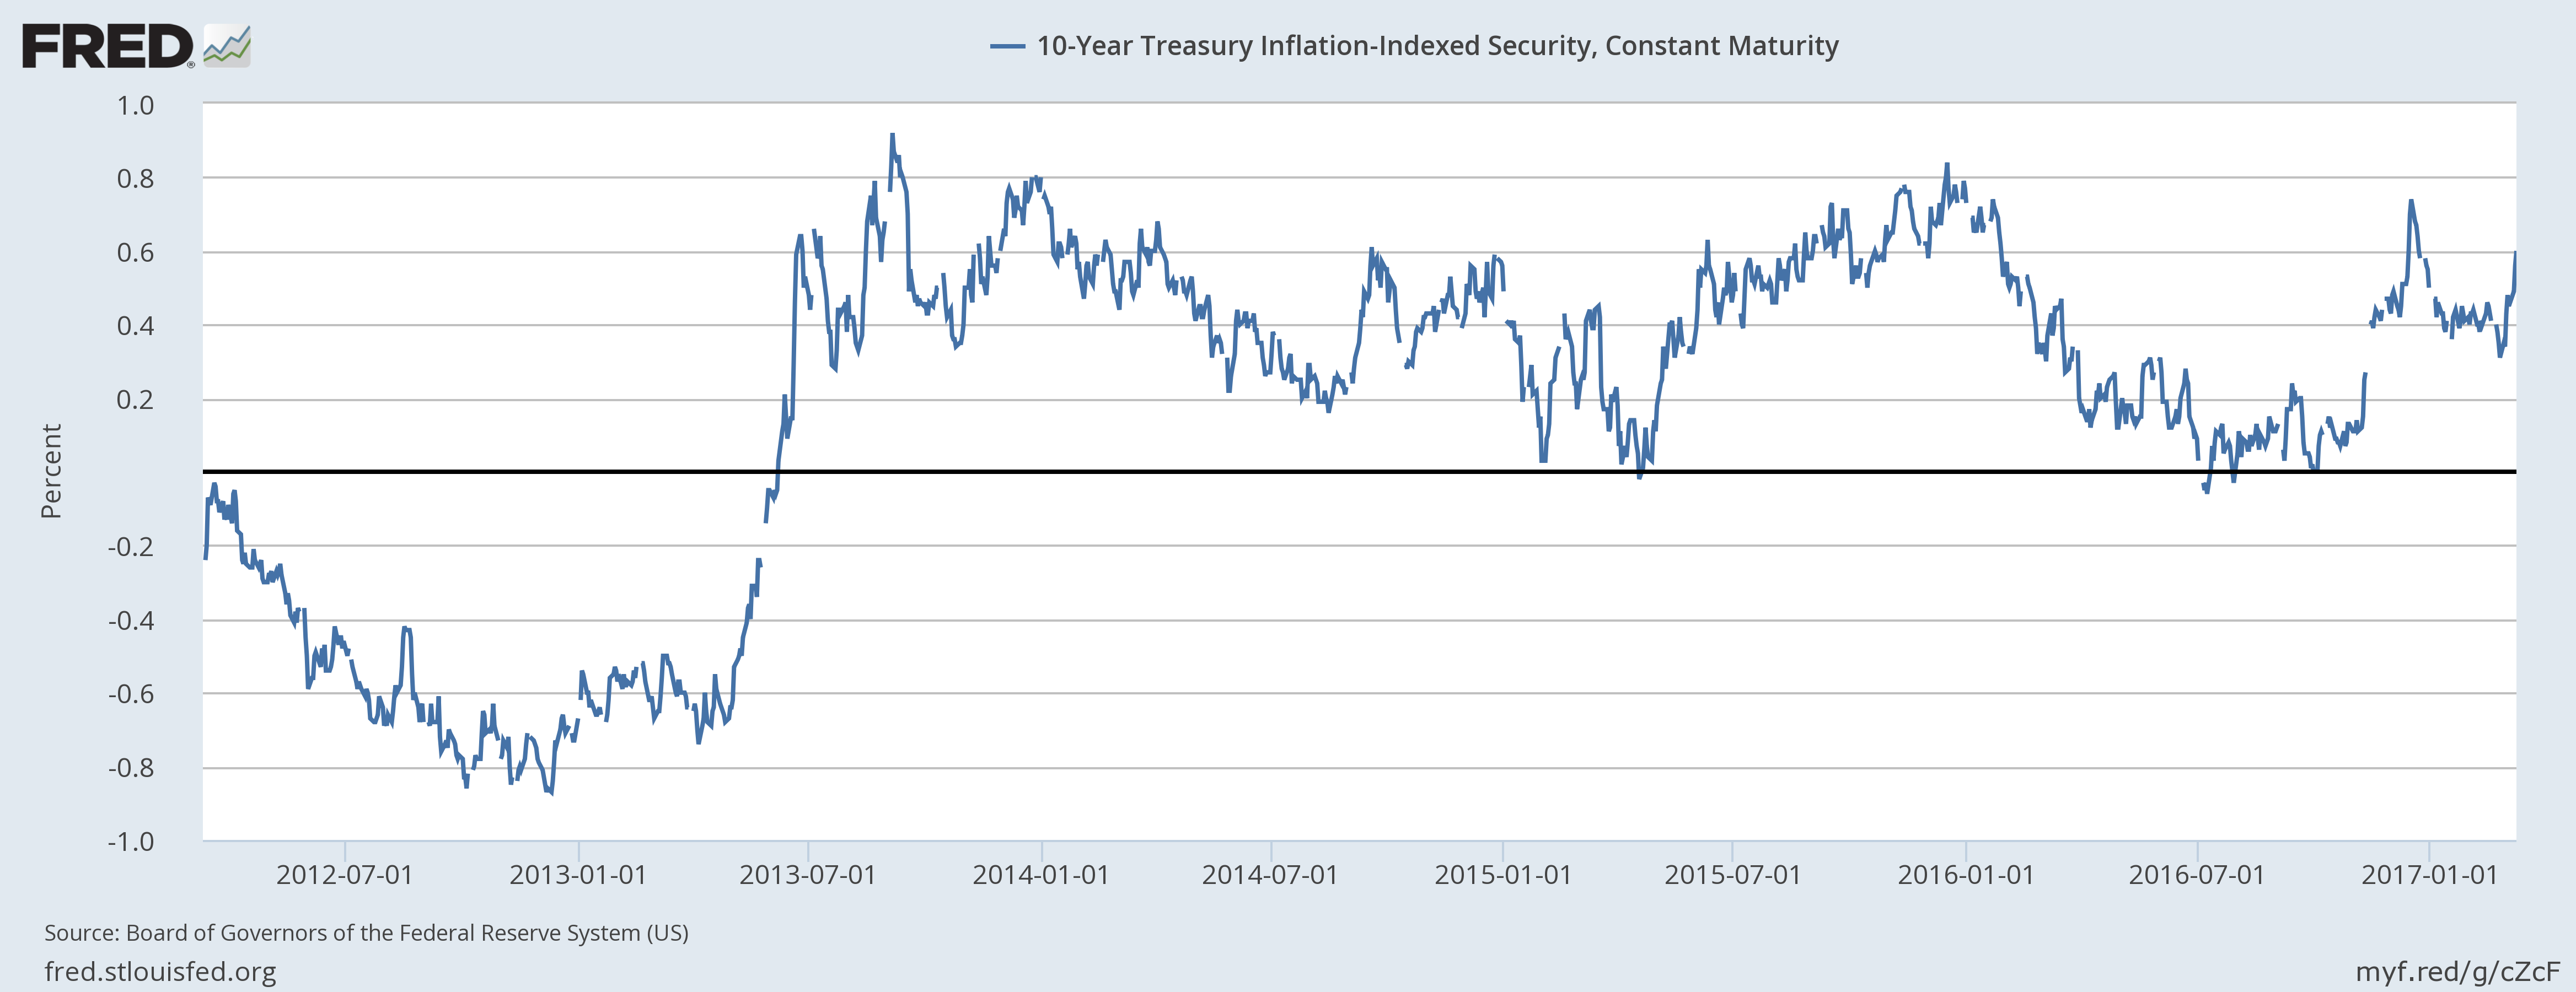 - Click to enlarge |
| The yield curve was essentially unchanged since the last update and doesn’t point to recession or boom but more of the same. |
10 Year Treasury Constant, 1990 - 2016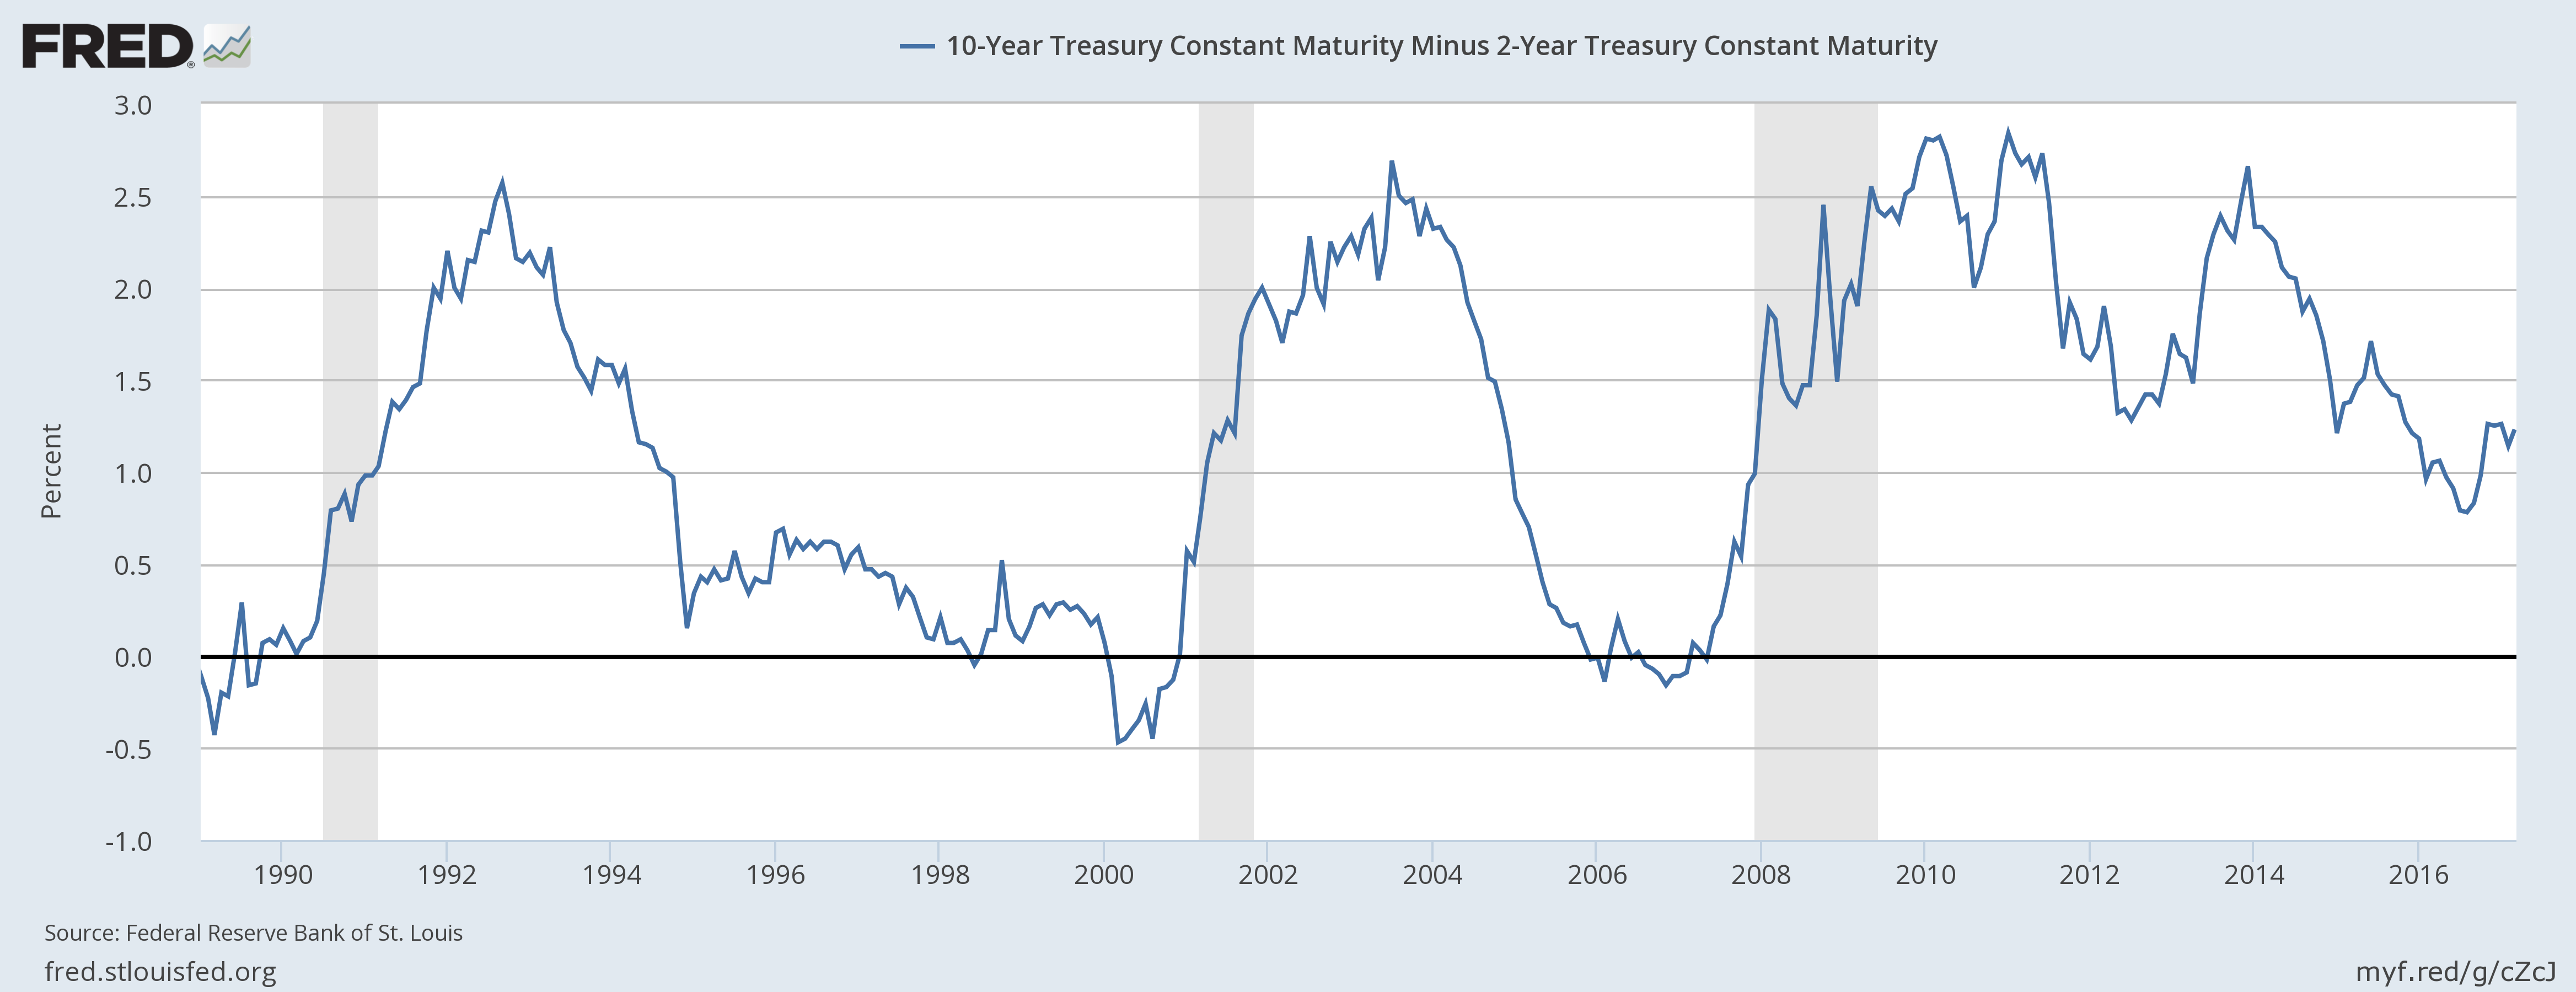 - Click to enlarge |
| Credit spreads ended up about flat since the last report but did widen from the best levels over the last few days. The widening at the end of the week was caused by oil prices finally falling back below $50. That would appear to be driven by memory of the last widening episode – that took us to the brink of recession – that was driven by energy credits. I’m not sure that makes sense as a lot of the problem children of the energy sector have either declared bankruptcy or been restructured in some fashion. In addition, there are numerous reports of lenders demanding stricter hedging programs to gain funding for new drilling. So maybe the energy patch will be able to better navigate lower prices this time around. Breakeven prices have fallen in many of the shale plays with the average now well down into the $30s. I’ll obviously keep an eye on them but I don’t think there’s any reason to get too worried about spreads just yet. |
US High Yield Option, Jan 2012 - 2017 - Click to enlarge |
| The dollar still appears to be in a topping process, not what one would expect if the US economy is about to accelerate. Currency markets seem to be anticipating more of a surge in European growth than US as the Euro was the main reason the dollar wasn’t able to rise on higher interest rates and expectations of more Fed action. Given these two charts, which one seems more attractive? I know my answer: |
US Dollar Index, Aug 2016 - Mar 2017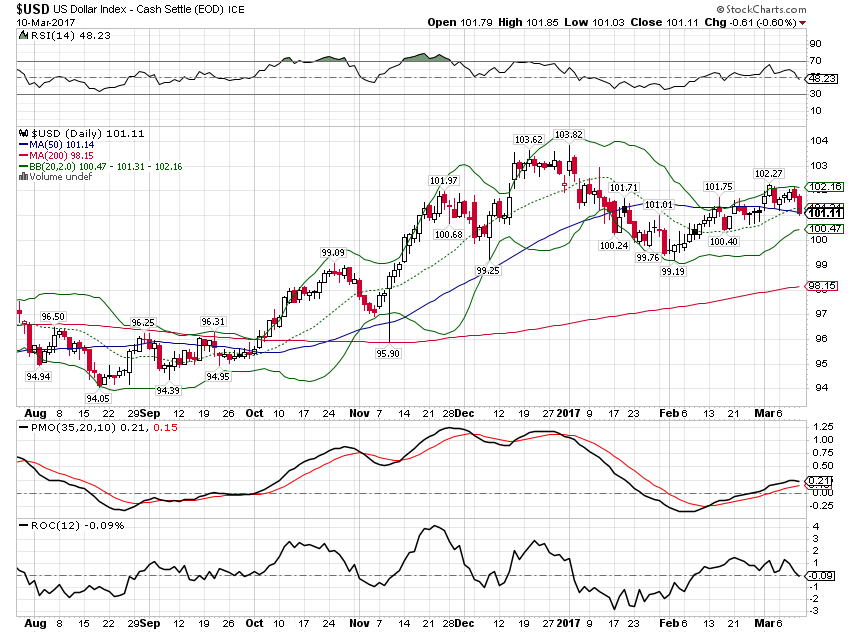 - Click to enlarge |
Euro, Aug 2016 - Mar 2017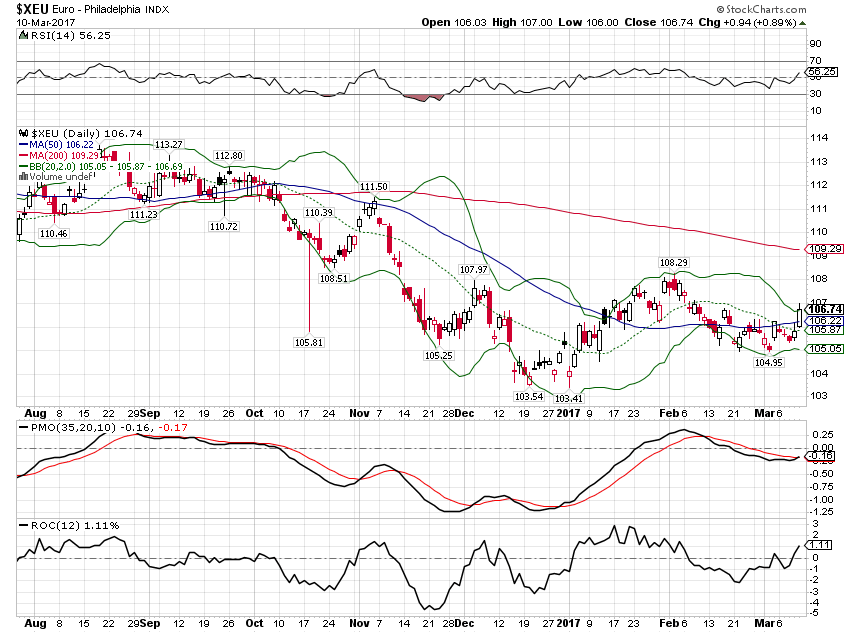 - Click to enlarge |
|
| Gold did seem to confirm the better growth prospects reflected in bond markets though. Technically it looks like there might be a bit more to go on this correction, but I would not get too aggressive in that direction. If the dollar continues to fall, gold will find support soon enough. |
Gold Daily , Aug 2016 - Mar 2017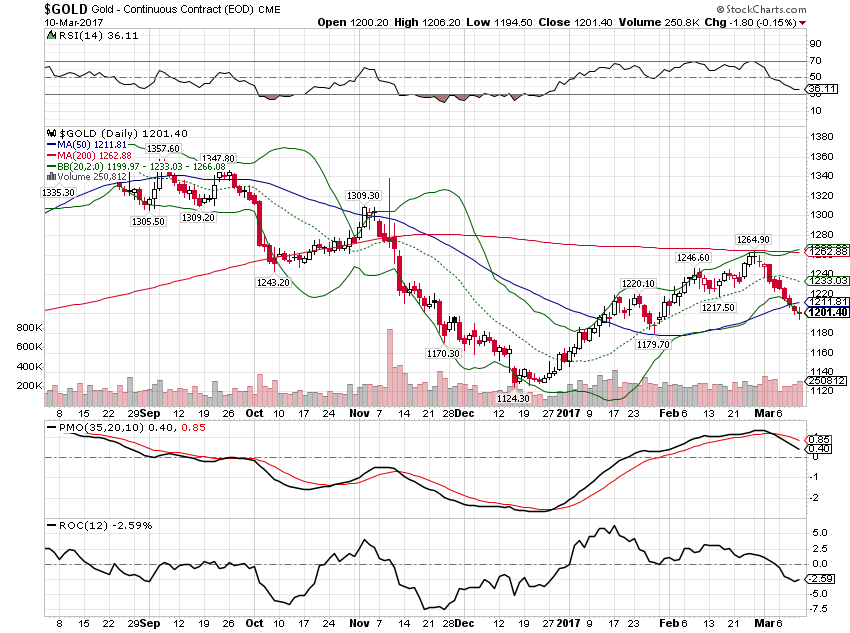 - Click to enlarge |
| Interestingly, stocks also turned lower since the beginning of March. That may be a function of the hawkish talk by the Fed or maybe buyers just got tired. Stocks are still in an obvious uptrend though.
The Fed seems almost sure to raise rates again next week. They’ve spent most of the last two weeks hinting rather loudly that is their preference. They almost have to follow through. I’m not sure if their obvious desire to hike rates is guided by their expectations regarding future fiscal policy or if it is just based on their outlook derived from the current data. If the former, I’ll offer them the same warning I’ve offered since election day – implementing the Trump agenda is not going to be easy or quick. If the latter, I’d refer to the Fed’s forecasting track record before getting too excited. Assuming they do go ahead next week, the reaction in markets will certainly be interesting. That should tell us a lot about whether the market views this little upturn in growth as sustainable or just another false start. |
SPX Daily, Aug 2016 - Mar 2017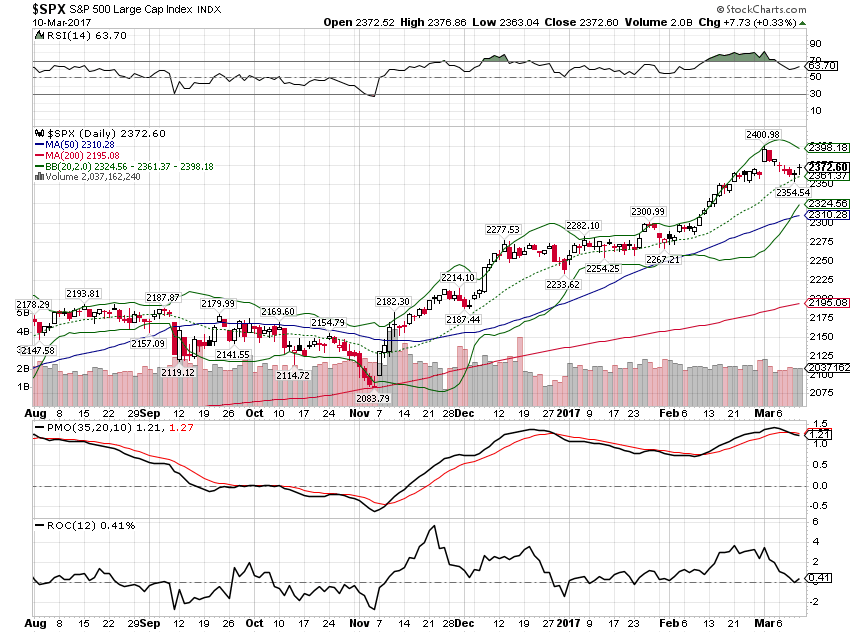 - Click to enlarge |
Tags: Alhambra Research,Bi-Weekly Economic Review,credit spreads,dollar,Donald Trump,durable goods,economic data,economic growth,economy,employment,Euro,Federal Reserve/Monetary Policy,Gold,Interest rates,newslettersent,stocks,Taxes/Fiscal Policy,TIPS,U.S. Consumer Spending,U.S. Disposable Personal Income,Yield Curve