Jeffrey P. Snider
My articles My offerMy siteAbout meMy videosMy books
Follow on:LinkedINTwitterSeeking Alpha
In August 2014, Federal Reserve Vice Chairman Stanley Fischer admitted to an audience in Sweden the possibility in some unusually candid terms that maybe they (economists, not Sweden) didn’t know what they were doing. His speech was lost in the times, those being the middle of that year where the Fed having already started to taper QE3 and 4 were becoming supremely confident that they would soon end them. At Janet Yellen’s first press conference as Chairman earlier that year, the idea was raised that just six months would pass between QE’s termination and the first rate hike such was the economic favorability.
So it became mainstream gospel that the economy was more in danger of “overheating” than it was either continuing stuck or, as did happen, severely diminish even more. There was a great deal of disbelief at that latter scenario given that such would be so unthinkable; after so much “stimulus” and enough time, there was just no way the US economy would not at some point recovery and do so in the familiar fashion.
Fischer told the assembled Swedes that the mistakes of forecasting made by the Fed’s staff just might be more than a throwaway joke about how economists were weathermen in different clothes.
Year after year we have had to explain from mid-year on why the global growth rate has been lower than predicted as little as two quarters back. Indeed, research done by my colleagues at the Federal Reserve comparing previous cases of severe recessions suggests that, even conditional on the depth and duration of the Great Recession and its association with a banking and financial crisis, the recoveries in the advanced economies have been well below average.
He would name three “headwinds” that were in his, and likely the FOMC’s, estimation holding growth back – housing still struggling somewhat of its hangover, the drag of fiscal policy (austerity, as the Keynesians emotionally label it) which was waning according to Fischer, and overseas weakness. If that was the comprehensive catalog of all “headwinds” in the summer of 2014, then “overheating” was plausible.
However, he struck a more cautious tone that, again, went largely unnoticed but would become central to the Fed’s ultimate “rate hike” case that goes forth today.
Possibly we are simply seeing a prolonged Reinhart-Rogoff cyclical episode, typical of the aftermath of deep financial crises, and compounded by other temporary headwinds. But it is also possible that the underperformance reflects a more structural, longer-term, shift in the global economy, with less growth in underlying supply factors.
The timing and really location of his speech suggests that perhaps the Fed was less confident than they let on at that time. It is a sharp contrast to Janet Yellen’s speech from February 2013 when she said unemployment was “largely cyclical not structural.” Drawing a line from Yellen’s speech (and even further back to their internal economic discussions in 2011) to Fischer’s speech to the sea change in attitude and outlook in the summer of 2016, it is very easy to establish that the “rising dollar” killed all notions of recovery.
Fischer’s speech, then, wasn’t merely a short breath of honesty, it was but the first legitimate shudder at the possibility of the truly worst case. Economists were too optimistic not just by their nature, but more so because they were modeling the entire wrong thing. Even though it has been almost three years now since this official transition took hold and grew (and it is authorities and “experts” who are always so far behind the curve), I don’t get the sense that the mainstream understands the implications. They are very drastic, a point which cannot be overstated (no matter how much I might try).
The progression of economic models presents this case in easily observed fashion. I have shown numerous times even recently just how much the CBO has reduced its estimates for potential, which are in all likelihood close to those calculated by the Federal Reserve’s models. There are a couple of points which bear repeating. First, the CBO did not revise lower the US economic trend in anticipation of this outcome, they were forced to do so only as it over time became more and more apparent what was happening (the unthinkable).
Second, and more important to today in terms of “reflation”, the reduction in trend left no space for any recovery at all. This is the factor which seems missing from current analysis, as if the Fed is “raising rates” in 2017 based on the same guiding principles as those that existed in 2014 or before. The world today is night and day different, though in reality what I mean is that the world is the same today as then so what has changed is policymakers now have all the necessary proof beyond any doubt that is the case. There was actually no growth potential in 2014, and there will be none now.
| A recovery in any context is to be taken literally, and in the economic one it is what has been known as the V-shape. The economy runs along its trend line until recession. But a recession is not shrinking, it is merely a temporary disruption (output gap) that is resolved by some period of above-trend growth (recovery). That is what policymakers kept over-estimating and waiting for throughout the post-crisis period; the above-trend burst of growth that would restore a great many things, as well as cure a great many others (including any possible asset bubble imbalances). |
Friedman's Plucking Model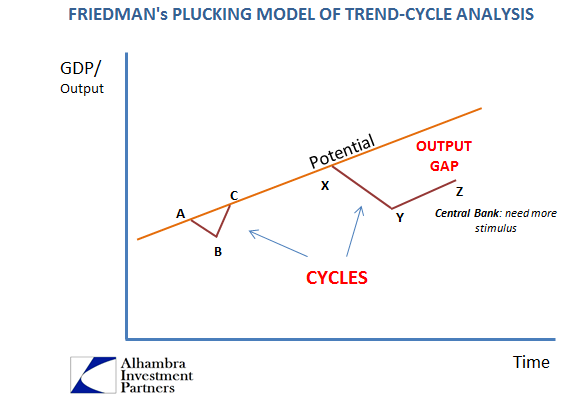 - Click to enlarge |
| The historical case for the “V” was more than solid; outside of the Great Depression it has been observed in every modern recession cycle – meaning that apart from the Great Depression they were all actual cycles. The variance was more often in how long it would take for output to resume its trend growth, for the output gap to close fully. |
Potential Real GDP: CBO 1968-1984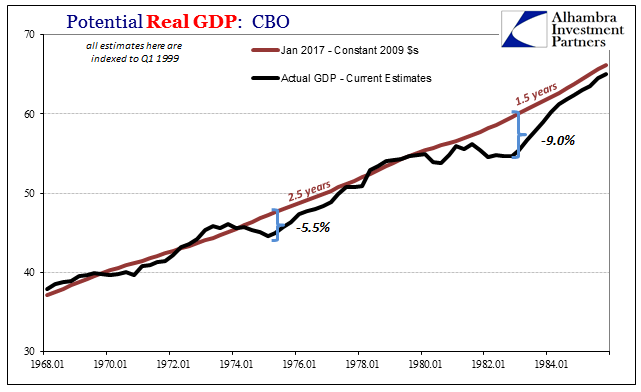 - Click to enlarge |
| Using the CBO’s estimates, the recovery after the 1973-75 recession took 2.5 years for the output gap to be extinguished while the one following the hard double dip 1981-82 recession took only six quarters. In those six quarters there was that hugely intense burst of growth defined by the severity of the contraction preceding it (symmetry), giving way once the output gap closed as the economy settled back down into trend (or what is calculated as the trend using today’s estimates). |
Potential Real GDP 1978 - 1988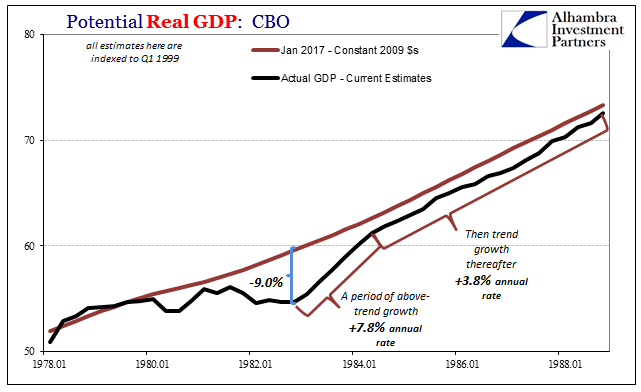 - Click to enlarge |
| It is this pattern which guided all contemporary orthodox expectations for recovery after the Great “Recession.” The one caveat economists would admit is the time axis; they knew that no matter what even a full recovery would have taken longer than was typical given the nature of the contraction (housing bust, bank panic). In most models, including those of the CBO, it was believed that the output gap would be closed after three years, twice as long as the 1983-84 recovery.
What follows is the yearly progression for expected recovery given modeled potential at those times: |
Potential Real GDP: CBO 2005-2019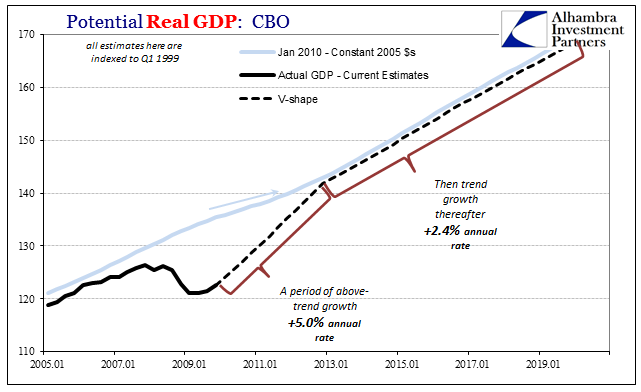 - Click to enlarge |
Potential Real GDP: CBO 2005-2019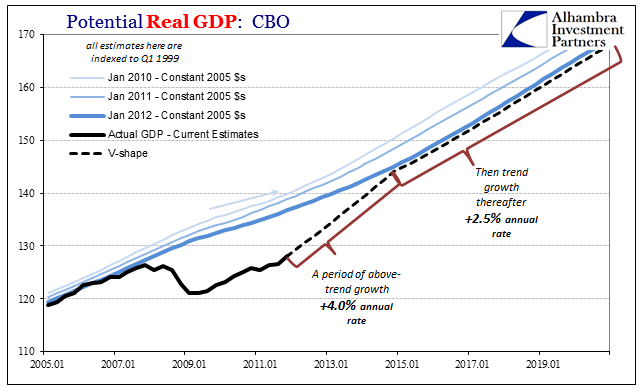 - Click to enlarge |
|
Potential Real GDP: CBO 2005-2019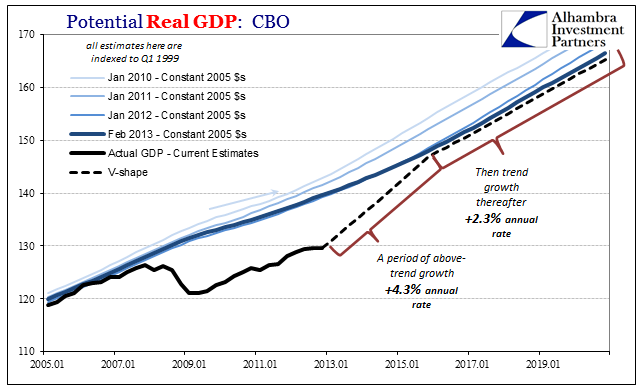 - Click to enlarge |
|
Potential Real GDP: CBO 2005-2019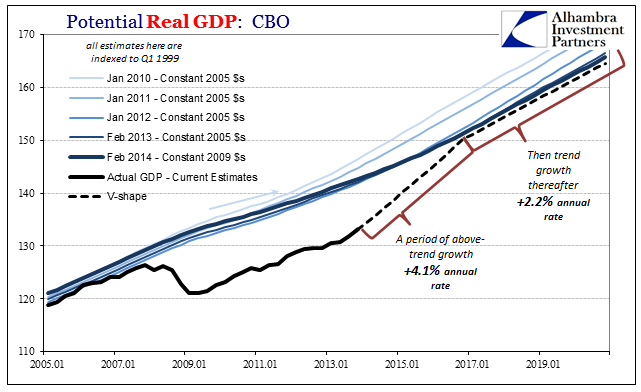 - Click to enlarge |
|
| By 2014, there was still a recovery indicated even though potential had been written down so far already. What happened during the “rising dollar”, however, was a total reorientation, introducing the orthodox of economics to an economy beyond the business cycle, the first since the 1930’s. It was the “rising dollar” which permanently altered all views, leaving even the most ardent QE supporters to finally accept the heretofore impossible. |
Potential Real GDP: CBO 2005-2019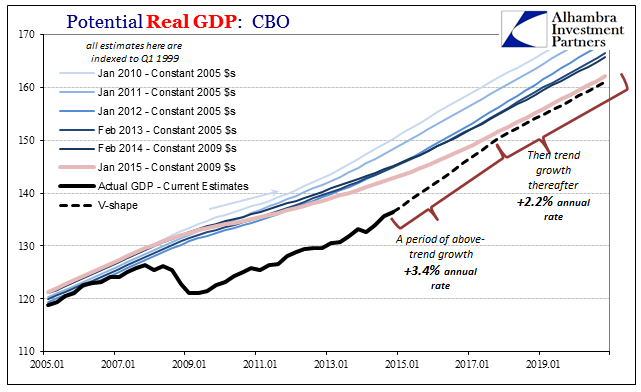 - Click to enlarge |
Potential Real GDP: CBO 2005-2019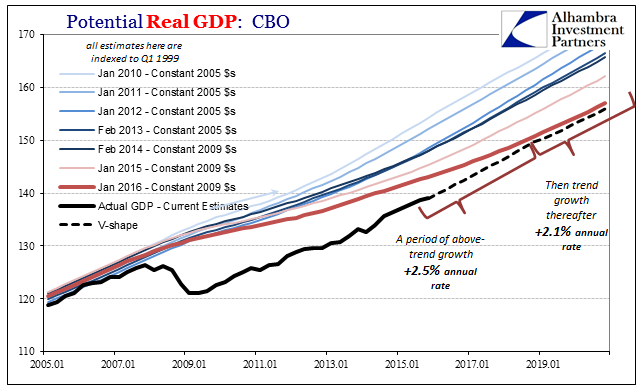 - Click to enlarge |
|
Potential Real GDP: CBO 2005-2019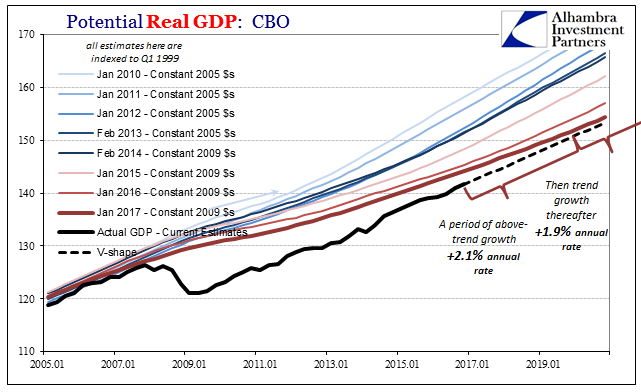 - Click to enlarge |
|
| Where we are now with the last of the trend reductions (January 2017) is that what above-trend growth there could be to close what is left of the output gap is barely differentiated at all from trend growth. That simply means that in reality the economy shrunk in 2008 and then just started anew with a vastly different trend. It is wholly unlike what the public was told to expect, and not much if anything is being done to clarify this situation right now (there seems no appetite of Fed officials to speak openly about the difference between 2010’s expectations and 2017’s, preferring instead to hint at a “skills mistmatch” or a max 3% fed funds rate without explicitly stating what those mean in these non-cycle terms). |
Potential Real GDP: CBO 2010-2017 - Click to enlarge |
| You can try to make the argument that the CBO has it wrong, and that there is still a major output gap that will be closed if given enough time or the right “tailwinds.” But that would be the outlier case as, again, the CBO came up with these projections as though they were mugged by reality. To believe otherwise is to believe the extraordinary, exactly the opposite of where these positions seemed to have started out. The “recovery” growth possibility right now is less than trend growth was estimated in all but the latest CBO update. Eight years (really ten) is more than enough evidence and time to establish the validity of both our woeful state and how we are stuck in it until something meaningfully changes.
This is a vastly different scenario than when the Fed first contemplated its “exit” three years ago. As I wrote last December, the FOMC is not voting for recovery but rather voting to recognize it is never happening. Most people, including those pushing “reflation”, don’t seem to either see or appreciate this wholly different paradigm. It’s as if they believe the Fed is still acting its concern to get ahead of that 4% burst of growth, as if overheating which wasn’t ever a realistic danger is somehow one now. It’s would be disastrous enough if this was just limited to the United States, but it is not. This is a globally shared mugging. |
OECD Global Trade Estimates for China 1990 - 2018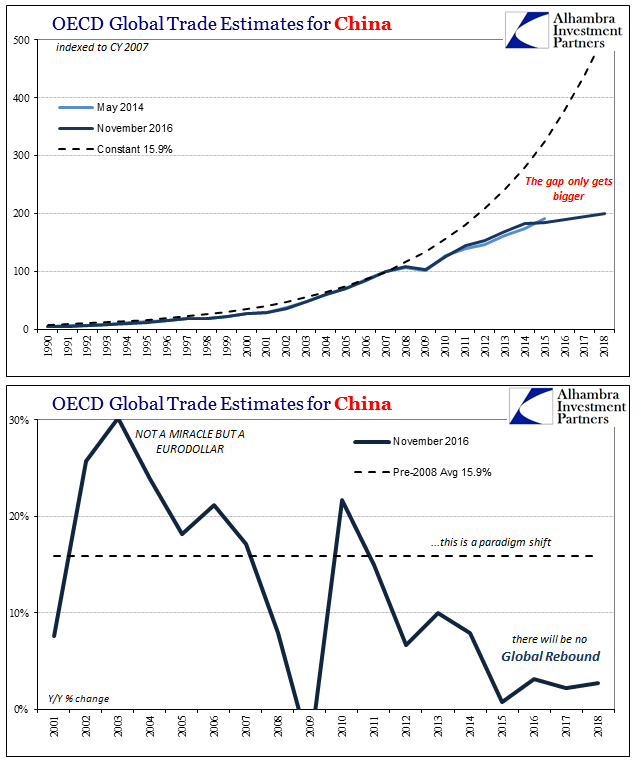 - Click to enlarge |
Tags: Business Cycle,cbo,currencies,depression,economic potential,economy,Federal Reserve/Monetary Policy,FOMC,Janet Yellen,Markets,Monetary Policy,newslettersent,Output Gap,QE,recovery,Stanley Fischer,ZIRP