


George Dorgan
My articles My siteAbout meMy videosMy books
Follow on:LinkedINTwitterSeeking Alpha
CFA SocietyEconomicBlogs
|
Swiss Franc Currency IndexThe Swiss Franc index remained around the 2% gain that for the last month, the recovery from the Trump reflation trade. In this trade, investors preferred U.S. against European stocks. This tendency, however, is reversing now – and with it the franc recovered.
|
Trade-weighted index Swiss Franc, February 04(see more posts on Swiss Franc Index, )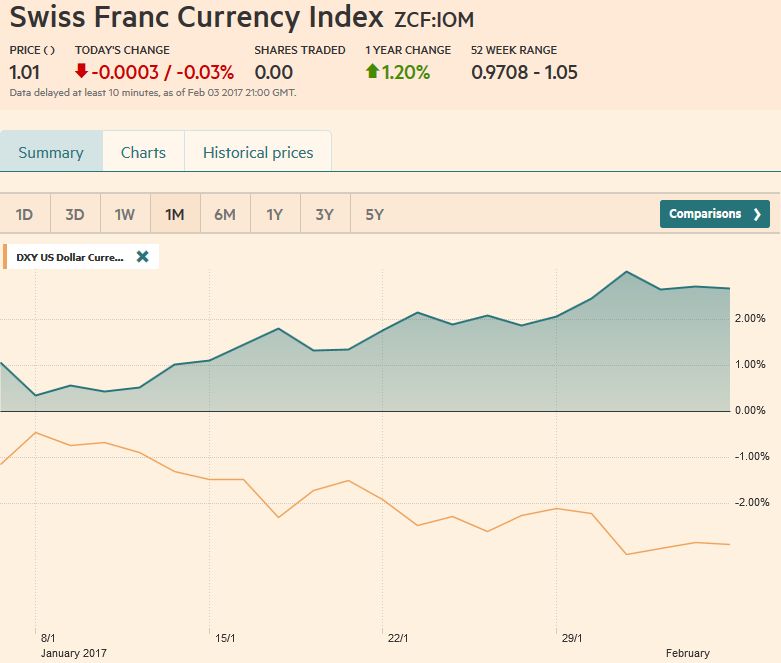 Source: market.ft.com - Click to enlarge |
Swiss Franc Currency Index (3 years)The Swiss Franc index is the trade-weighted currency performance (see the currency basket)On a three years interval, the Swiss Franc had a weak performance. The dollar index was far stronger. The dollar makes up 33% of the SNB portfolio and 25% of Swiss exports (incl. countries like China or Arab countries that use the dollar for exchanges). Contrary to popular believe, the CHF index gained only 1.73% in 2015. It lost 9.52% in 2014, when the dollar (and yuan) strongly improved. |
Swiss Franc Currency Index (3 years), February 04(see more posts on Swiss Franc Index, )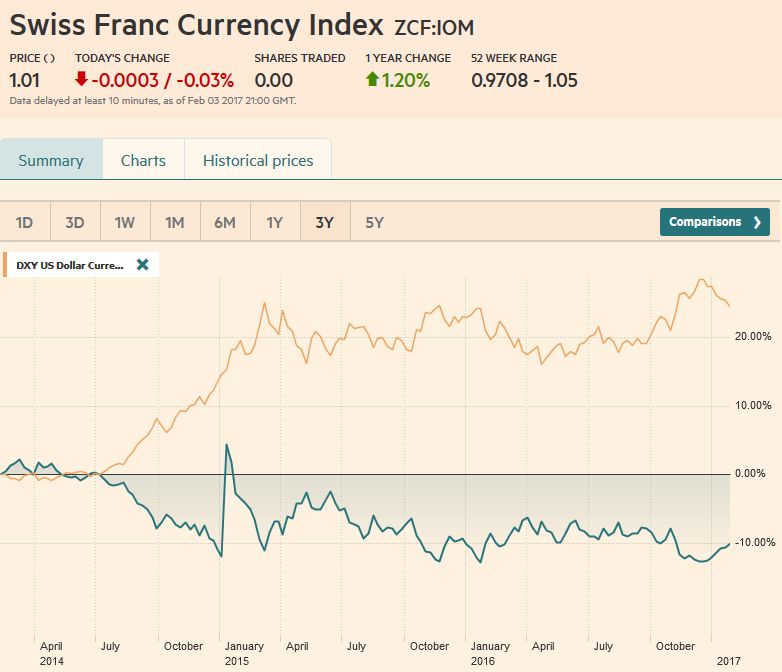 Source: market.ft.com - Click to enlarge |
|
Marc Chandler My articles My offerMy siteAbout meMy videosMy books Follow on:LinkedINTwitterSeeking AlphaAmazon USD/CHFThe end of the US dollar’s downside correction, which we see having begun in mid-December, following the Fed hike rather than the start of the New Year, is proving more elusive than we anticipated.
Our reading of the technical condition and the weak close before the weekend warns of the downside risks.
The verbal intervention by the new US Administration and the unexpected weakness in wage growth may be factors extending the correction. Nevertheless, we continue to view the dollar’s pullback as corrective in nature and not the end of the bull run, and still see the macroeconomic considerations falling into place for a resumption of the underlying bull market.
Following the US January jobs report, the odds of a rate hike in March fell. According to Bloomberg’s calculations, the odds of a March hike fell to 24% from 32%. Our own calculation was closer to the CME’s estimate of almost 18% before the employment data and 9% afterward.
Both Bloomberg and the CME estimate the probability of that the Fed funds target is 75-100 bp by the end of June edged higher. For Bloomberg, the odds increased to 71% from 68% and for the CME 49.3% from 48.1%.
|
US Dollar/Swiss Franc FX Spot Rate, February 04(see more posts on USD/CHF, )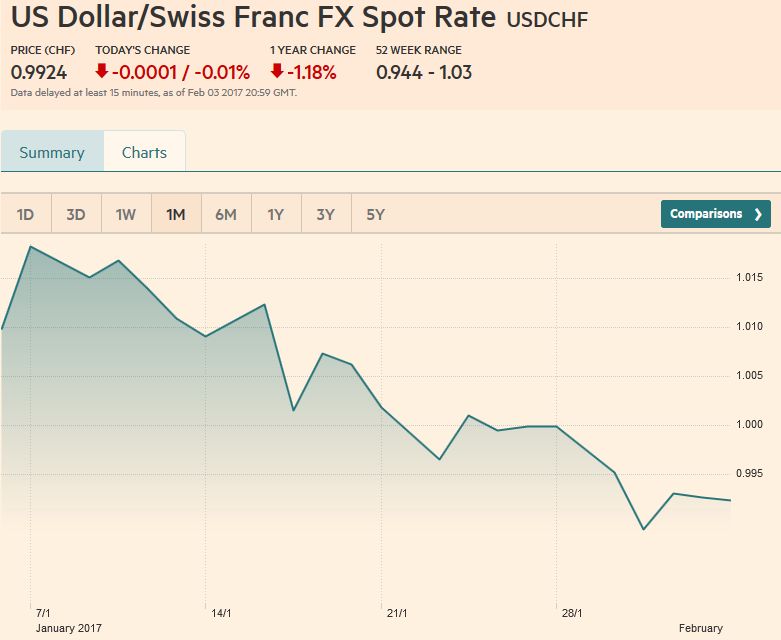 Source: markets.ft.com - Click to enlarge |
US Dollar IndexThe Dollar Index has yet to sustain upticks. The recovery after new lows since mid-November were recorded on February 2
was constructive, but the pre-weekend price action neutralized it. There is a band of mild support seen between 99.20 and 99.40.
We note that last week, the Dollar Index met the 38.2% retracement of the gains since last year’s lows set in May (~99.25). Stronger support is seen near 98.95, and a break of it could signal a move toward 98.00. (~97.85 is the 50% retracement of the rally since last May). On the upside, a move through the pre-weekend high near 100.25 would be a favorable sign.
|
US Dollar Currency Index, February 04(see more posts on Dollar Index, )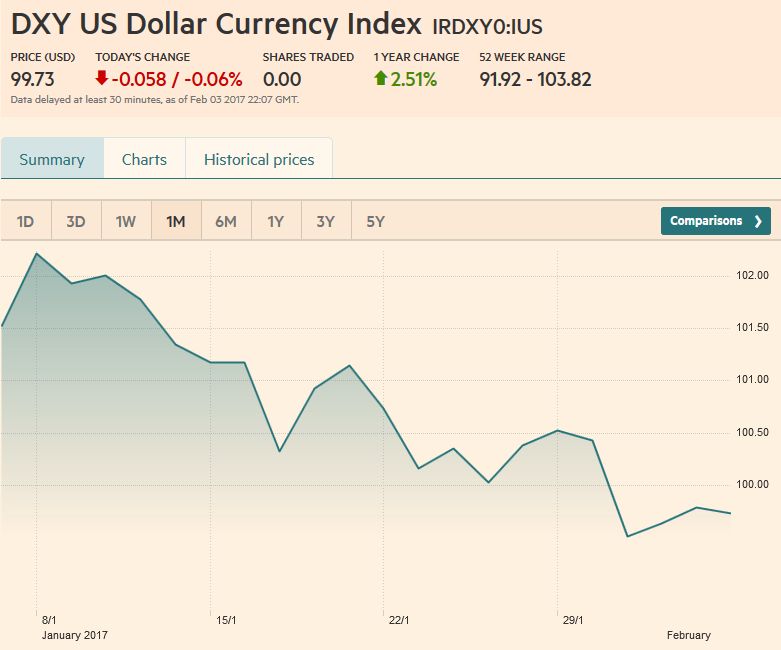 Source: markets.ft.com - Click to enlarge |
EUR/USDThe euro flirted with the 100-day moving average (~1.0790) and the 50% retracement of the losses since the US election (~$1.0820) and a 38.2% retracement of the euro’s slide since last year’s high (~$1.1615).
Medium-investors seemed to see it as a reasonable selling opportunity. The 61.8% retracement of the post-election more is near $1.0935, and $1.0980 is the 50% retracement of the larger move. The Slow Stochastics have turned lower, but the MACDs have yet to cross.
The RSI did not confirm the new high last week, but the RSI is flat a little below 60.
The two-year interest rate differential widened in the US favor for six consecutive sessions and the second straight week after a five-week period of narrowing.
The close before the weekend of almost 194 bp is the largest US premium since January 4 and the highest weekly close of the year so far. If this is sustained, the greenback should begin finding better traction. The German two -year yield may ease as a safe harbor ahead of next month’s Dutch elections. Political risk in France,(and to a less extent in Italy, perhaps) may also favor Germany debt securities.
|
EUR/USD Week Ending February 04 with Technical Indicators(see more posts on Bollinger Bands, EUR/USD, MACDs Moving Average, RSI Relative Strength, Stochastics, )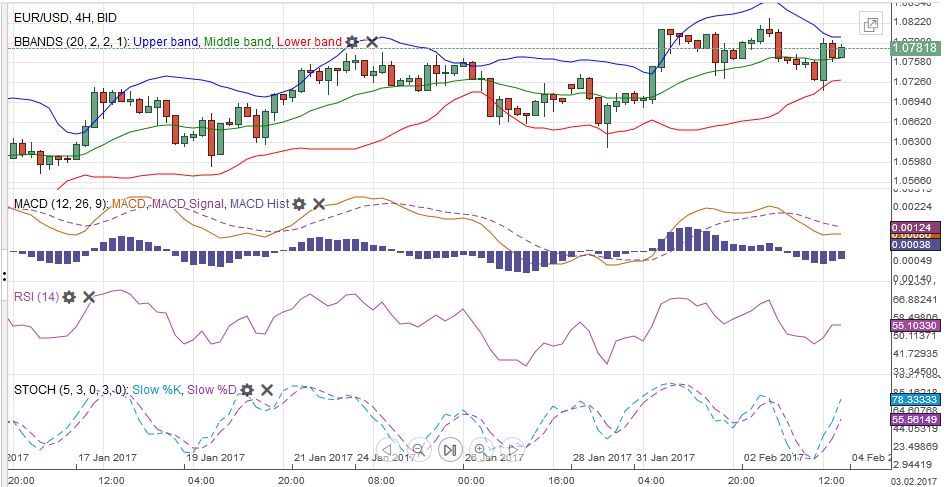 EUR/USD Week Ending February 04 with Technical Indicators - Click to enlarge |
USD/JPYThe yen was the strongest of the major currencies last week, gaining 2.2% against the greenback.
The yen’s gains ended a two-week drift lower, during which it lost about 0.5%. The US dollar successfully tested the JPY112 level twice, and the bounces (~JPY114.00 and ~JPY113.50) appeared to lack conviction.
The Slow Stochastics has been trending higher since January 19, but last week leveled out and rolled over. The MACDs have not yet turned, though a turn still seems near.
The US 10-year premium over Japan narrowed a few basis points last week, which is the second consecutive week of narrowing, and the fifth of the past six weeks. The premium peaked in mid-December when the Fed hiked (~251 bp). It had fallen to about 230 bp on January 11 before widening to almost 245 bp two weeks later. It eased back to 235 bp last week before firming ahead of the weekend.
|
USD/JPY Week Ending February 04 with Technical Indicators(see more posts on Bollinger Bands, Japanese yen, MACDs Moving Average, RSI Relative Strength, Stochastics, )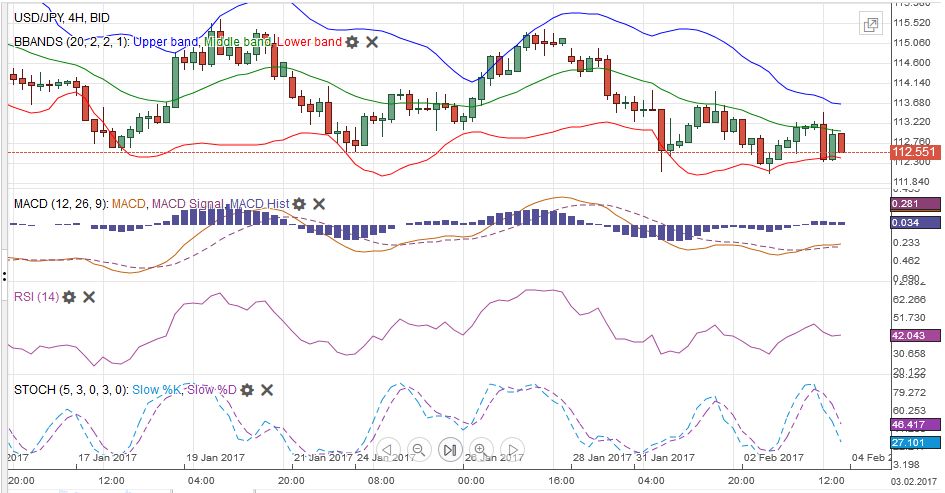 USD/JPY Week Ending February 04 with Technical Indicators - Click to enlarge |
GBP/USDWith a push from the Bank of England, sterling staged a key reversal on February 2. It made a new high for the move and then was sold off and closed below the previous day’s low. Sterling traded heavily before the weekend. It was the weakest of the majors.
The nearly 0.6% fall followed a two-week 3.1% advance. Important technical support is seen in the $1.2400-$1.2430 area. The Slow Stochastics have turned lower, and the MACDs look poised to cross. The RSI turned lower but is neutral. A move above $1.2550 would likely turn the technical tone more positive.
|
GBP/USD Week Ending February 04 with Technical Indicators(see more posts on Bollinger Bands, British Pound, MACDs Moving Average, RSI Relative Strength, Stochastics, ) GBP/USD Week Ending February 04 with Technical Indicators - Click to enlarge |
AUD/USDThe Australian dollar appreciated every session last week (now a six-day streak). The 1.7% advance on the week, the fifth weekly advance in the past six weeks, brought it to the $0.7700 area that nemesis last year. Occasional the level yielded, but not on a sustained basis and closes above it were rarer still. The upper Bollinger Band is found near there now. The MACDs looked like they were poised to cross lower, like the Slow Stochastics. Instead, the MACDs pushed higher, and the Slow Stochastics are turning higher.
The Australian dollar appreciated 2.5% on a trade-weighted basis last month. It is the fourth monthly rise in the past five months. It is now at levels not seen since the middle of 2015.
The terms of trade have improved for Australia. Australia reported a record trade surplus for December last week, owing in no small measure to exports to China and a sharp increase or iron ore and coal shipments. The RBA meets next week, and given the vulnerability of the market, a few well-placed words by
Governor Lowe could help spur an adjustment of positions. Without it, the bulls may remain in control and press ahead. The measuring objective of the large rounded bottom may be near $0.7900. On the other hand, a move below $0.7580 may be the first sign that the $0.7700 ceiling is still in place.
|
AUD/USD Week Ending February 04 with Technical Indicators(see more posts on Australian Dollar, Bollinger Bands, MACDs Moving Average, RSI Relative Strength, Stochastics, ) AUD/USD Week Ending February 04 with Technical Indicators - Click to enlarge |
USD/CADThe US dollar recorded highs near CAD1.36 in November and again in December. Between the two peaks, the US dollar fell to a CAD1.3080 valley. After having fallen through it, the dollar recovered but only to sell off again, and finished the week below it. The US dollar finished the week below the 50% retracement (~CAD1.3030) of its rally since last year’s low (~CAD1.2460). The 61.8% retracement is near CAD1.29. The downside momentum eased as the greenback traded within the January 31 range for the last three sessions. The break of that range-CAD1.2970 to CAD1.3125 will be technically important. |
USD/CAD Week Ending February 04 with Technical Indicators(see more posts on Bollinger Bands, Canadian Dollar, MACDs Moving Average, RSI Relative Strength, Stochastics, )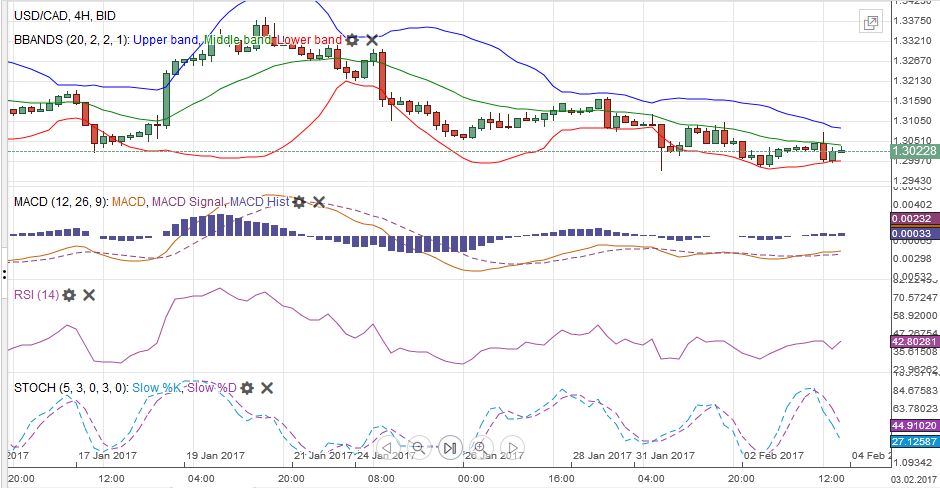 USD/CAD Week Ending February 04 with Technical Indicators - Click to enlarge |
Crude OilWith few exceptions, PMIs started the year upbeat. It provided a reminder that with modest cuts in OPEC and non-OPEC, even with US shale oil production offsetting some of the cuts theoretically, demand is gradually catching up to output. The March light sweet futures contract gained 1.25% last week, the best gain so far here in 2017. The technical indicators are not generating strong signals, and the contract looks set to continue to traverse a $52-$56 trading range. |
Crude Oil, February 04(see more posts on Crude Oil, )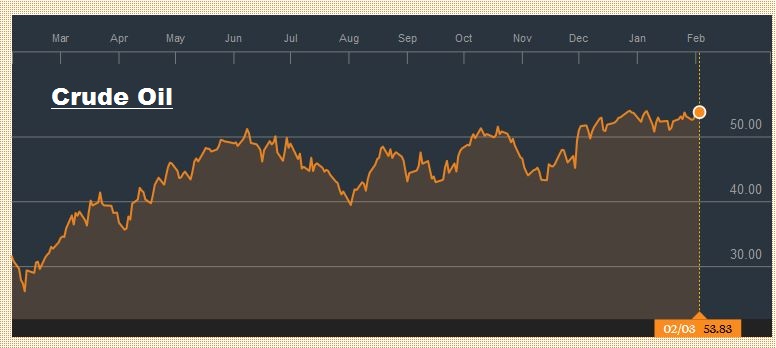 Source: Bloomberg.com - Click to enlarge |
U.S. TreasuriesThe US 10-year yield slipped two basis points last week to finish at 2.46%. Over the previous two weeks, the yield had increased eight basis points. The yield was confined to the previous week’s range when it recovered from the test on the 2.30% level. The technical indicators for the March futures contract are giving contradictory signals. The Slow Stochastic is turning up while the MACDs are poised to turn lower. The RSI is flat near 48.5.
The sideways drift can whipsaw the indicators. Prices are more important. It is only important if there is a break of a 123-18 to 125-12 range. The rest seems like noise. |
Yield US Treasuries 10 years, March 2016-Feb 2017(see more posts on U.S. Treasuries, )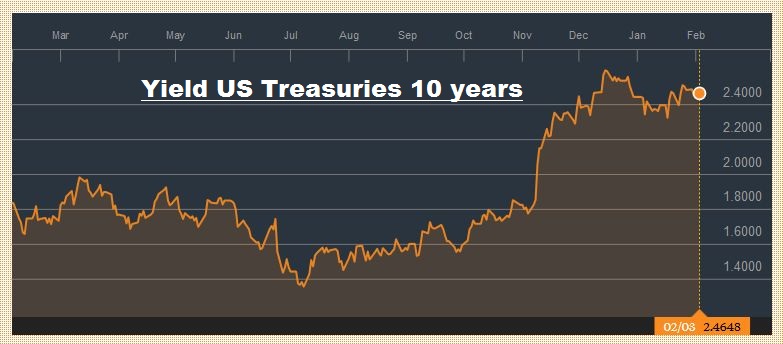 Source: Bloomberg.com - Click to enlarge |
S&P 500 IndexThe S&P 500 gapped higher on February 3, and in so doing, negated the bearish three-day island top created by last Monday’s (January 30) sharply lower opening.
With the strong pre-weekend close near session highs, it is within spitting distance of the record high (~2601). The S&P 500 is may be a good example of prices leading the technical indicators. After trading sideways for a few sessions, the strong rally before the weekend was not sufficient to turn the Slow Stochastics or MACDs (the RSI leaped higher).
The NASDAQ three-day island top was also negated by the end of last week. It gapped higher on Wednesday and failed in attempting to close the gap on Thursday. The close was on the highs, less than 0.1% from its record high.
|
S&P 500 Index, February 04(see more posts on S&P 500 Index, )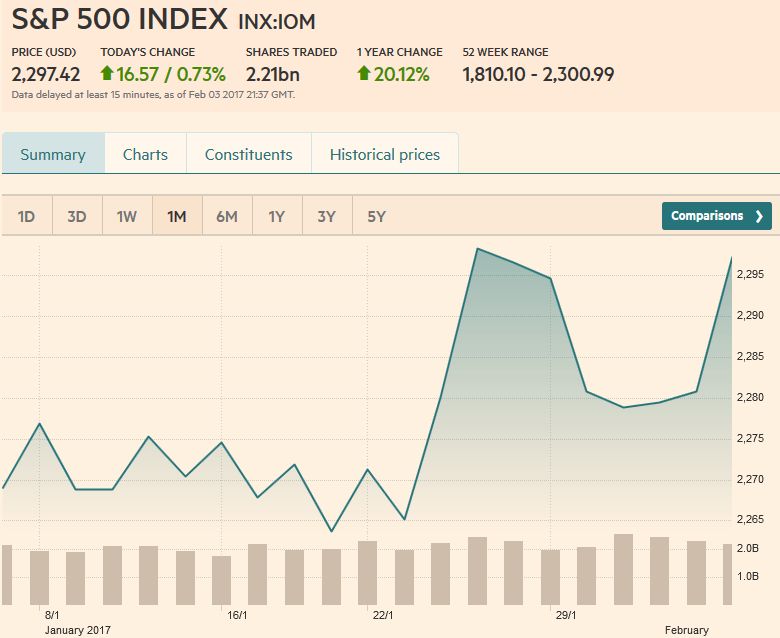 Source: markets.ft.com - Click to enlarge |
Are you the author?
Tags: Australian Dollar,Bollinger Bands,British Pound,Canadian Dollar,Crude Oil,Dollar Index,EUR/CHF,EUR/USD,Euro,Euro Dollar,Japanese yen,MACDs Moving Average,newslettersent,RSI Relative Strength,S&P 500 Index,Stochastics,Swiss Franc Index,U.S. Treasuries,USD/CHF,USD/JPY


