A Soaring MarketOn January 20 2017 Donald Trump will be sworn in as the new president of the United States. On the stock market his victory has triggered a lot of advance cheer already: the Dow Jones Industrial Average rose by a sizable 7.80 percent between the election and the turn of the year. Many investors are now wondering what effect the change in government will have on stock prices in the new administration’s first year. Will the new government continue to drive the market higher? Or will it actually decline? We will examine this question statistically. To this end we take a look at how stock prices were affected by changes in government in the past and whether these changes have generated stronger gains on average than were achieved in other years. |
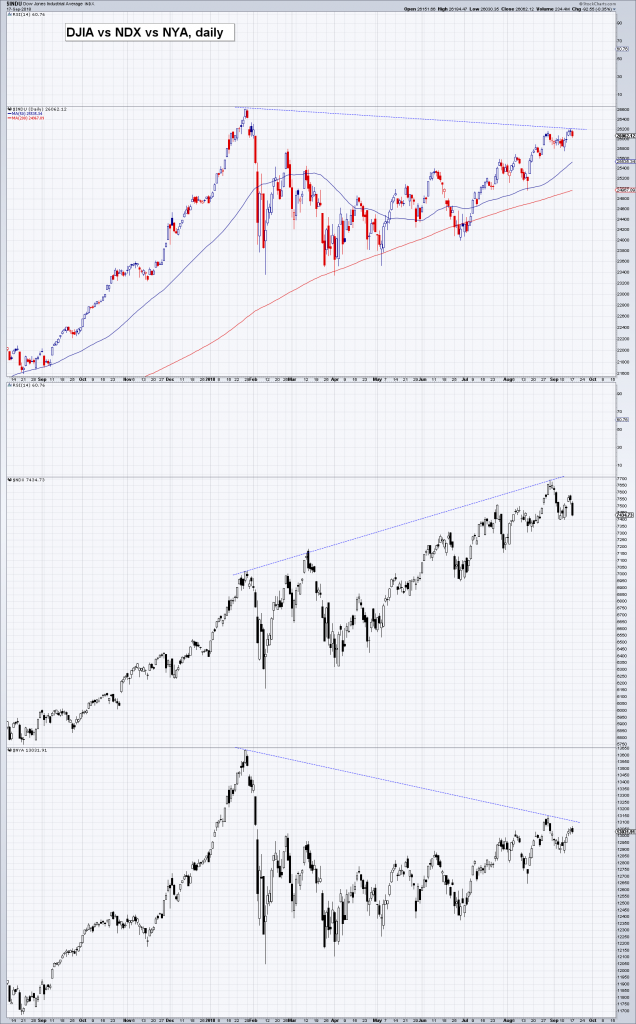
Dow Jones Industrial Average Index, Daily(see more posts on Dow Jones Industrial Average, ) Two big winners: the DJIA and Donald Trump - Click to enlarge |
The Long Term Seasonal Trend of the Dow Jones Industrial Average (DJIA)Let us first take a look at the “normal” seasonal trend of the DJIA. To enhance the calculation’s statistical relevance, we have constructed an especially long term chart that includes every year since 1900. Thus the seasonal chart below shows the typical price pattern of the DJIA in the course of a year, averaged over the past 117 years. As the vertical scale indicates, the DJIA rose by nearly 5 percent on average. Particularly strong gains tend to be posted in the final two weeks of December – the Santa Claus rally sees prices rally most of the time. Between early May and late October, the average gain has been zero though. This confirms the so-called Halloween effect, according to which the summer months typically generate no returns for stock market investors. |
Dow Jones Industrial Average - Seasonal(see more posts on Dow Jones Industrial Average, ) Dow Jones Industrial Average, seasonal pattern over the past 117 years. Typically, no gains are achieved between May and October - Click to enlarge |
A Close Look at the Typical Post-Election YearNext we are looking at the typical seasonal pattern in the DJIA in post-election years such as the year 2017. If elections can affect stock prices as strongly as has happened in the wake of Donald Trump’s victory, they may have a noteworthy effect on the subsequent year as well. The next chart is constructed in the same manner as the previous one, but instead of every year, only every fourth year – namely every post-election year – is included the calculation of the seasonal average. Overall, the average post-election year has been slightly weaker than the average year since 1900. Most importantly, the intermittent corrections tend to be much fiercer than usually. These include a typical decline from January until the end of February, as well as a quite strong downturn in the fall. |
Stock Prices Dow Jones Industrial Average, Seasonal - Filter: US Presidential P(see more posts on Dow Jones Industrial Average, )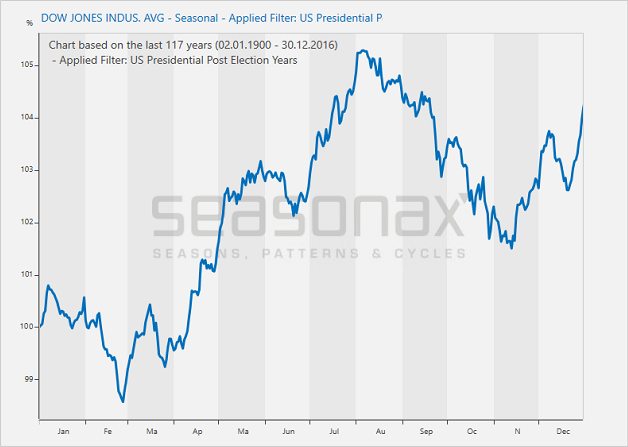 Regime Change: The Effect of Trump’s Victory on Stock Prices Dow Jones Industrial Average, seasonal pattern in post-election years since 1900. Volatility tends to be greater than in all years combined. Moreover, prices tend to decline until late February, then rally and decline again in the fall. - Click to enlarge |
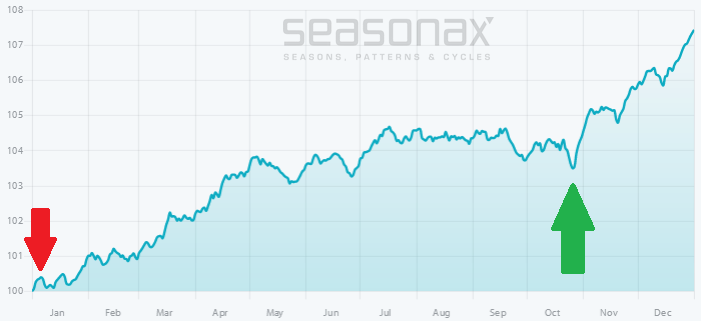
The Typical Trend after a Change in the Governing PartyNext we will take a look at post-election years that have entailed a change in government – this is to say, a change from a Democratic to a Republican president or vice versa. That is actually the case that most closely resembles the current one. Such changeovers have happened 11 times since the year 1900. Similar to the previous chart, we once again show the average pattern of the DJIA in post-election years, but this time only the years in which the new president hailed from a different party than his predecessor are taken into account. As can be seen, the average pattern that forms in post-election years which involve a change in the governing party is quite distinctive and differs noticeably from what usually happens. No net gains are achieved between January and late October. Only the final two months of the year tend to generate a positive return for stocks. Particularly noteworthy is the pronounced decline that tends to occur early in the year into the end of February: on average, a loss of 5 percent has been recorded (while 5% doesn’t sound like much superficially, keep in mind that this is a long term average). Reasons for this may include teething problems encountered by the new administration, or investors making a more realistic assessment of what the new administration will actually be able to achieve. Typical post-election years that involve a change in the governing party therefore suggest that there will be high volatility this year, including quite a bit of weakness into the end of February, with the market remaining difficult until the end of October. Keep in mind that the seasonal chart is an average of past market performances, hence there will be occasions when the market will end up acting differently. The purpose of seasonal charts is to help narrow down probabilities and thereby help improve investment results over the long run. After the election party, a hangover usually looms! |
Dow Jones Industrial Average, Seasonal - Filter: Custom Years(see more posts on Dow Jones Industrial Average, ) Regime Change: The Effect of Trump’s Victory on Stock Prices Dow Jones Industrial Average, seasonal pattern in post-election years since 1900 in which the new president hailed from a different party than his predecessor. A sharp decline into the end of February tends to occur when the governing party changes. Generally, volatility increases even further. Source: Seasonax - Click to enlarge |
By Dimitri Speck, the Founder of Seasonax and Head Analyst of 90 Tage Trader
Charts by: StockCharts, Seasonax
Full story here Are you the author?
Tags: Dow Jones Industrial Average,newslettersent,The Stock Market