


George Dorgan
My articles My siteAbout meMy videosMy books
Follow on:LinkedINTwitterSeeking Alpha
CFA SocietyEconomicBlogs
|
Swiss Franc Currency IndexThe Swiss Franc index has a solid performance of 2.5% in the last month, while the dollar index is down nearly 3%.
|
Trade-weighted index Swiss Franc, January 28(see more posts on Swiss Franc Index, )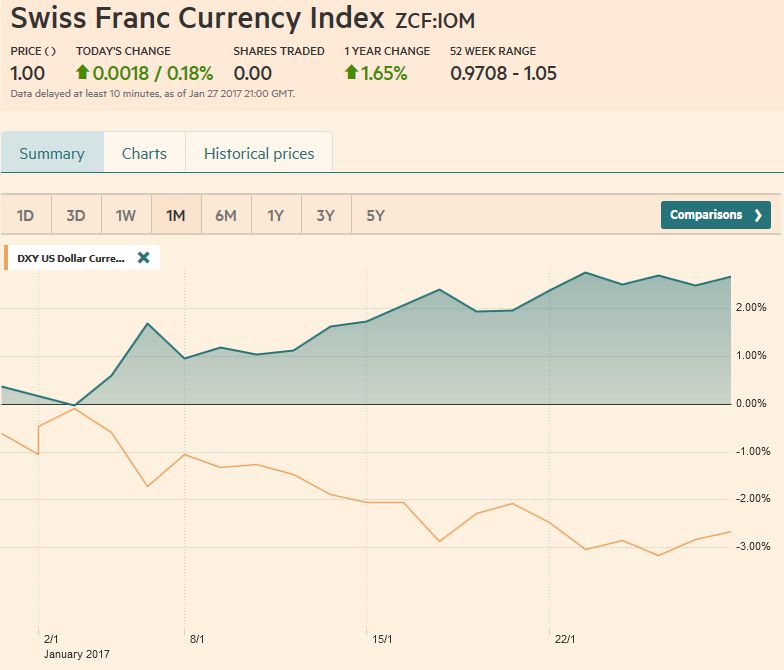 Source: markets.ft.com - Click to enlarge |
Swiss Franc Currency Index (3 years)The Swiss Franc index is the trade-weighted currency performance (see the currency basket)On a three years interval, the Swiss Franc had a weak performance. The dollar index was far stronger. The dollar makes up 33% of the SNB portfolio and 25% of Swiss exports (incl. countries like China or Arab countries that use the dollar for exchanges). Contrary to popular believe, the CHF index gained only 1.73% in 2015. It lost 9.52% in 2014, when the dollar (and yuan) strongly improved. |
Swiss Franc Currency Index (3 years), January 28(see more posts on Swiss Franc Index, ) Source: markets.ft.com - Click to enlarge |
|
Marc Chandler My articles My offerMy siteAbout meMy videosMy books Follow on:LinkedINTwitterSeeking AlphaAmazon USD/CHFThe US dollar spent the first month of the new year correcting lower after a strong advance in the last several months of 2016.
We argue that the correction actually began in mid-December following the Federal Reserve’s rate hike. Over the last two week, we have been cautioning that greenback’s downside momentum was fading and the correction was coming to an end. We retain that view and have been encouraged by the recent price action.
|
US Dollar/Swiss Franc FX Spot Rate, January 28(see more posts on USD/CHF, ) Source: markets.ft.com - Click to enlarge |
US Dollar IndexThe Dollar Index found a base 99.80-99.90. It spent the last session completely above 100 for the first time in a week. After being essentially flat the first week of the year, the Dollar Index lost 1% in the second week and 0.5% in the third week. Last week it fell about 0.25%. The fading downside momentum is not the same thing as a renewed uptrend. For that, it must move back above the 101.00-101.30 area.
A small bullish divergence is being seen in the RSI, where the new lows in the index were not matched with new lows in the technical indicator.
The MACDs and Slow Stochastics have not turned, but they have flattened out, which are still consistent with the next significant move being to the upside.
That said, a break of the 99.40-99.60 area would undermine the
constructive technical case we have been building. |
US Dollar Currency Index Dollar Index, January 28(see more posts on Dollar Index, )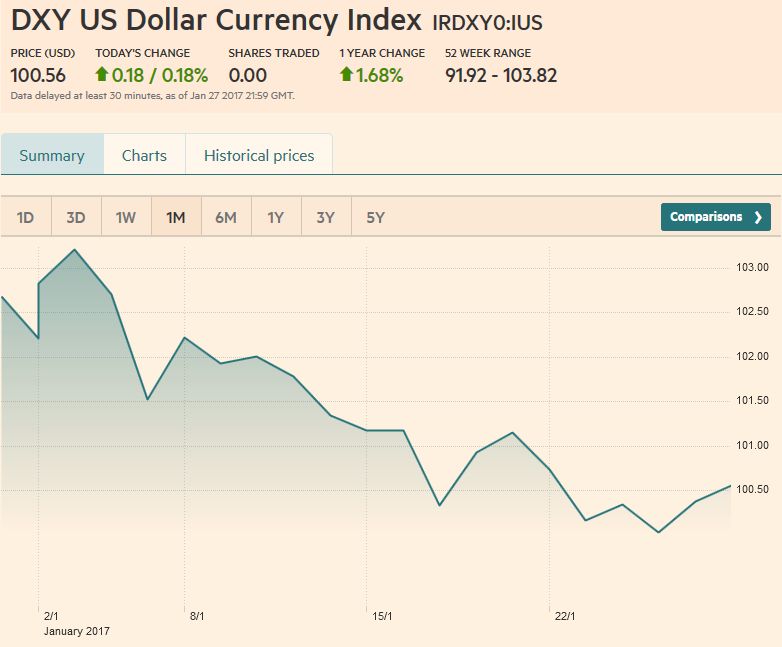 Source: markets.ft.com - Click to enlarge |
EUR/USDThe euro’s five-week advance was snapped, as the single currency finished marginally lower on the week. The euro stalled near $1.0770, in front of the 50% retracement target (~$1.0820) of the sell-off since the US election. The MACDs and Slow Stochastics have not turned down yet, but they seem poised to do so next week. The euro has not violated the trend line drawn off the January 3 low near $1.0340. It is found on Monday near $1.0675 and $1.0740 at the end of next week. We had suggested a close below $1.0660 would bolster the chances that a high is in place, but more cautious participants may want to monitor the 20-day moving average. The euro has not closed below it since January 3. It was near $1.0620 before the weekend. |
EUR/USD Week Ending January 28 with Technical Indicators(see more posts on Bollinger Bands, EUR/USD, MACDs Moving Average, RSI Relative Strength, Stochastics, )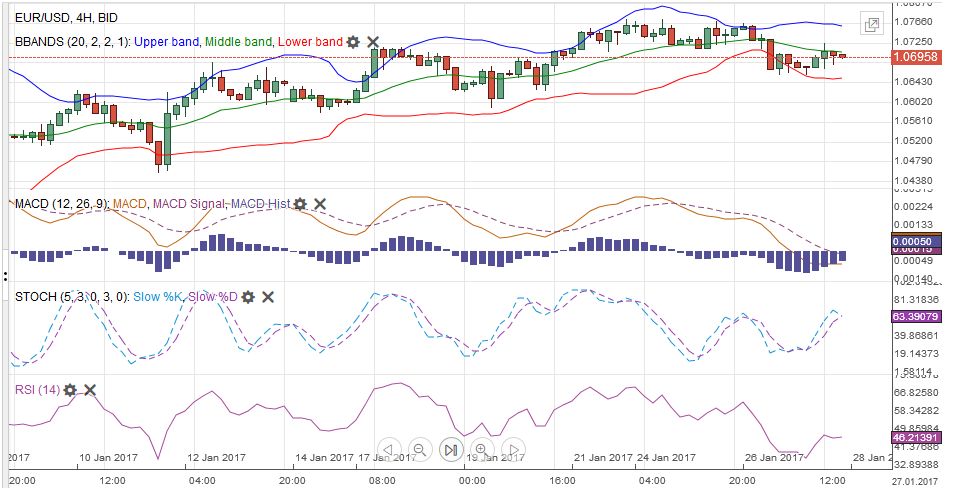 EUR/USD Week Ending January 28 with Technical Indicators - Click to enlarge |
USD/JPYThe dollar rose against the yen last week for the second consecutive week and the third advance in the past four weeks. The dominant chart pattern is a potential double bottom near JPY112.50. The neckline was formed by the high on January 19 near JPY115.60, which also corresponds with a 50% retracement objective of the dollar’s push lower from the early January high near JPY118.60. The minimum measuring objective of the double bottom projects toward that high. The dollar finished the week above the 20-day moving average (~JPY115.10) for the first time since January 4. The Slow Stochastics have turned higher, and the MACDs are poised to do so. The RSI is also trending higher. A break of JPY114.25 would be an initial indication that this constructive outlook may be wrong. |
USD/JPY Week Ending January 28 with Technical Indicators(see more posts on Bollinger Bands, Japanese yen, MACDs Moving Average, RSI Relative Strength, Stochastics, )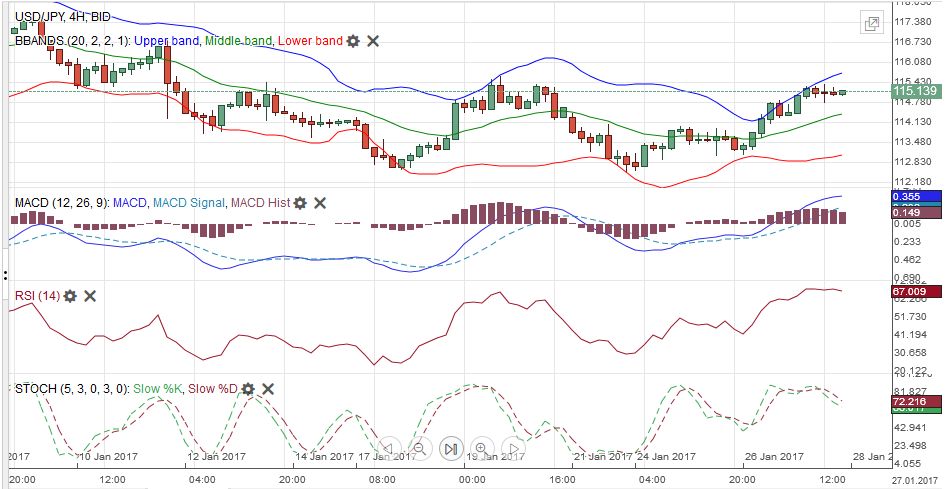 USD/JPY Week Ending January 28 with Technical Indicators - Click to enlarge |
GBP/USDFrom the January 16 gap lower opening through January 26, sterling gained almost 6% against the US dollar. It reached almost $1.2675 before running out of steam. We identified several technical considerations that suggested potential toward $1.28. First, a potential inverse head and shoulders pattern may have been carved. The neckline was near $1.2430. The second pattern is a potential flag pattern. The pole was created on January 17 rally (sell the rumor, but the fact) spurred by May’s speech. Flags fly at half-staff, and this one was formed in the following three sessions. The $1.28 area that both patterns project toward corresponds to a 61.8% retracement of sterling’s decline from the early September high near $1.3450. It is too early to give up on the $1.28 target, but if it is not seen soon, the risk is of a setback. The Slow Stochastics and MACDs are still rising but could turn down on additional weakness. Initial support is seen a little ahead of $1.2500, and a break of $1.2450 would also boost the risk that a high is in place. |
GBP/USD Week Ending January 28 with Technical Indicators(see more posts on Bollinger Bands, British Pound, MACDs Moving Average, RSI Relative Strength, Stochastics, )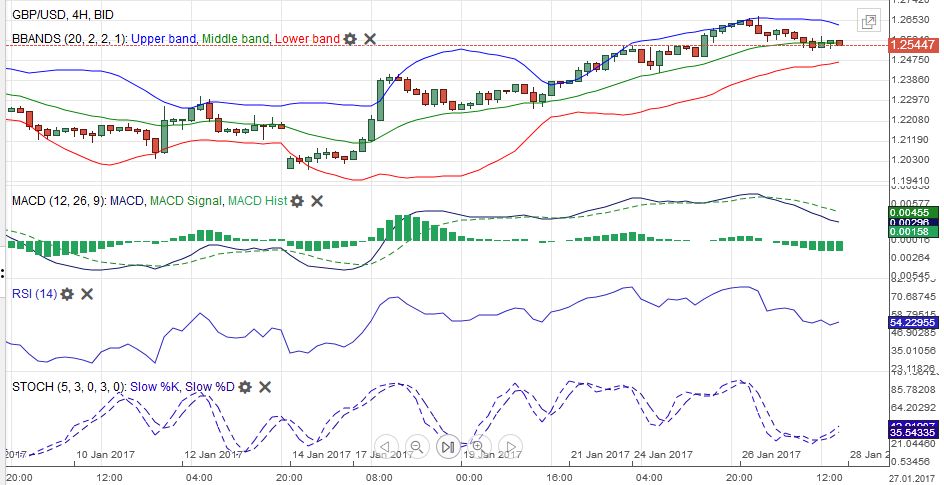 GBP/USD Week Ending January 28 with Technical Indicators - Click to enlarge |
AUD/USDThrough the start of last week, the Australian dollar had gained about 4.5 cents (~6.25%). The pullback, partly spurred by the slightly softer than expected Q4 CPI has been modest; limited to about one cent (~$0.7500). While there may be another attempt on the $0.7600, we expect it to fall short and see the underlying technical tone as fragile. The Aussie finished last week with two successive closes below its five-day moving average for the first time this month, illustrating the easing momentum. The Slow Stochastics have begun turning lower. The MACDs look set to turn lower. It follows a strong run. The initial retracement target is near $0.7440, which is near the 20-day moving average. Economic reports showing a deterioration of its trade balance and that building approvals faded in December could fan expectations of a more dovish tone from the RBA when it meets on February 6. |
AUD/USD Week Ending January 28 with Technical Indicators(see more posts on Australian Dollar, Bollinger Bands, MACDs Moving Average, RSI Relative Strength, Stochastics, ) AUD/USD Week Ending January 28 with Technical Indicators - Click to enlarge |
USD/CADThe Canadian dollar was the strongest major currency up about 1.5%. The only currency in the world to have done better, ironically, was the Mexican peso, which gained 3.3% against the dollar despite the increased tensions between Mexico and the United States over immigration and trade. It is the third weekly advance for the Canadian dollar in the past four. The US yield premium over Canada stabilized this month and had narrowed slightly over the course of the month at both at two-year and 10-year tenors. The Canadian dollar may have been more support by the US reversing an early decision and endorsing two new oil pipelines than oil prices that chopped around but hardly moving net-net. The US dollar was sold through CAD1.3100 before finding support. To push the dollar back below CAD1.30 may require some significant developments, so when it trades much below CAD1.31, the risk-reward considerations change for short and medium term participants. The technical indicators are not generating a consistent signal, but our sense is that the US dollar can recover further against its Northern neighbor. A move above CAD1.3200, and ideally CAD1.3260, would |
USD/CAD Week Ending January 28 with Technical Indicators(see more posts on Bollinger Bands, Canadian Dollar, MACDs Moving Average, RSI Relative Strength, Stochastics, )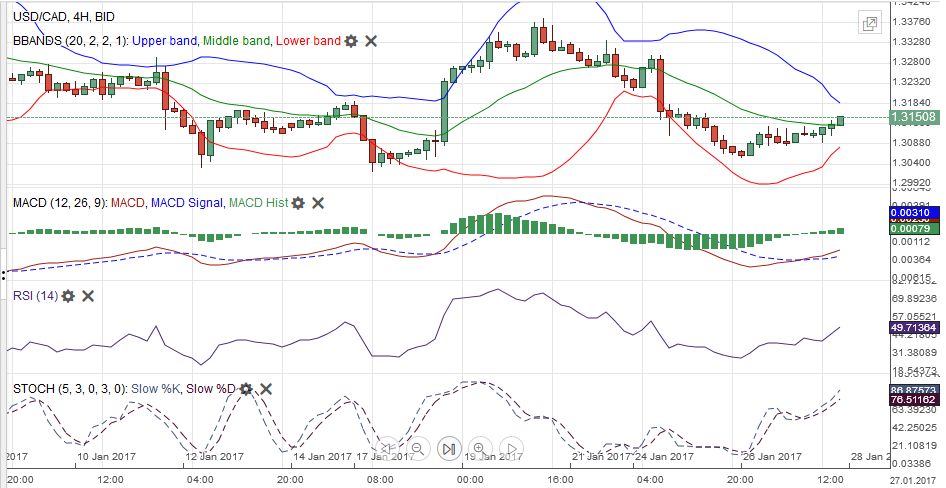 USD/CAD Week Ending January 28 with Technical Indicators - Click to enlarge |
Crude OilThe March light sweet oil futures contract continues to choppy around a well-worn range. An outside day was recorded before the weekend, but close, while lower, was neutral. The week was spent alternating between losses and gains. Despite the pre-weekend decline, the technical tone is constructive. The Slow Stochastics have turned higher, and the MACDs will likely follow suit next week. The five-day moving average looks poised to cross above the 20-day. average. One of the things that may have weighed on sentiment was the inventory build for three consecutive weeks, and last week’s build was nearly 2.85 mln barrels, or twice what was expected. The oil rig count also rose and at 566 is the highest |
Crude Oil, January 28(see more posts on Crude Oil, )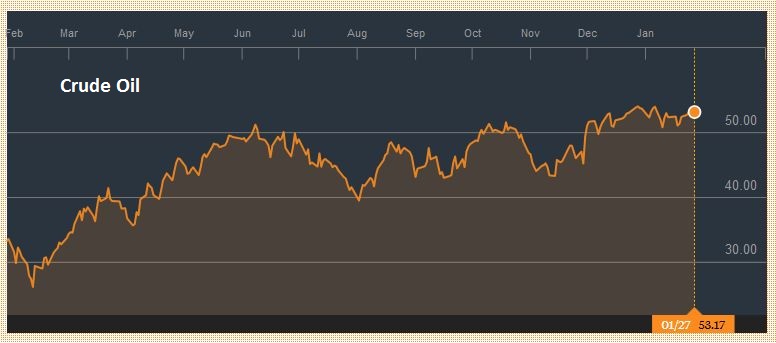 Source: bloomberg.com - Click to enlarge |
U.S. TreasuriesThe US 10-year yield recovered from the test on 2.30% on January 12 and January 17 to reach 2.56% where is stalled ahead of the weekend after than expected Q4 GDP report. The weak close before the weekend warns of additional slippage before the weekend, but the prospect of a robust jobs report (with firm hourly earnings growth) should deter declines beyond around 2.43%. The March note futures can extend its recovery from the 123-18 low on January 26 toward 124-16 without doing much to improve the technical tone, but a move above 125 would suggest a more protracted correction to the sell-off seen since the US election. In that case, potential extends toward 126-16. |
Yield US Treasuries 10 years, January 28(see more posts on U.S. Treasuries, )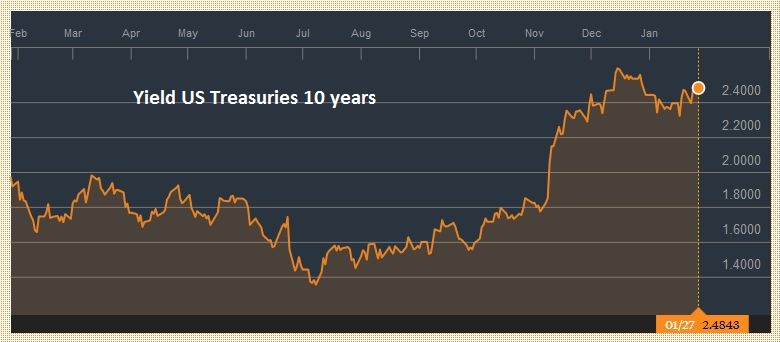 Source: bloomberg.com - Click to enlarge |
S&P 500 IndexDespite easing for the past two sessions, the S&P 500 gained about 1% last week. After unfilled gap created by Wednesday’s higher opening appears to be sucking the momentum out of the market. The gap is found between 2284.63 and 2288.88. The most bearish development is for the S&P 500 to gap lower, leaving an island top in its wake. The technical indicators are not generating strong signals. The proximity of the upper Bollinger Band, just below 2300, and the heavy close, suggests that rather than being a breakaway gap, as we initially favored, it may be a normal gap, meaning that it may be filling in the near-term. |
S&P 500 Index, January 28(see more posts on S&P 500 Index, )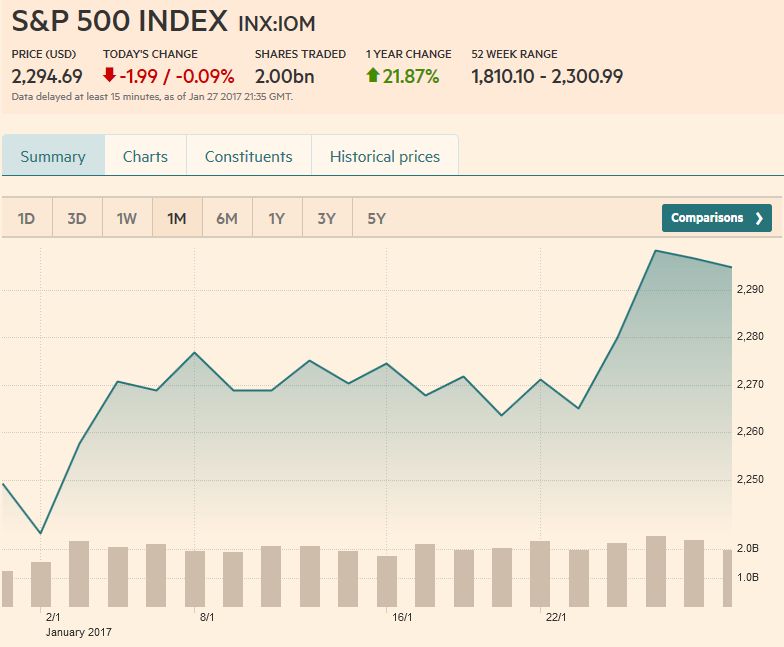 Source: markets.ft.com - Click to enlarge |
Are you the author?
Tags: Australian Dollar,Bollinger Bands,British Pound,Canadian Dollar,Crude Oil,Dollar Index,EUR/CHF,EUR/USD,Euro,Euro Dollar,Japanese yen,MACDs Moving Average,newslettersent,RSI Relative Strength,S&P 500 Index,Stochastics,Swiss Franc Index,U.S. Treasuries,USD/CHF,USD/JPY


