


George Dorgan
My articles My siteAbout meMy videosMy books
Follow on:LinkedINTwitterSeeking Alpha
CFA SocietyEconomicBlogs
Swiss Franc Currency Index and the Trump Reflation TradeThe Swiss Franc Index rose sharply, shortly after the U.S. elections. But then the Trump reflation trade came. Trump may fulfills the wet dreams of many economists. With tax cuts he might extend the U.S. fiscal deficit up to 10% per year. This resulted in:
|
Trade-weighted index Swiss Franc, November 11, 2016(see more posts on Swiss Franc Index, )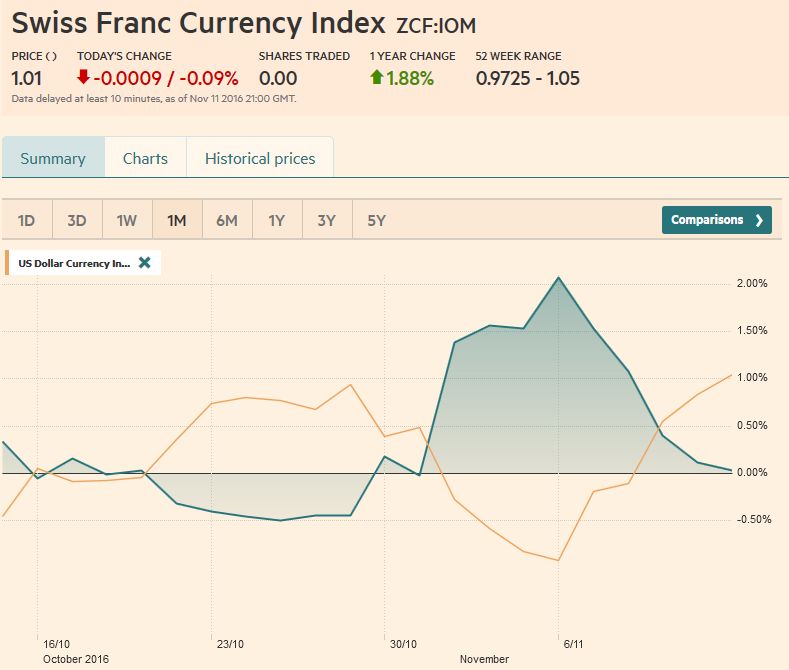 . Source: FT.com - Click to enlarge |
Inactive Swiss National BankDespite expectations of big interventions, the SNB was not very active. Inflows happened rather into Swiss pharma stocks, but into sight deposits. Small changes in SNB sight deposits meant, that the SNB did not have new funding for FX interventions. Hence she was obliged to let the EUR/CHF float down to lows of 1.0709.
|
EUR/CHF - Euro Swiss Franc, November 11(see more posts on EUR/CHF, ) . - Click to enlarge |
Marc Chandler My articles My offerMy siteAbout meMy videosMy books Follow on:LinkedINTwitterSeeking AlphaAmazon USD/CHFOur bull case for the US dollar has been predicated on the divergence of monetary policy and the relative health of the financial system. What is new, and investors are anticipating, is fiscal policy.
After several years of reducing the budget deficit, both Trump and Clinton promised fiscal stimulus. Trump offered more infrastructure spending and tax cuts than Clinton. His economic team, though formal appointments have yet to be announced, suggests $1 trillion fiscal stimuli (~6% of GDP), which is larger than even Sanders advocated in the primaries.
At the same time, investors are more confident of a Fed hike next month. But more than that, the derivatives market is beginning to price in a more aggressive Fed. A few days before the election, investors learned that average hourly earnings rose by 2.8% year-over-year. This is the fastest in several years, and although one month a trend does not make, it is consistent with a tightening of the labor market, and rising core inflation pressures.
This policy mix, tighter monetary policy and looser fiscal policy, is the most constructive combination for a currency. The magnitudes may be different, but that was the Reagan-Volcker mix that fueled the dollar rally of the early 1980s. It was also the policy mix that Germany pursued after the Berlin Wall fell. That policy mix led to the dramatic appreciation of the German mark and precipitated the European currency crisis, which itself gave impetus to the Maastricht Treaty and the birth of monetary union.
|
US Dollar-Swiss Franc FX Spot Rate, November 11 2016(see more posts on USD/CHF, ) . - Click to enlarge |
US Dollar Index
The US dollar rose against all the major currencies last week but sterling, which was bolstered by the unwinding of the long euro and short pound positions. The US Dollar Index rose each day last week, after falling for the previous four sessions. We had anticipated the dollar to have sold off if Trump was elected. We were close to the magnitude of the Dollar Index but was surprised at how quick it recovered.
Last week, we had suggested an initial retracement target near 96.60 and thought if that went, there could be a test on a trendline that came in near 95.80 on November 10. In the immediate reaction to the election news, the Dollar Index was a little below 95.90.
Despite the dramatic recovery and the five-day advancing streak, the technical indicators signal generated by the RSI, MACDs, and Slow Stochastics point to scope for additional gains. There are a few levels that offer near-term targets. The high for the year, set in January is near 99.85 and the high from March and December last year was around 100.50. Over the somewhat longer term, we note that the 101.80 area is the 61.8% retracement of the decline from 2000 when it peaked near 121.
|
US Dollar Currency Index Dollar Index, November 11(see more posts on Dollar Index, ) . - Click to enlarge |
EUR/USDThe euro closed at 1.1140 on November 4. We had thought it could spike to $1.14-$1.15. It made it up to $1.13 before reversing sharply. It fell each day last week (-2.8%) and made the lows for the week just before the weekend near $1.0830. The technical indicators warn against picking a bottom. Although the lower Bollinger Band comes in near $1.08 and that is a psychological level that marked congestion in the past, support looks fragile. The lows from last year in the $1.0460-$1.0560 area may be a more important target. At this juncture, we see little reason to revise our long-term expectation that the |
Euro/US Dollar FX Spot Rate, November 11(see more posts on EUR/USD, )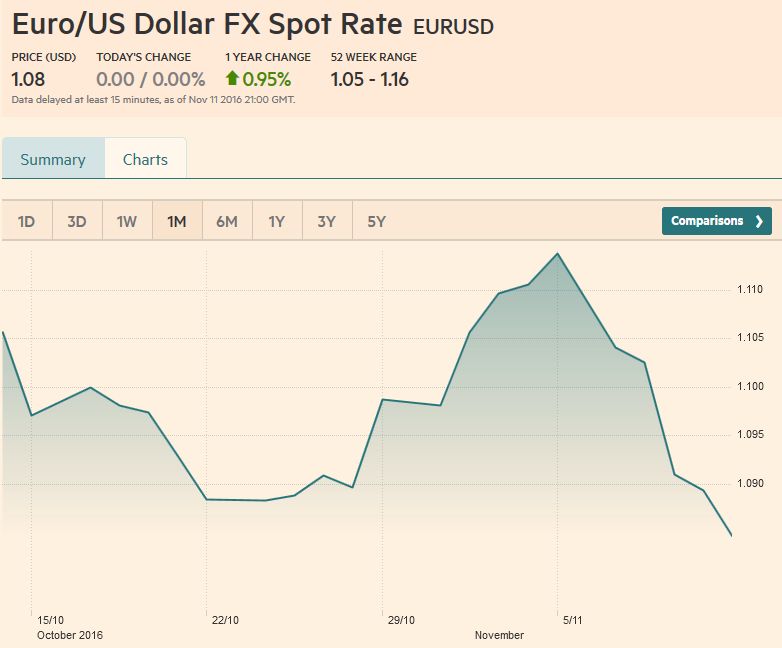 . - Click to enlarge |
USD/JPYThe dramatically higher US interest rates helped boost the dollar against the yen. The dollar snapped a five-day advancing streak against the yen before the weekend, but the pullback was minor, and it held above the previous highs. The greenback had dropped to nearly JPY101.20 from about JPY105.20 in the immediate reaction to the US election news. It rebounded smartly before stalling near JPY107, ahead of the July high near JPY107.50. The dollar closed above the 200-day moving average (~JPY106.20) for the first time this year. Technical indicators are aligned for more dollar gains. The note of caution may come from the Bollinger Bands. The dollar closed above the upper band for the last two sessions, for the first time since February. |
US Dollar / Japanese Yen FX Spot Rate, November 11(see more posts on USD/JPY, )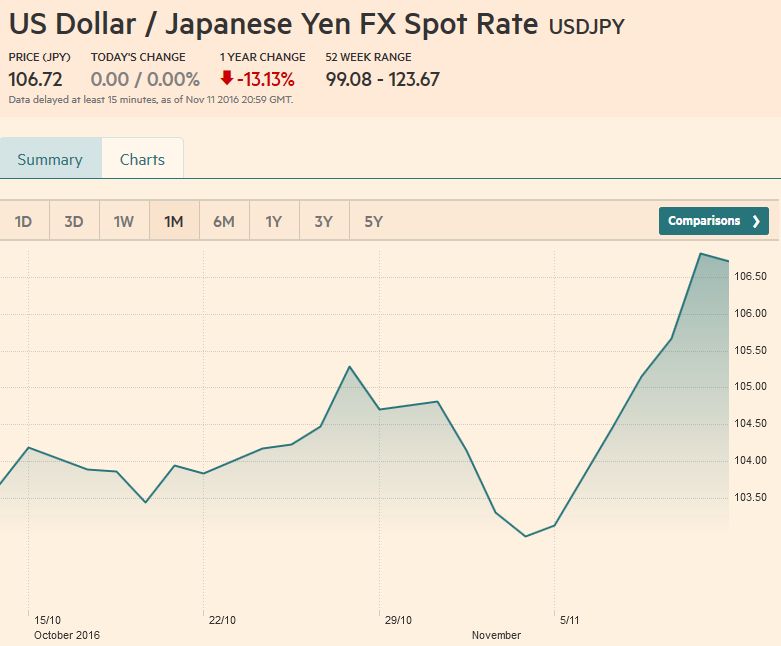 . - Click to enlarge |
GBP/USDSterling was the strongest of the majors. It gained about 0.75% against the dollar and around 3.25% against the euro. Against the dollar, sterling began the week with a downside bias after rising for the previous six sessions (October 28 through November 4). It finished last week with a three-day rally that saw it surpass the flash crash high (~$1.2625) and through the 50% retracement of the leg down that began near $1.3445 in early September ($1.2645). The 61.8% retracement is near $1.2830. Sterling’s low in early July near $1.2800 was not taken out until October. The technical indicators we look at are mixed. The RSI and MACDs do not indicate a top is at hand, while the Slow Stochastics appear to be about to turn lower and sterling closed above the upper Bollinger Band (~$1.2575). |
UK Pound Sterling / US Dollar FX Spot Rate, November 11(see more posts on British Pound, )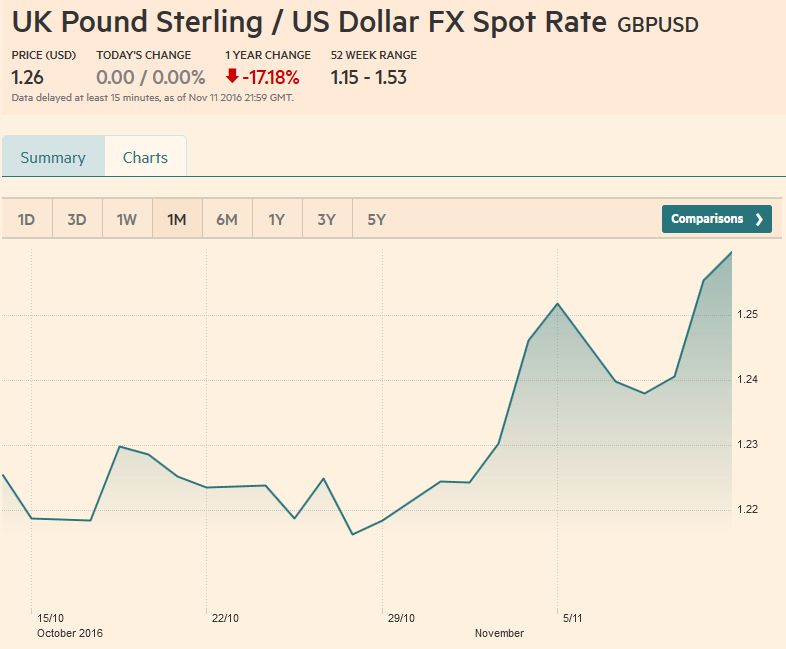 . - Click to enlarge |
AUD/USDWe have had a bearish bias toward the Australian dollar for several months with little satisfaction. It has been largely in a $0.7500-$0.7700 trading range. The sharp rise in US (and global) yields may (finally) spur a breakout. Before the election, the Aussie did edge to its highest level since April (almost $0.7780) but it finished the week at its lowest level in a month, having fallen to $0.7525. A below the $0.7440-$0.7460 band may be needed to confirm the break. The technical indicators favor additional near-term losses.
|
AUD/USD FX Rate Chart, November 11(see more posts on Australian Dollar, )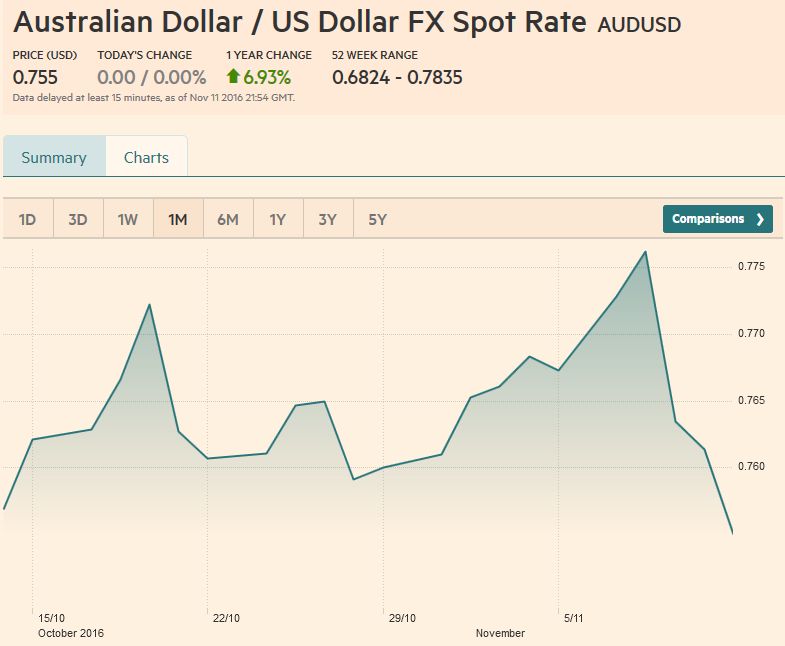 . - Click to enlarge |
USD/CADThe combination of rising US rates, the prospect of the US re-opening NAFTA, and drop in oil prices sent the Canadian dollar to its lowest level in eight months. Our medium-term objective, the 50% retracement of the US dollar sell-off from the multi-year high was set in late-January (~CAD1.3575) was approached. The 61.8% retracement is CAD1.3840. The Slow Stochastics turned lower a week ago, but the RSI and MACDs are still moving higher. Perhaps the US dollar can rise toward CAD1.3640 before a correction is seen. |
USD/CAD FX Rate Chart, November 11(see more posts on Canadian Dollar, )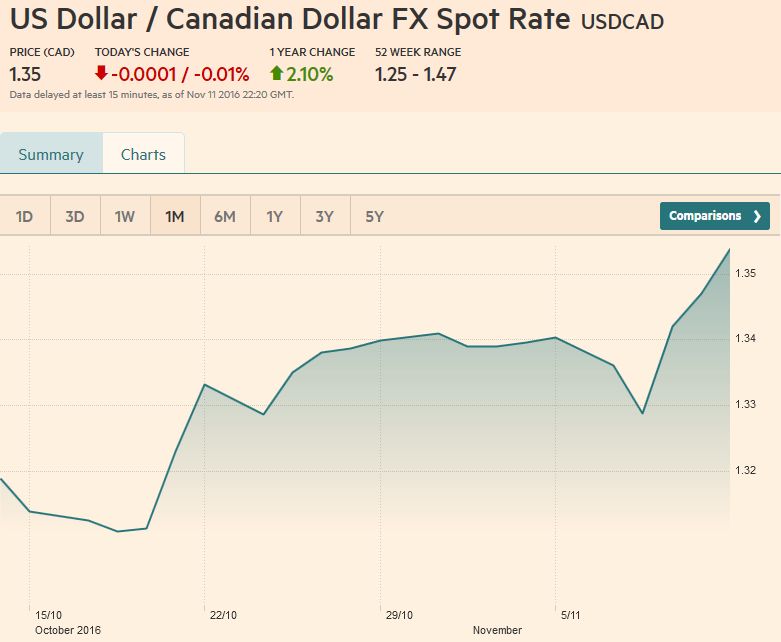 . - Click to enlarge |
Crude OilThe December light sweet crude oil futures contract had a promising start last week. It rose by about 2.7% in the first three days, stringing together its first back-to-back gain since October 18-19. However, the rising dollar and news that Iran and Iraq, who want to be exempt from OPEC output cuts, boosted output last month by as much as 425k barrels, a day gave investors more reasons to doubt OPEC’s ability/willingness to stabilize the market. The contract posted its weakest closing low since the key upside reversal on August 2. There is little in the way of a test on the $41.50 area, which corresponds to that low, the mid-April spike low, and 61.8% retracement of this year’s rally. |
Crude Oil, November 11(see more posts on Crude Oil, )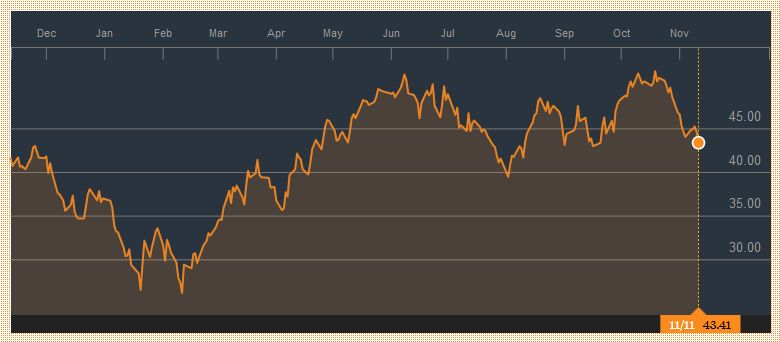 . - Click to enlarge |
U.S. TreasuriesThe US 10-year yield rose 38 bp last week, which was shortened by a day due to the holiday before the weekend. In percentage terms, it is the largest move in at least two decades. It convincingly violated the downtrend from early 2014, the last time the yield was above 3%. The December note futures looks poised for additional losses. Without a cash market before the weekend, the futures contract shed almost a half point. After finishing the previous week at 130-08, it closed last week at 127-05. The next area of support is near 126-00 and then 125-15.
|
Yield US Treasuries 10 years, November 11(see more posts on U.S. Treasuries, )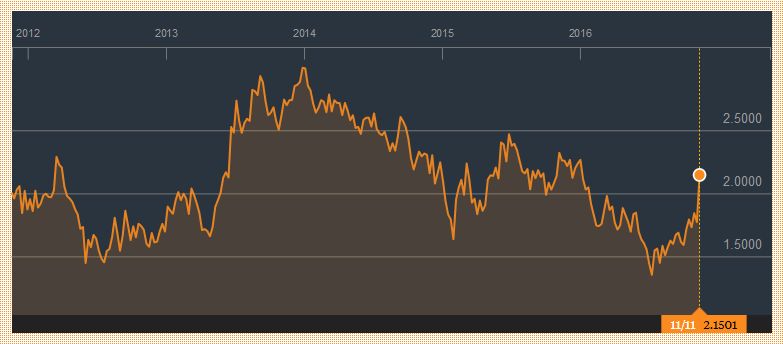 . - Click to enlarge |
S&P 500 Index
|
S&P 500 Index, November 11(see more posts on S&P 500 Index, )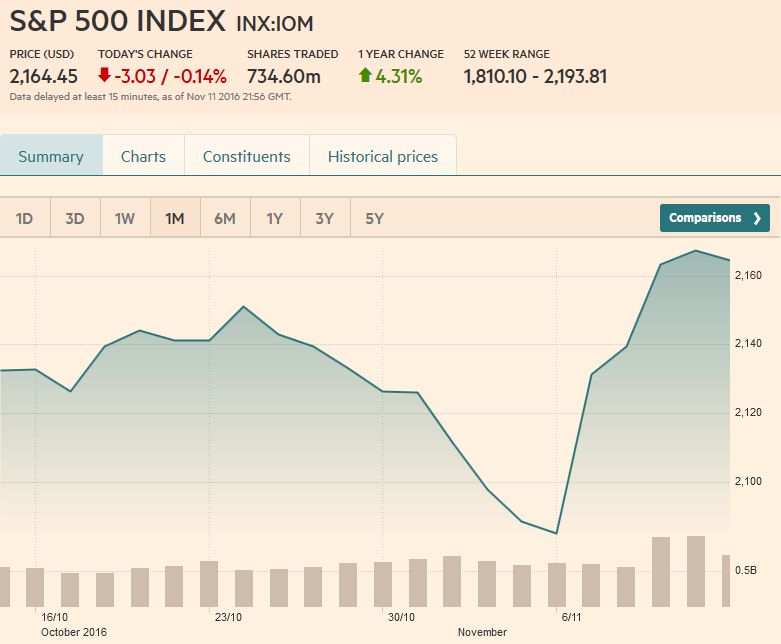 . - Click to enlarge |
Are you the author?
Tags: Australian Dollar,British Pound,Canadian Dollar,Crude Oil,Dollar Index,EUR/CHF,EUR/USD,Euro,Japanese yen,MACDs Moving Average,S&P 500 Index,Swiss Franc Index,U.S. Treasuries,usd-jpy,USD/CHF,USD/JPY


