George Dorgan
My articles My siteAbout meMy videosMy books
Follow on:LinkedINTwitterSeeking Alpha
CFA SocietyEconomicBlogs
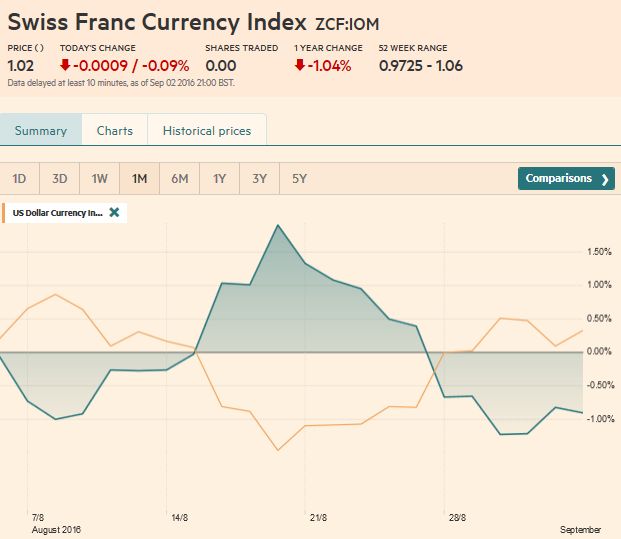
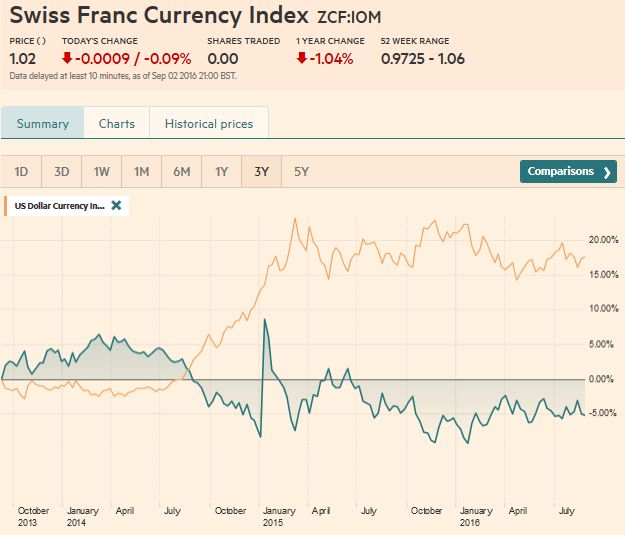
Swiss Franc Currency IndexDuring this week the Swiss Franc index lost against both dollar and euro. The CHF index ended one percent down. Despite not convincing US jobs, the dollar index ended in positive territory.
|
 Click to enlarge. |
|
Swiss Franc Currency Index (3 years)The Swiss Franc index is the trade-weighted currency performance (see the currency basket)On a three years interval, the Swiss Franc had a weak performance. The dollar index was far stronger. The dollar makes up 33% of the SNB portfolio and 25% of Swiss exports (incl. countries like China or Arab countries that use the dollar for exchanges). Contrary to popular believe, the CHF index gained only 1.73% in 2015. It lost 9.52% in 2014, when the dollar (and yuan) strongly improved.
|
 Swiss Franc Currency Index, Click to enlarge. |
Marc Chandler My articles My offerMy siteAbout meMy videosMy books Follow on:LinkedINTwitterSeeking AlphaAmazon USD/CHF:
|
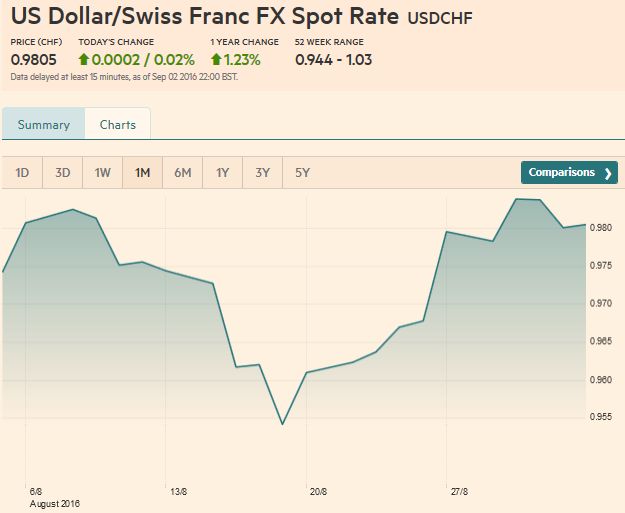 USD/CHF Click to enlarge. |
US DollarThe US Dollar Index slipped to new lows for the week. That low just below 95.20, which is also the 100-day moving average, completed a 50% retracement of the rally at the spurred by Yellen and Fischer’s comments from Jackson Hole on August 26. The 61.8% retracement is found near 95.00.
Initial resistance is seen near 95.85, but it will take a break of this week’s high of almost 96.25, which also corresponds to the 200-day moving average, to signal a resumption of the dollar’s advance.
|
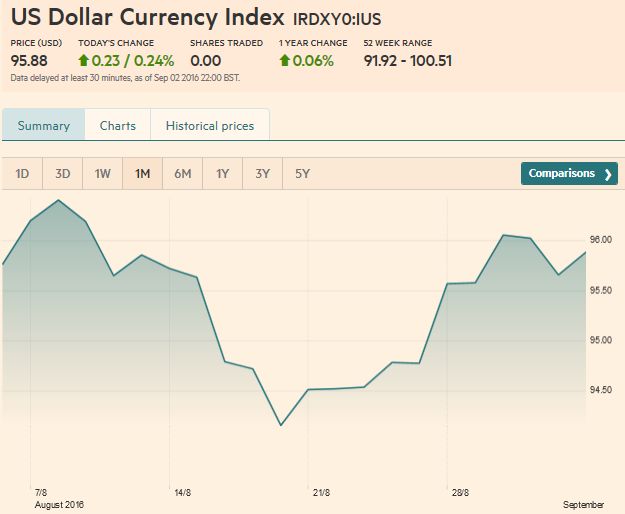 USD Dollar Index, Click to enlarge. |
EUR/USDThe euro recovered from the midweek low of nearly $1.1120 to $1.1250 after the US employment data. The $1.1260 area corresponds to a 61.8% retracement of the Yellen-Fischer spurred decline. At $1.1245 the euro retraced 50% of the decline since the August high near $1.1365. With reasonable prospects of ECB action, and still lingering ideas that the employment data is sufficient for the FOMC, participants may be hesitant about pushing the euro much above that $1.1250 area. The $1.1100-$1.1150 band may cushion losses. The 200-day moving average is found in the middle of that band. A break of $1.11 could set up a test on the August low by $1.1045. |
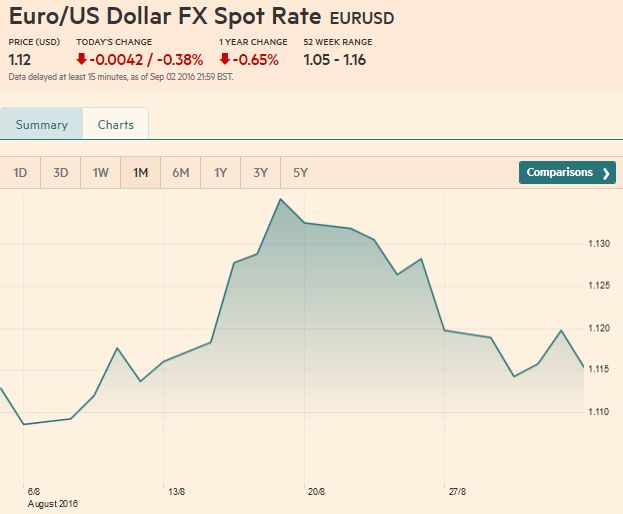 EUR/USD, Click to enlarge. |
USD/JPYThe dollar has been particularly resilient against the yen. It posted an outside up day. The dollar was testing JPY100 before Yellen/Fischer, and after a little hiccup on the jobs data (saw JPY102.80), it recovered to make new session highs a little below JPY104. A trendline drawn off the late-May high (~JPY111.45) and the mid-July high (~JPY107.50) is found near JPY104.30 at the start of the new week and JPY103.80 by the end of the week. The 61.8% retracement of the drop since that mid-July high is JPY104.45. A break of that area may spur a move toward JPY105.50. |
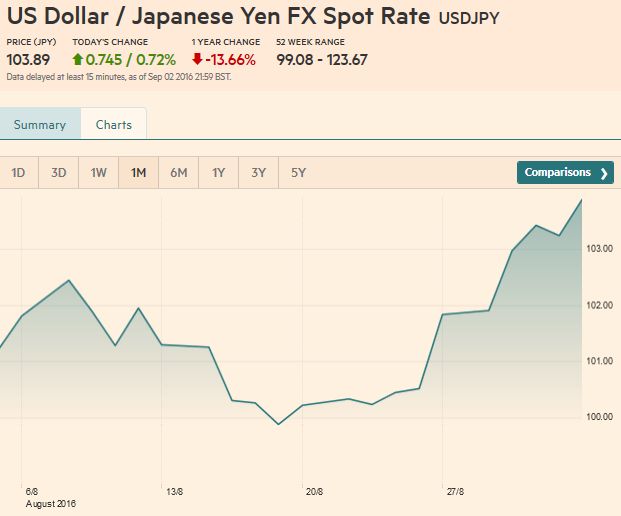 Click to enlarge. |
GBP/USD
|
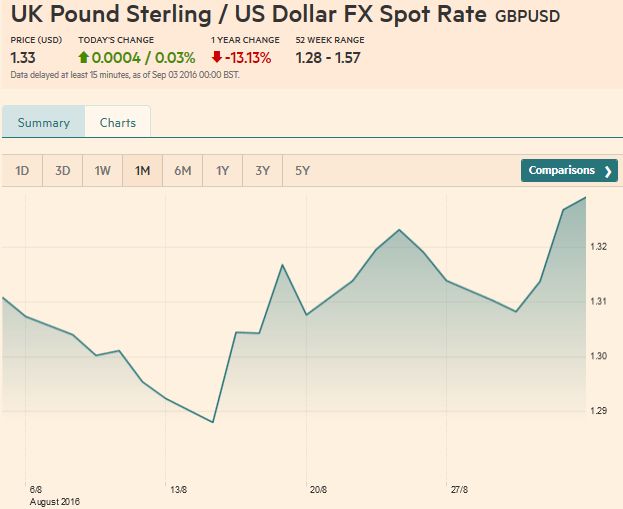 Click to enlarge. |
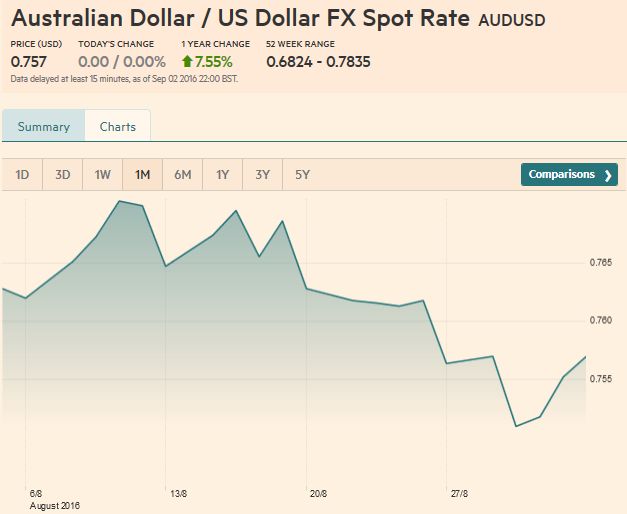
AUD/USDThe Australian dollar looked like it had legs. It stopped short of the 20-day moving average (~$0.7620), which also corresponds to the 50% retacement of the Aussie’s erosion since $0.7750 was approached in mid-August. Support is seen in the $0.7490-$0.7500 area. A break would open the door toward
|
|
USD/CADWeak economic data, the drop in oil prices, and the prospect of a Fed hike has kept the Canadian dollar on the defensive since the middle of August. The US dollar approached the CAD1.3150 |
US Dollar - Canadian Dollar FX Rate(see more posts on Canadian Dollar, )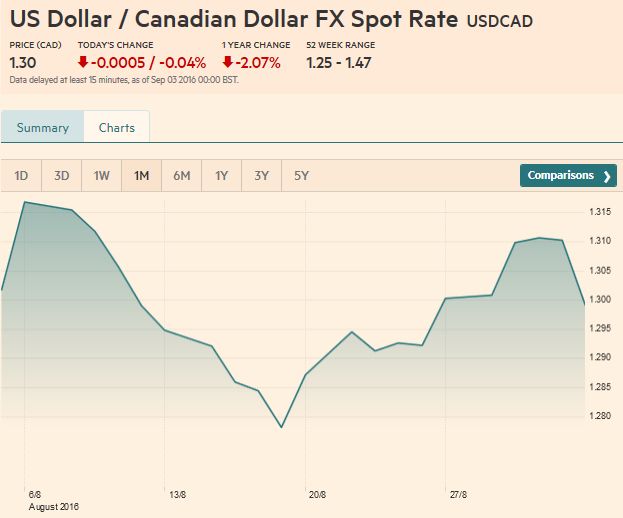 Click to enlarge. |
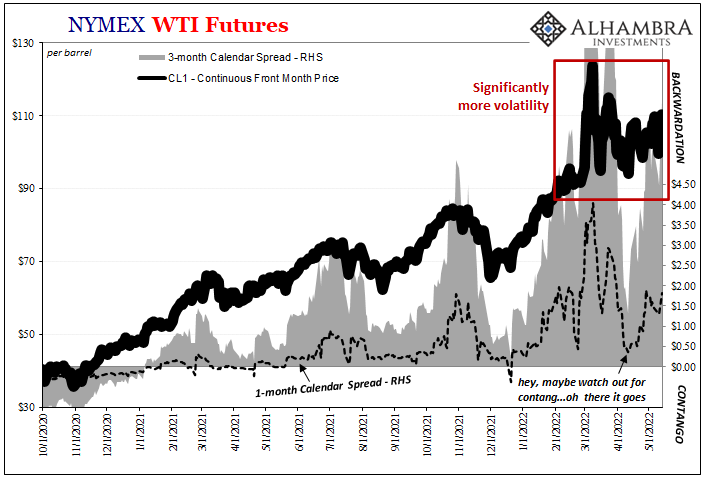
Crude Oil
|
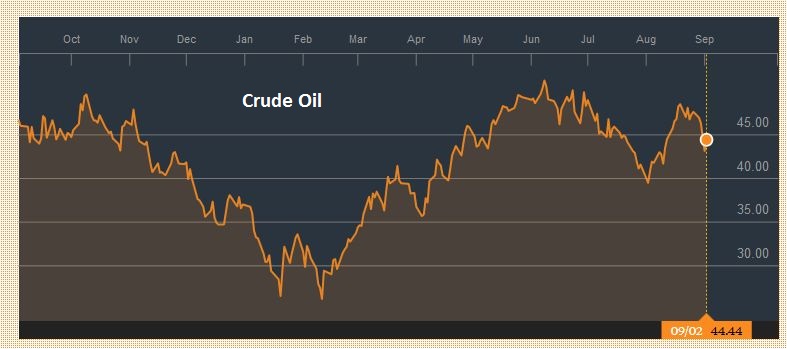 Click to enlarge. |
US TreasuriesThe US 10-year Treasury yield made both the high and low prints for the week after the jobs data (1.54% and 1.62%). The December note future made the high for the week before the weekend, but it held just above the week’s low of 130-14. Below there the 130-00 may attract interest (131-00 basis the The Sept Bund futures contract finished the week below an uptrend line that began in late-April. The Sept JGB futures contract broke down to post its lowest close since March, amid speculation that the BOJ may slow its purchases of long-term bonds ostensibly to force a re-steepening of the yield curve.
|
Yield US Treasuries(see more posts on U.S. Treasuries, )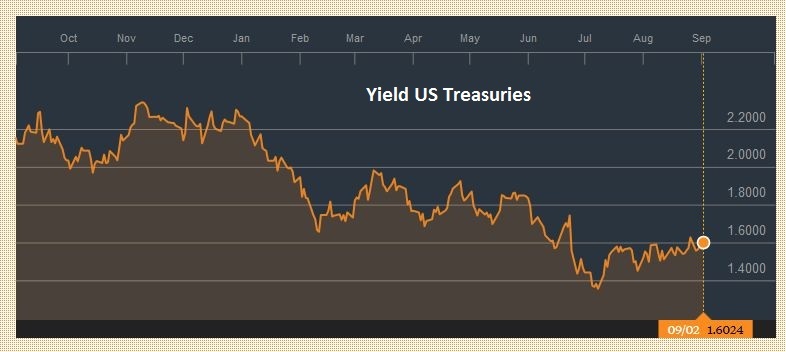 Click to enlarge. |
S&P 500 Index
|
S&P 500 Index(see more posts on S&P 500 Index, )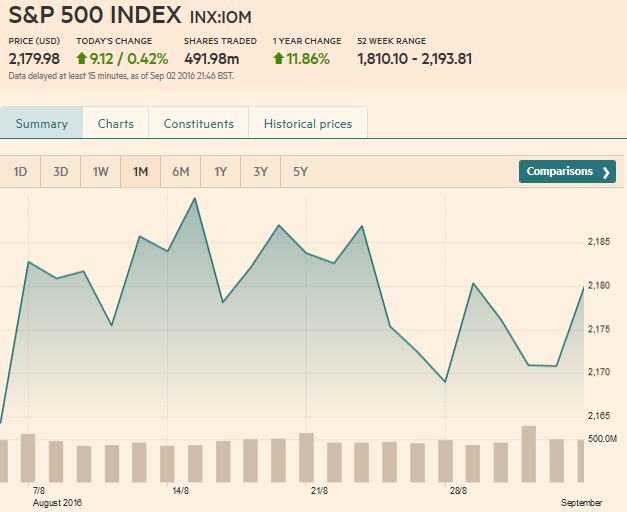 Click to enlarge. |
Charts and CHF data added by George Dorgan and the snbchf team, Text Posted by Marc Chandler on Marc to Markets.
Are you the author?Tags: Australian Dollar,Canadian Dollar,Crude Oil,Dollar Index,EUR/CHF,EUR/USD,MACDs Moving Average,newslettersent,S&P 500 Index,Swiss Franc Index,U.S. Treasuries,USD/CHF