Marc Chandler
My articles My offerMy siteAbout meMy videosMy books
Follow on:LinkedINTwitterSeeking AlphaAmazon
| Upward pressure on US consumer prices is stemming from two elements. Rents and medical services. Due to the differences the composition of the basket of goods and services that are used, the core personal consumption deflator, which the Fed targets, typically lags behind core CPI.
At is time of year, the concern tends to be on health care costs and premiums. Many US employees are given “open enrollment” when they can change their health care benefits. This Great Graphic comes from Kaiser Family Foundation’s Employer Health Benefit Survey. It shows three five-year periods. The amber bar is the cumulative increase in for employer-provided health care premium. The dark blue bar is the cumulative increase in inflation, while the lighter blue bar is the cumulative growth in employee earnings. What chart shows is that the increase in premiums has slowed, though it is still easily outpacing overall inflation and the increase in our earnings. In 2001-2006, premiums rose a cumulative 63%. The paces was halved in the next five year-period. From 2011 through this year, premiums rose 20%. Cumulative wage growth was 15%, 16% and most recently 11%. The cumulative increase in prices was 14%, 12% and 6% for the three periods respectively. Premiums are set to rise again. In New York state, the insurance providers have petitioned the government all a 17% increase in premiums. There is another dimension of the issue. How should the rising premium be divided between employer and employee? This is not an economic issue, but of politics and power. The stronger force will seek to shift the burden to the weaker force. Consider 1999. According to figures from Kaiser’s survey, the premium for all businesses to provide a family with health care benefits was $5790. This was divided between the employee, who paid $1543 and the employer, who picked up the remaining $4247. The employee paid 26.6% of the overall premium. Fast forward to this year. Kaiser’s figures suggest it cost $18, 142 to provide health care insurance for a family. The employee paid $5277 and the employer paid $12, 865. The employee’s share increased to 29.0%. This aggregate look, however, conceals, a big difference between small (3-199 employees) and large (200 or more employees) firms. A small firm may actually experience a smaller overall premium than large firms ($17,546 vs $18,395). Small business pass a greater share to its employees (37.6%) compared with large businesses (25.6%). |
Premium Increases, Overall Inflation, Workers Earnings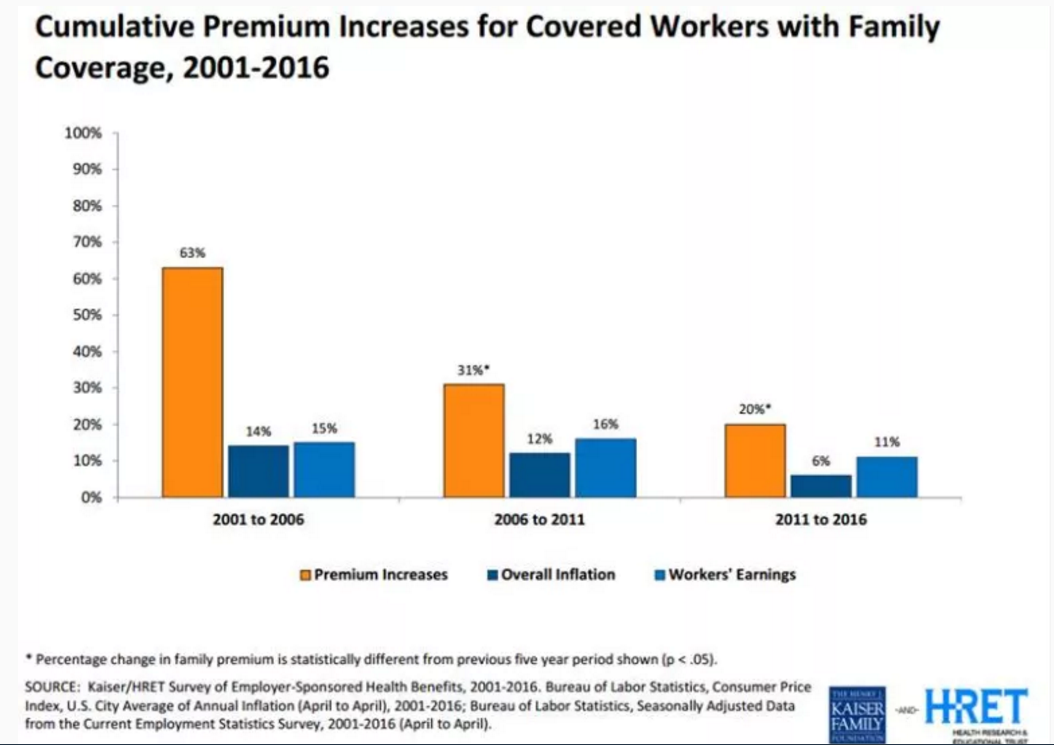 Click to enlarge. - Click to enlarge |
Full story here Are you the author?
Tags: Great Graphic,newslettersent