George Dorgan
My articles My siteAbout meMy videosMy books
Follow on:LinkedINTwitterSeeking Alpha
CFA SocietyEconomicBlogs
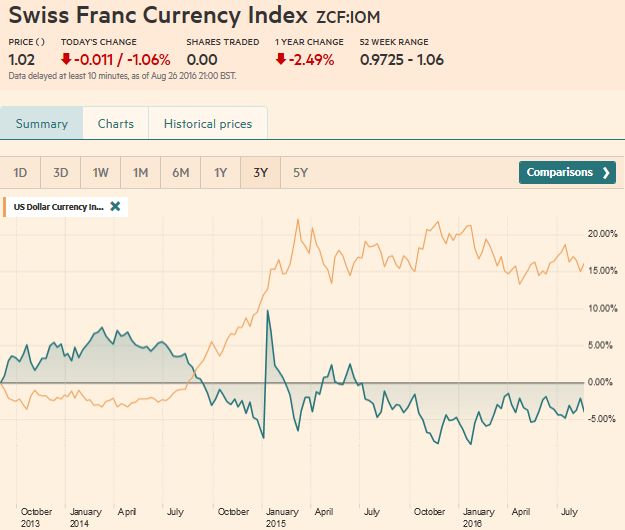
Swiss Franc Currency IndexLast week, the Swiss Franc Index achieved big gains. But this week, most of the gains got lost again. The CHF index monthly balance is still positive with a 0.7% improvement. The reason is that the probability of a Fed hike increased.
|
Swiss Franc Index(see more posts on Swiss Franc Index) 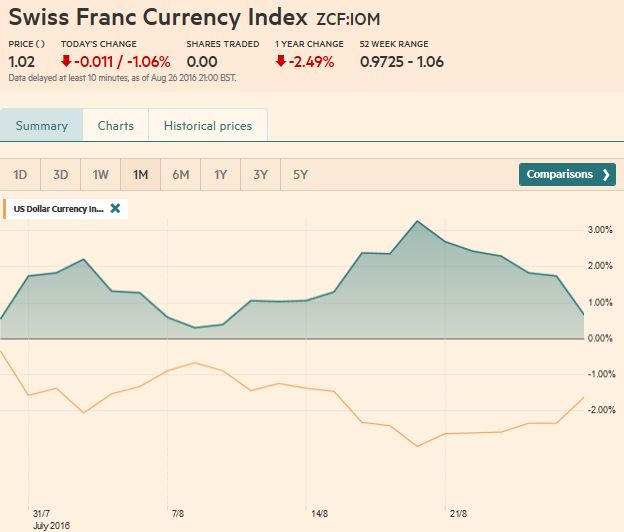 Click to enlarge. |
|
Swiss Franc Currency Index (3 years)The Swiss Franc index is the trade-weighted currency performance (see the currency basket)On a three years interval, the Swiss Franc had a weak performance. The dollar index was far stronger. The dollar makes up 33% of the SNB portfolio and 25% of Swiss exports (incl. countries like China or Arab countries that use the dollar for exchanges). Contrary to popular believe, the CHF index gained only 1.73% in 2015. It lost 9.52% in 2014, when the dollar (and yuan) strongly improved.
|
 Click to enlarge. |
USD/CHF: Franc loses AgainThe US dollar had spent the last full week of August mostly confined to narrow trading ranges against the major currencies until the Yellen spoke as at the end of the week. Yellen confirmed the constructive assessment of the economy already offered by both Fischer and Dudley in recent days. While acknowledging that the case of a rate hike was strengthening, she shed no light on the timeframe. The tone of her remarks suggested scope only one hike this year, not
the two that the Fed dot plots pointed to in June. However, Fischer quickly and explicitly noted that nothing Yellen said ruled out a September move of two moves this year for that matter.
The probability of a Fed hike increased. Hence, similarly to the Swiss Franc index, the franc fell. The dollar improved from 0.955 to 0.98.
|
USD/CHF(see more posts on USD/CHF) 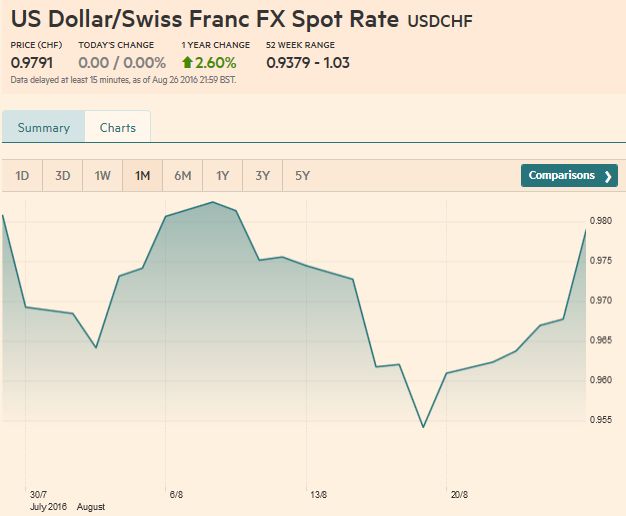 Click to enlarge. |
Marc Chandler
My articles My offerMy siteAbout meMy videosMy books
Follow on:LinkedINTwitterSeeking AlphaAmazon
month. OPEC and non-OPEC nations will meet and the prospects of a freeze appear to have increased (though we are still skeptical). In Spain, after two elections and another two months of negotiations, Rajoy will seek a confidence vote next week. Italy’s tragic earthquake may allow greater fiscal flexibility for Renzi just in time for the 2016 draft budget and the
constitutional referendum (November). Germany will hold two state elections in September that some will see as a litmus test of public support
for Merkel. Without the UK playing obstructionist, the European Summit may lead to greater defense and security integration. The G20 meeting is unlikely to resolve much, but it will be a showcase for China.
US DollarFor eight sessions, the Dollar Index has bounced between 94.00 and a little 95.00, where the 100-day moving average is found.
Our bias is for an eventual upside break. The RSI is soft but sideways, while the MACDs appear poised to turn higher. The slow Stochastics also are turning from over-sold territory. The Dollar Index closed above the 95.30 area, which houses a retracement objective and the 20-day moving average. The Dollar Index has not closed above this average since July 28. A break of 94.00 undermines the bullish case.
|
US Dollar Index(see more posts on the US Dollar Index) 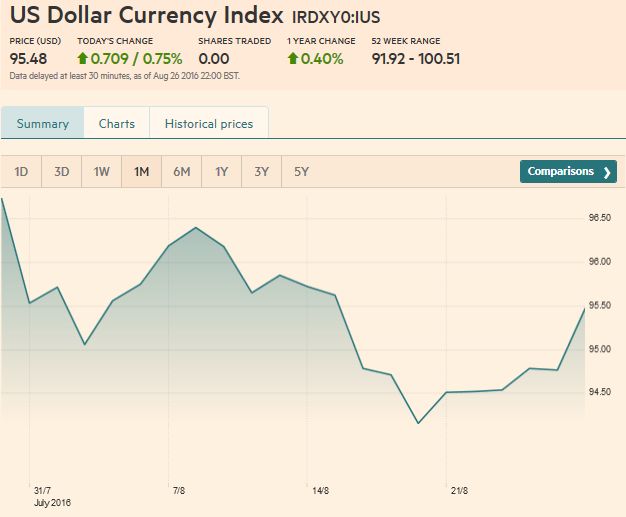 Click to enlarge. |
EUR/USDThe euro recorded outside day down day before the weekend though the previous day’s range was exceptionally narrow (4/10 of a penny). The technical condition is broadly similar to the Dollar Index in reverse. The RSI is firm but neutral. The MACDs are set to cross lower, and the slow Stochastics have turned lower. The euro closed below the trendline off the late-July and August lows (~$1.1240) and the 100-day moving average (~$1.1225). It needs to be sold through $1.1180-$1.12 to boost confidence that a high is in place.
|
Euro Dollar(see more posts on the EUR/USD) 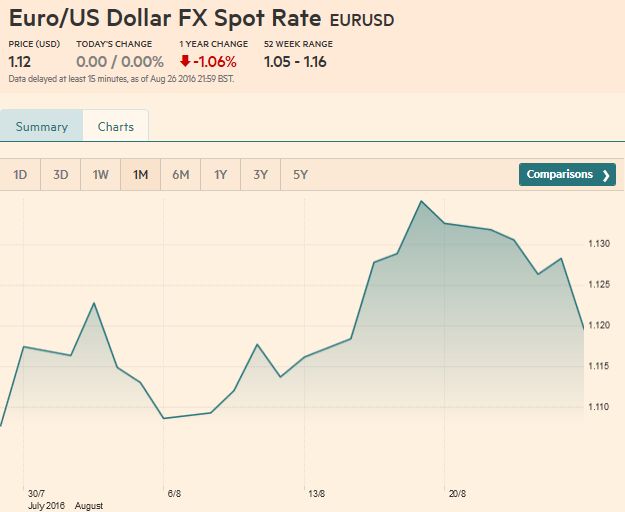 Click to enlarge. |
USD/JPYAlthough key support near JPY100 was frayed, the dollar managed to hold above it for the last three sessions. The technical signals are improving. The RSI is slowly moving higher, and the MACDs have turned up, as have the slow Stochastics.
The dollar closed above the JPY101 area where a retracement objective and the 20-day moving average converge. The next barrier is in the JPY102.00-JPY102.60 band. A campaign through JPY103 would negate the potential head and shoulders potential continuation pattern we previously identified.
|
Dollar Yen(see more posts on the USD/JPY) 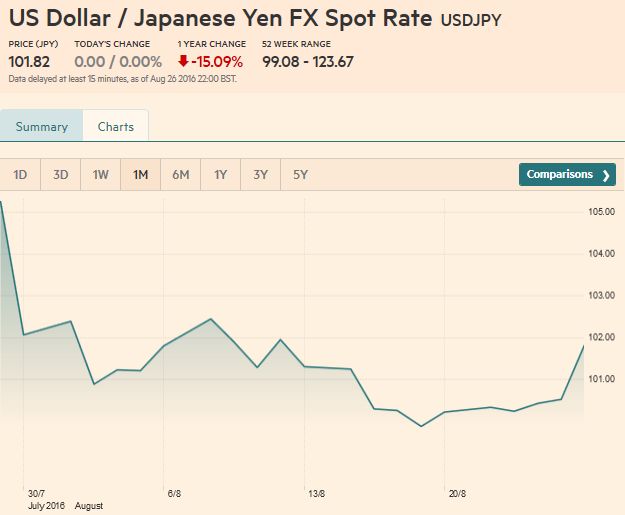 Click to enlarge. |
GBP/USD
|
GBP/USD(see more posts on the British pound) 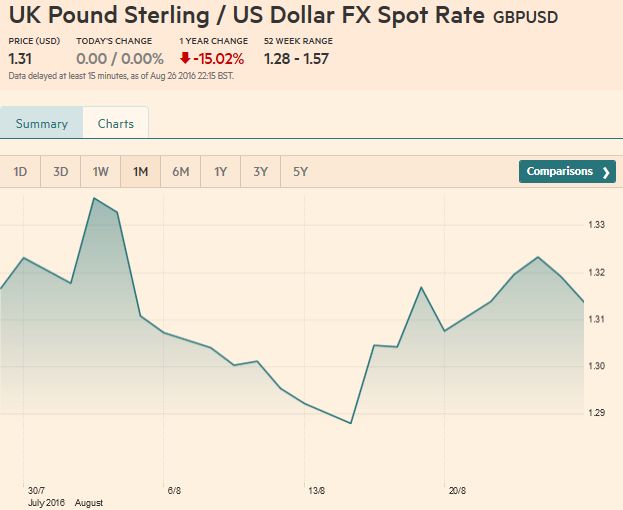 Click to enlarge. |
AUD/USDThe Australian dollar posted an outside down day. It transversed the six-day range in about six hours before the weekend. It also took out the shelf near $0.7580. The five-day moving average has pushed through the 20-day moving average for the first time since the start of the month. The RSI, MACDs, and Stochastics are grinding lower. A break of the shelf would spur a test on the trendline off the late-May and late-July lows. It is found near $0.7560 at the start of the week and rises about five ticks a day. A loss of the trendline would be suggestive that a top of some import is in place. A move toward $0.7380-$0.7450 would still be the realm of a correction. |
AUD/USD(see more posts on the Australian Dollar) 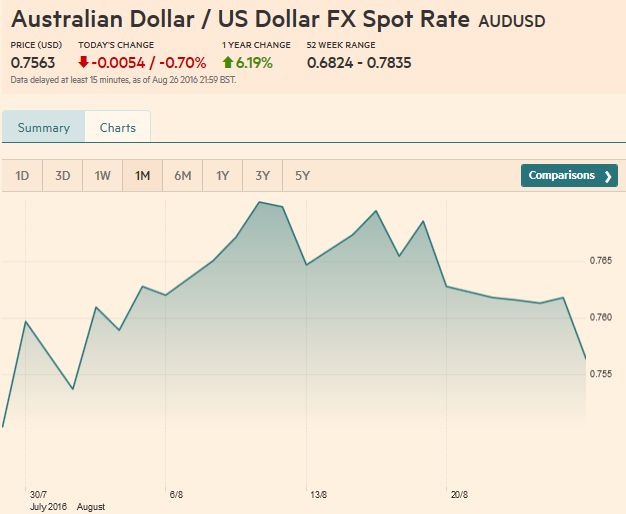 Click to enlarge. |
USD/CADThe US dollar finished at two-week highs against the Canadian dollar to kiss the 20- and 50-day moving averages (~CAD1.2985and ~CAD1.2995).
Oil snapped a three-week advance and the probability of a Fed hike increased. The US two-year premium over Canada stands is the largest since the middle of June. A move above CAD1.3030 could spur a move to CAD1.3100 trendline off the late-July and early-August highs, on the way toward CAD1.3200.
|
USD/CAD(see more posts on the Canadian Dollar) 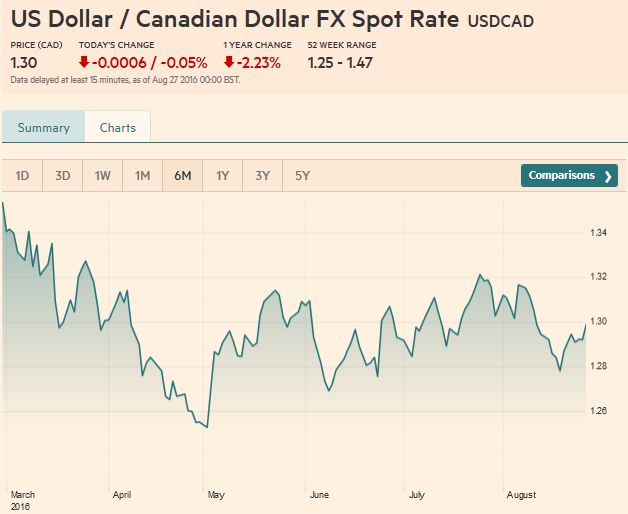 Click to enlarge. |
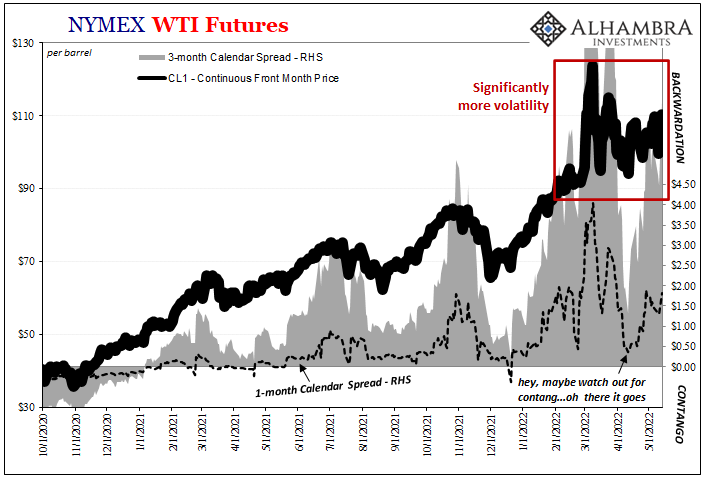
Crude Oil
|
Crude Oil (one year chart)(see more posts for Crude Oil) 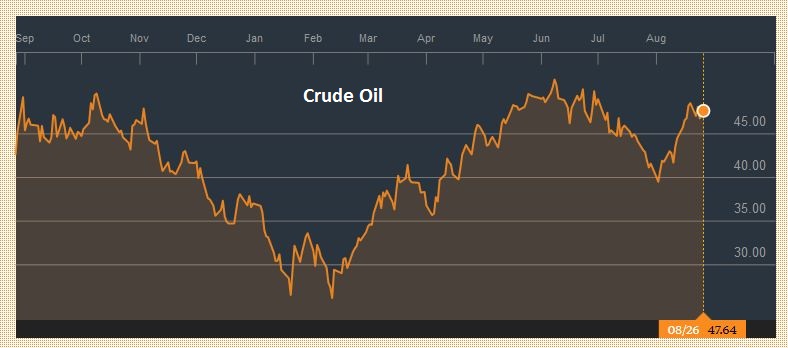 Click to enlarge. |
US TreasuriesThe US 10-year yield spent the better part of August churning between 1.50% and 1.60%. It set its highest close since the day after the UK voted in late-June. The 1.63%-1.64% is the next immediate hurdle, but yields fell so quickly there is little to hang one’s hat on until 1.70%-1.75%. We had identified the 131-19 area basis the September futures contract as important support.
|
US Treasuries
(one year char) 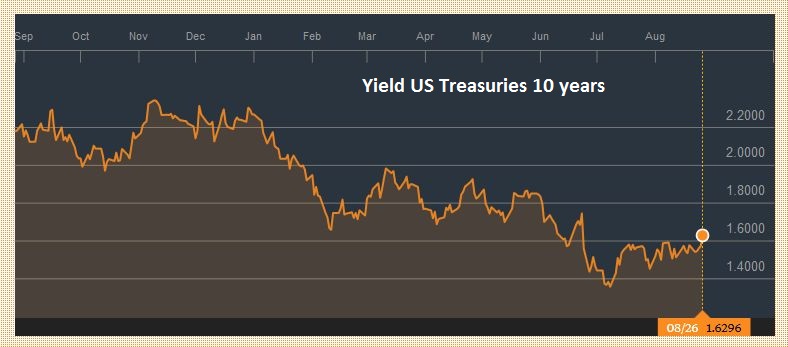 Click to enlarge. |
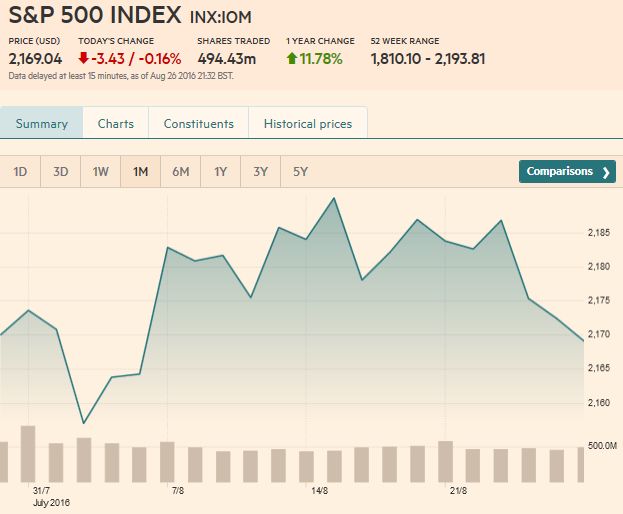
S&P 500Friday was cruel to the S&P 500. It posted an outside down day to close at its lowest level in three weeks. The five-day moving average slipped below the 20-day moving average for the first time since early-July. The technical tone, as we have noted, has been deteriorating.
The MACDs, for example, have been trending lower for over a month. The slow Stochastics are also trending lower. The resilience of the S&P 500 may be, at least in part, explained by the expectations o flower for longer in terms of interest rates. The nextlevel of support is seen in the 2147-2150 area. If it goes, it would signal a correction to the rally since mid-June. The 38.2% retracement is near 2116, which is near
the 100-day moving average (~2110). The 50% retracement is near 2093.
|
 Click to enlarge. |
Charts and CHF data added by George Dorgan and the snbchf team, Text Posted by Marc Chandler on Marc to Markets,
Are you the author?Tags: Canadian Dollar,Crude Oil,Dollar Index,EUR/CHF,EUR/USD,MACDs Moving Average,newslettersent,Swiss Franc Index,U.S. Treasuries,USD/CHF