Summary:
The Australian dollar’s technical condition has soured.
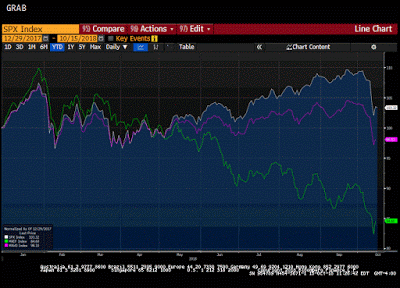
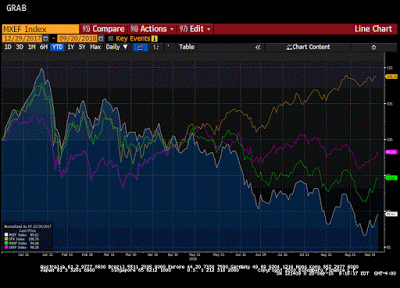
Market sentiment may be changing as the MSCI World Index of developed equities posted a key reversal yesterday.
It is not clear yet whether the Aussie is correcting lower or whether there has been a trend change.
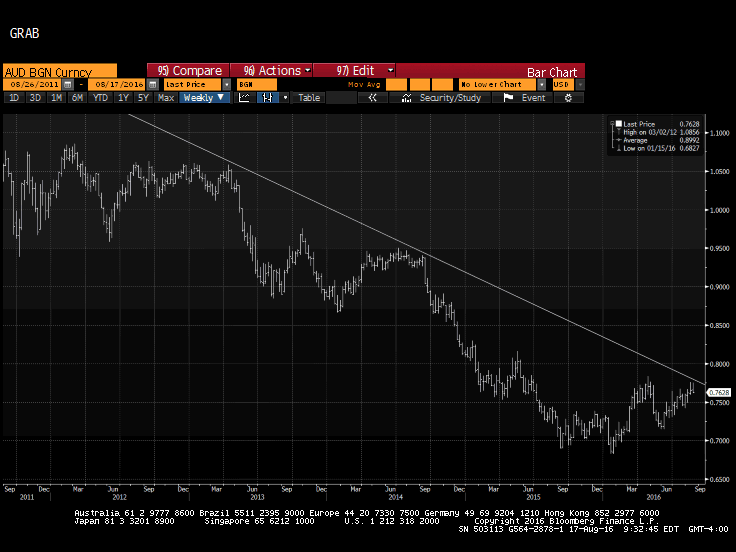
| Since late July, I have been looking for the Australian dollar to turn lower. Instead, the Aussie has continued to climb. It has risen in ten of the past eleven weeks. As this Great Graphic, created on Bloomberg, these gains have brought, the Australian dollar toward a three-year downtrend line drawn off the April 2013 and the June-July highs from 2014.
The downtrend line is found near $0.7850 now, which is a little above the year’s high set in April (~$0.7835). The Australian dollar has turned lower, yesterday and today. It is off 1% today, the most in a month. The losses are turning technical indicators like the RSI and MACDs lower. Initial support is seen a little below $0.7600. It is a retracement objective of the leg up since late-July and the 20-day moving average. Below there is the $0.7520, which is another retracement objective and the objective of a potential double top (~$0.7755 on August 10 and ~$0.7750 on August 16, with neckline near $0.7635). A break could signal a return to those late-July lows near $0.7420. Australia will report July’s employment first thing tomorrow in Sydney. It is a particularly volatile report. After creating a net 7.9k jobs in June, Australia is expected to have grown another 10k jobs in July. This understates the results. Some 38.4k full-time positions were created in June. Proportionate to the US population, it would as if non-farm payrolls jumped almost 540k. Some payback should be expected. In any event, the labor market improvement is not the main concern of the central bank |
Full story here Are you the author? Previous post See more for Next post
Tags: Australian Dollar,Great Graphic,newslettersent


